The global crypto market cap has shed 2.37% over the past two weeks, following a failed recovery on March 17, as institutional holders have pulled back and futures traders have positioned net short amid uncertainty over the U.S./Israel/Iran conflict.
Ethereum’s U.S. spot ETFs are on track to close Q1 2026 in the red.
RIVER surged after its Base chain launch, but a negative CMF reading signals a near-term pullback, while HYPE’s descending channel and bearish MACD structure point to downside risk.
The global cryptocurrency market cap has declined steeply following a brief recovery attempt on March 17. At $2.37 trillion at press time, it has plunged by 2.37% in the past two weeks.
This is due to the macro uncertainty surrounding the ongoing U.S./Israel/Iran conflict, which has continued to dampen appetite across digital asset markets.
Across several assets, institutional holders have reduced exposure, futures traders are net short, and in spot markets, traders are adopting a wait-and-see approach.
As traders prepare for a more downtrodden market, CCN has compiled a list of altcoins you should keep an eye on in April.
Ethereum: ETF Outflows and Collapsing CME Interest Paint a Bearish Picture
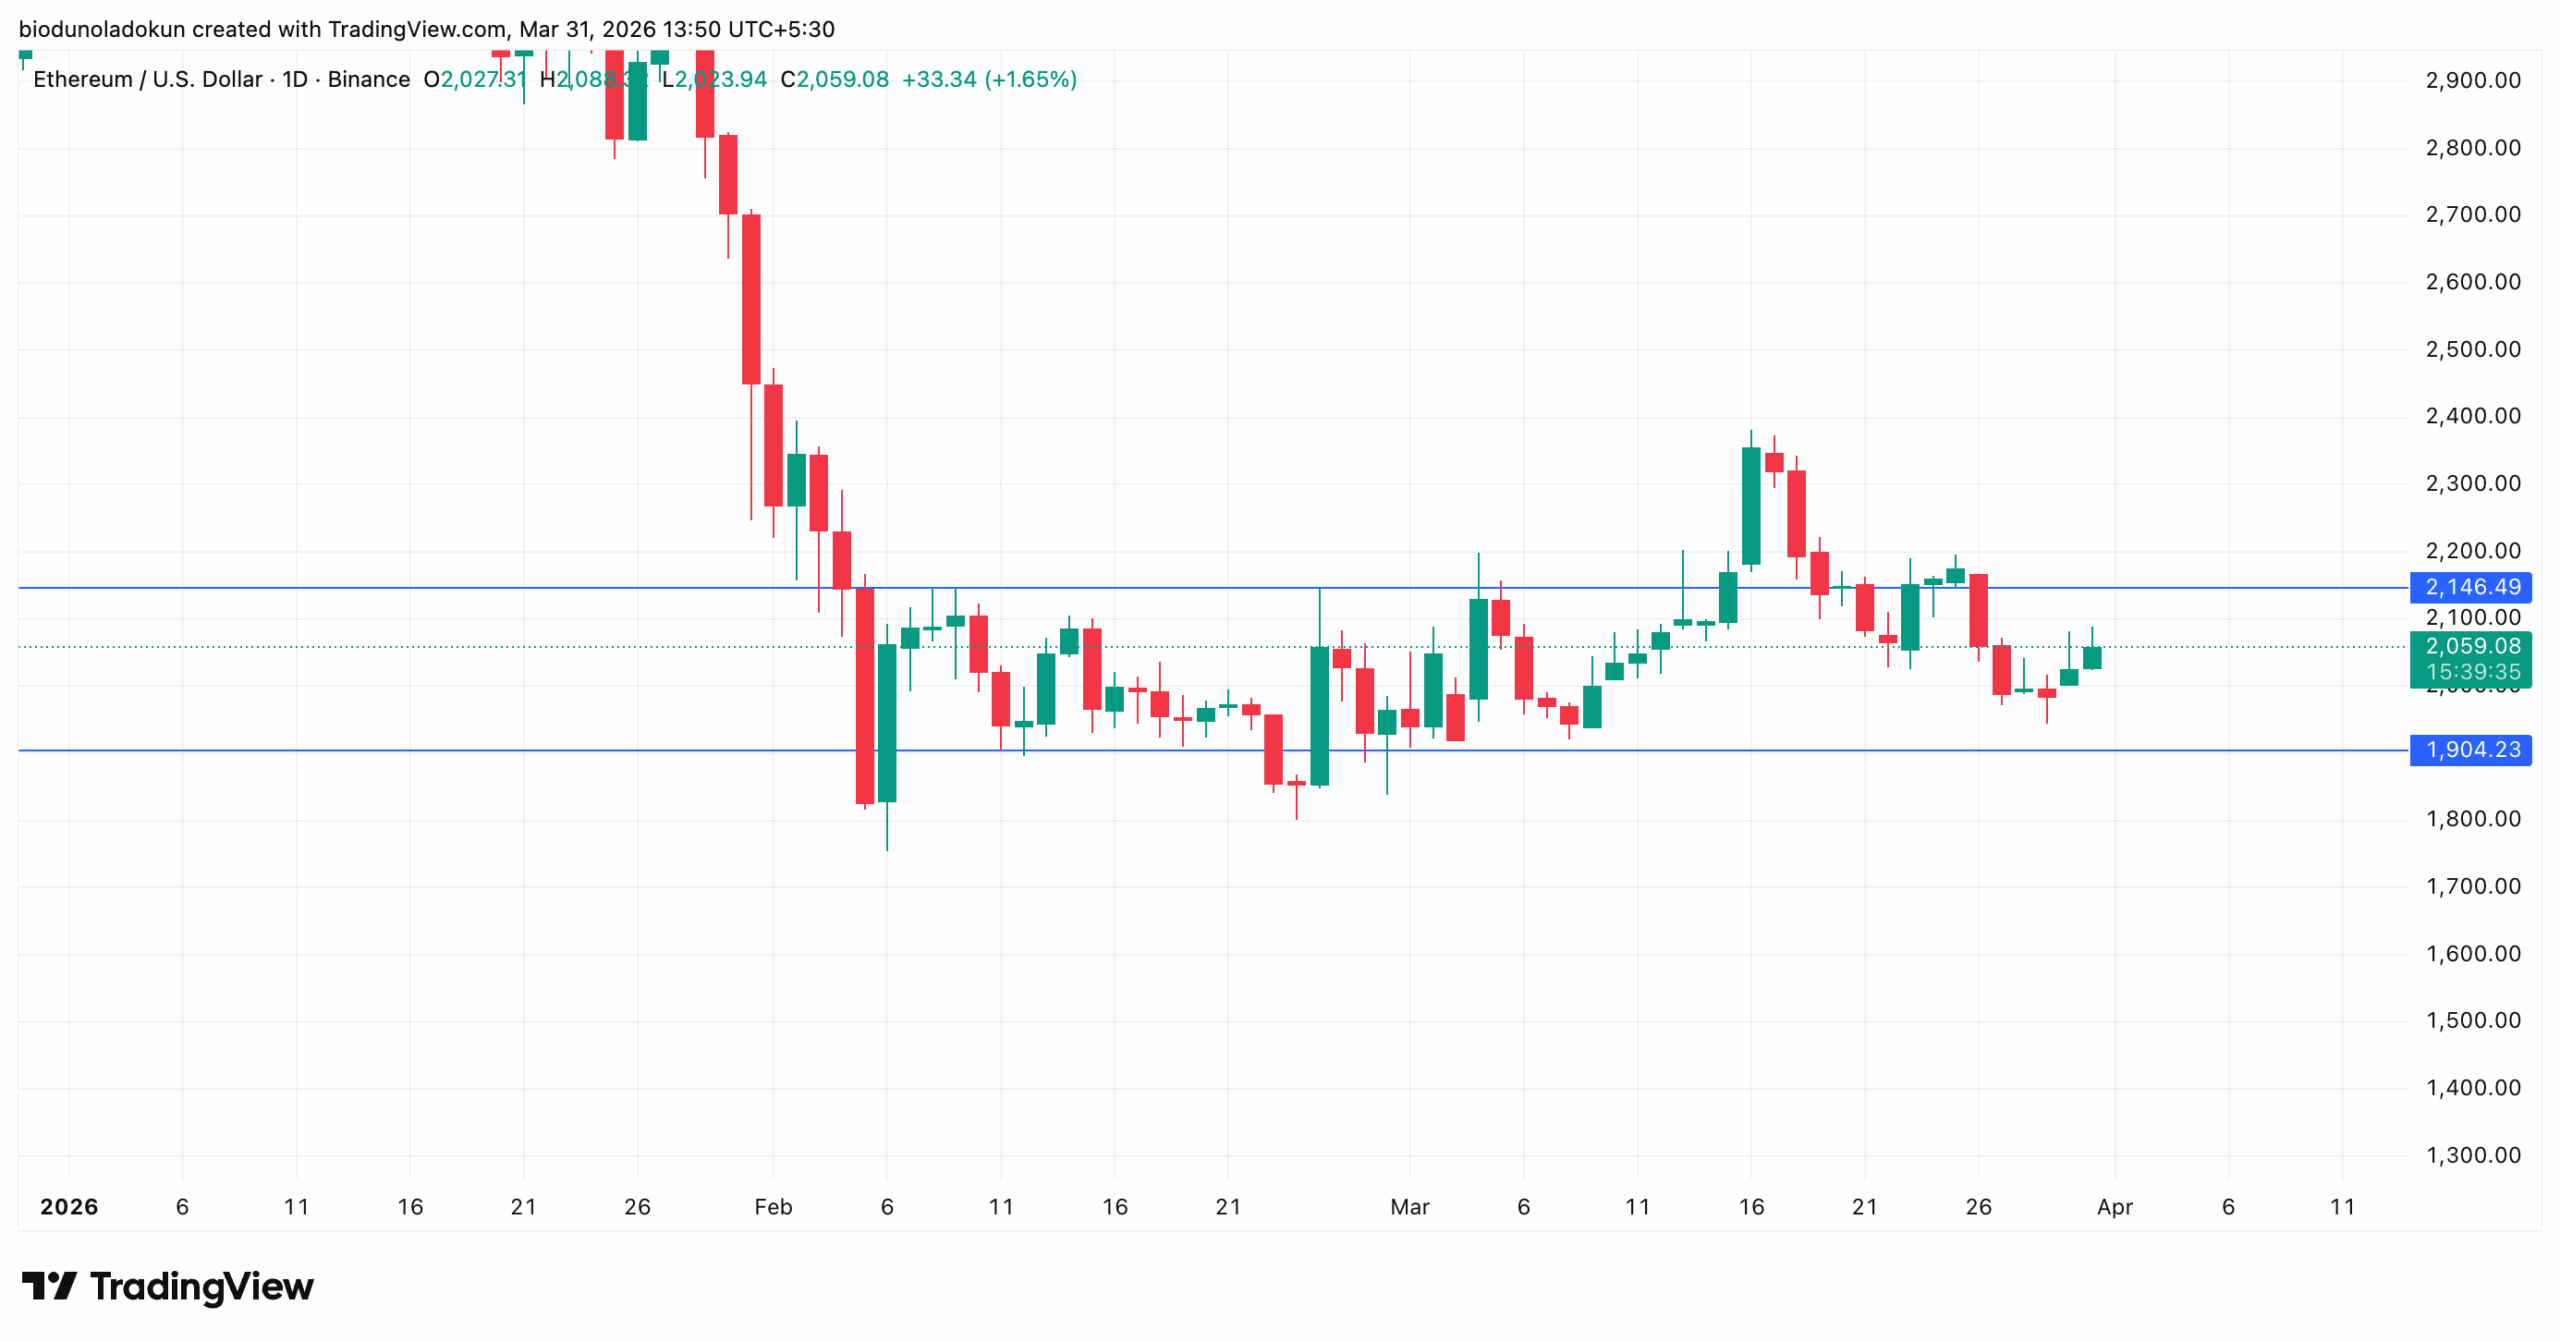
Leading altcoin Ethereum has trended within a horizontal channel since February 4. It has since faced strong resistance at $2,145 and has found support at $1,904.
While it has repeatedly attempted to close and hold above this resistance line, it has been met with strong pullbacks as broader market underperformance forces people to sell into the rally when the coin notes a slight uptick.
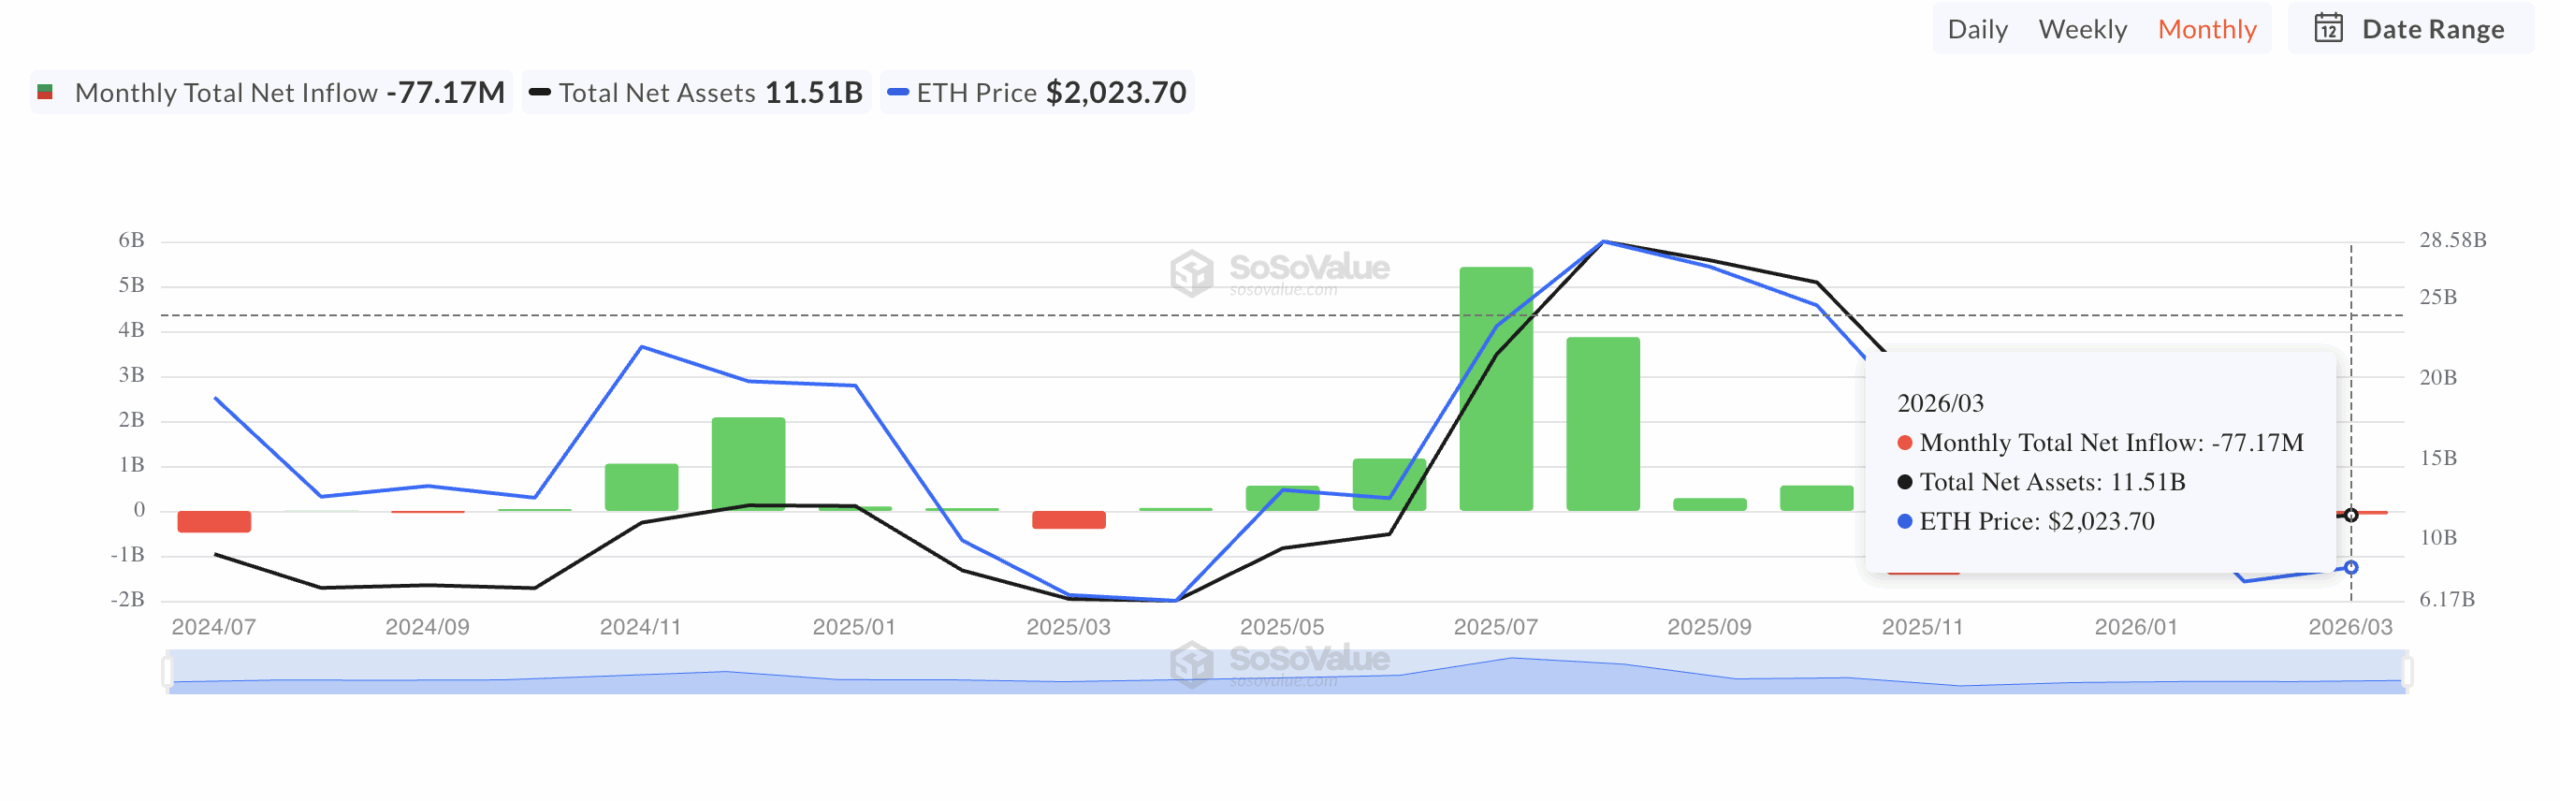
The price action has done little to inspire institutional confidence. Monthly inflows into Ethereum’s U.S. spot ETFs have been steadily declining, a trend reflecting waning appetite among larger players.
According to SoSoValue, ETH’s U.S. spot ETFs are on course to close Q1 2026 in the red, with March alone recording net outflows of $77.17 million.
Total Ethereum Spot ETF Net Inflow | Credit: SoSoValue
The trend is not new: these vehicles have been bleeding capital since August 2025, pulling ETH’s price down with them. If this continues into April, ETH’s price may fall below $2,000.
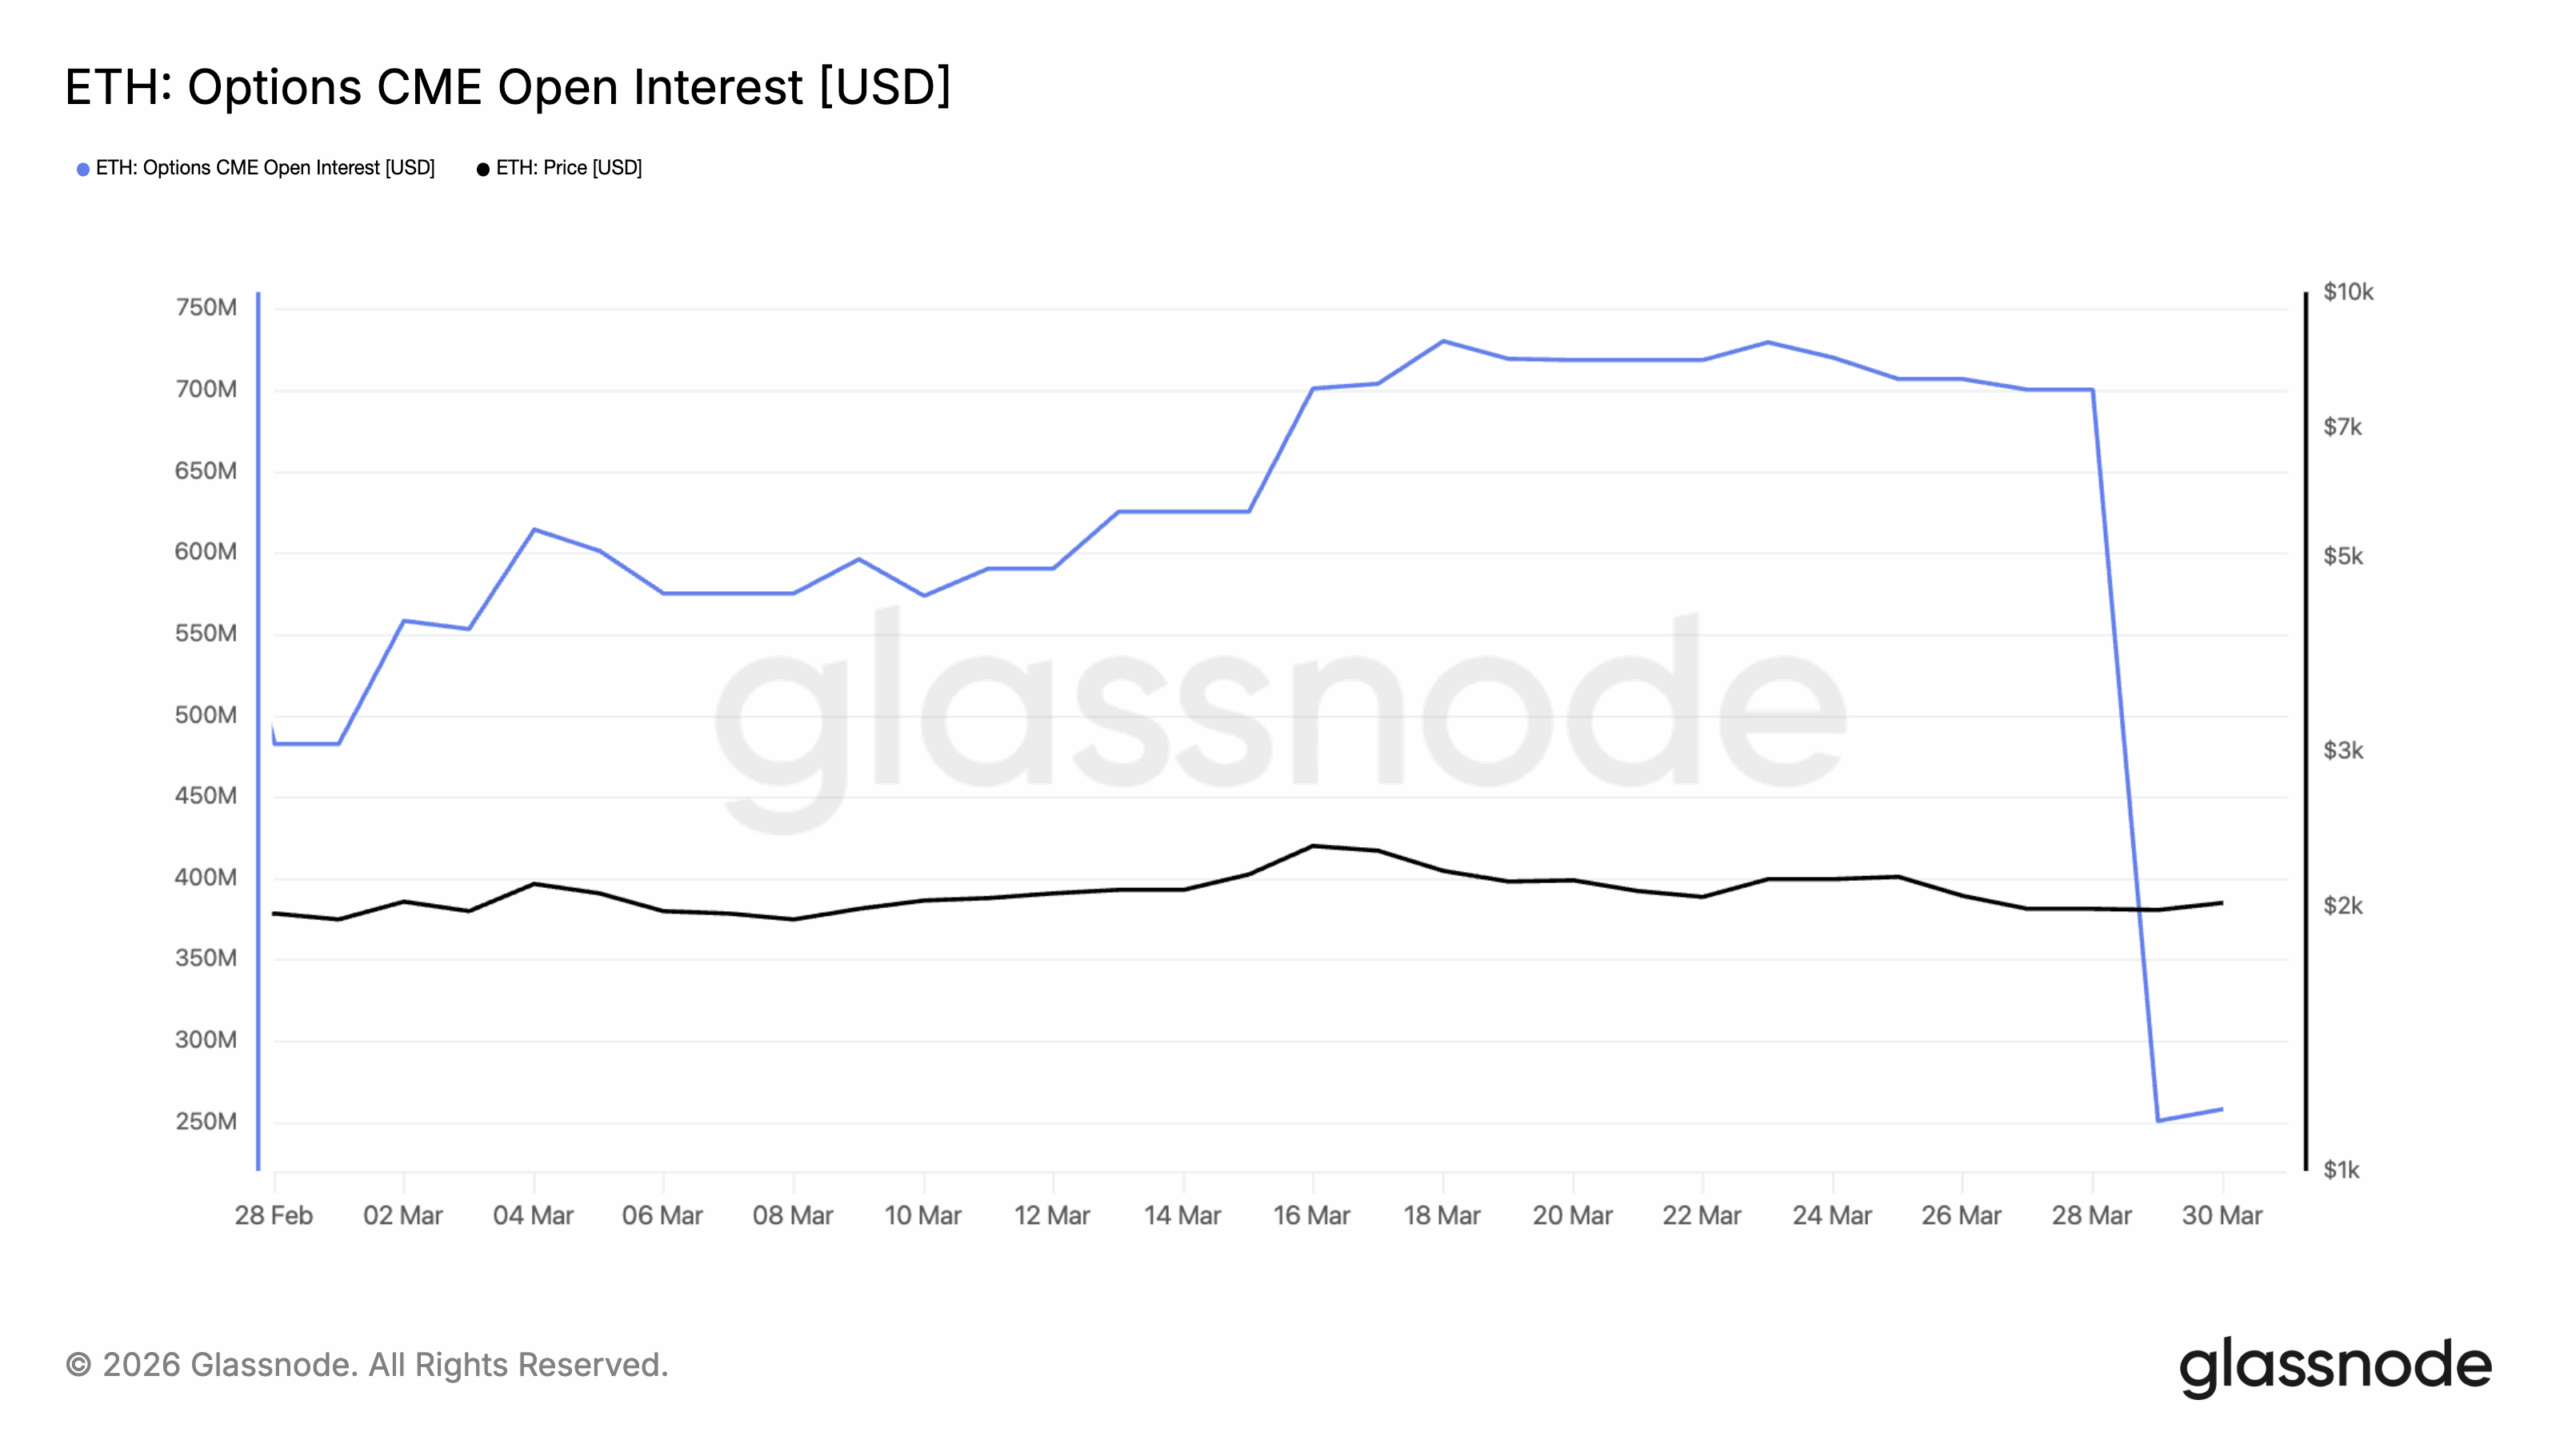
Furthermore, the past few days have been marked by a significant dip in open interest in ETH options contracts on the Chicago Mercantile Exchange (CME).
Per Glassnode, this closed at a 30-day low of $251 million on March 29, falling from a monthly peak of $730 million recorded on March 18, marking a whopping a 66% drop in under two weeks.
This dip is significant for several reasons. CME options open interest is a reliable gauge of institutional engagement. It tracks how whales, professional desks, funds, and hedgers operate in a regulated derivatives environment.
So when it falls like this, it means these key players are closing out their positions entirely, often because they see little near-term value in maintaining any ETH exposure.
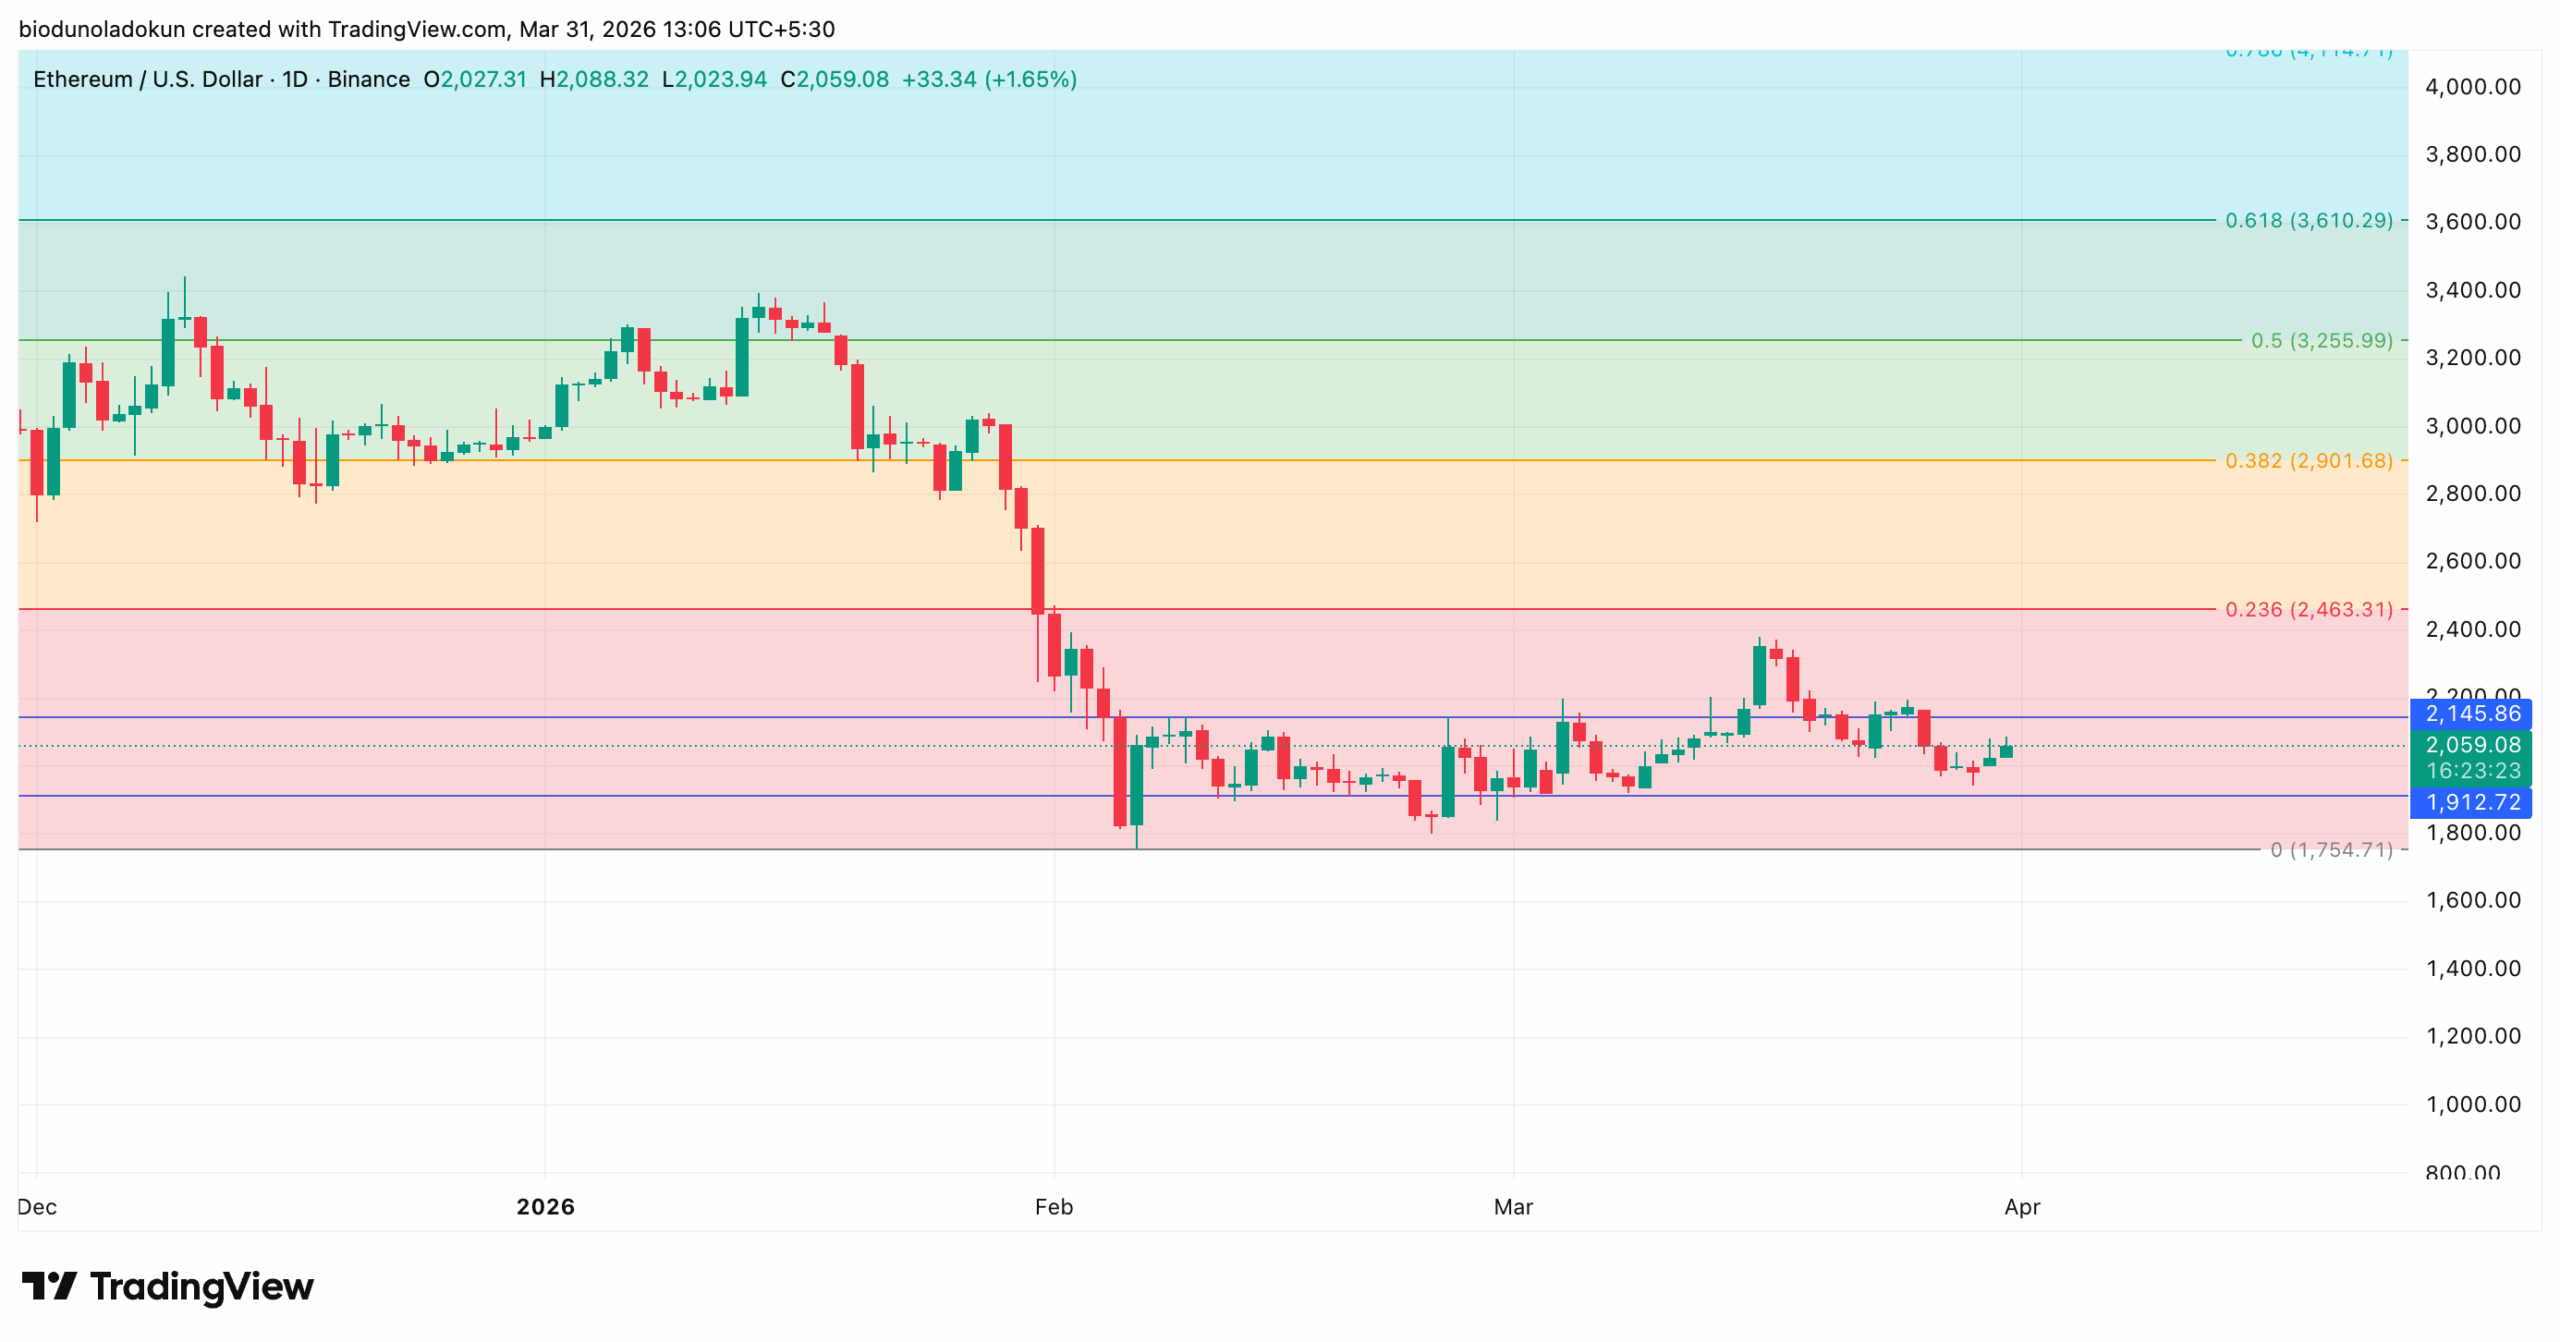
With ETH already struggling to hold above $2,000 and institutional holders stepping away, the coin risks further downside in April. A close below the support at $1,912 could lead to a drop to $1,754.
However, if sentiment improves, ETH could close above $2,145 and surge towards $2,463
RIVER Surges After Base Launch — But Bearish Divergence Signals a Pullback
Following its deployments on Ethereum and BNB Chain, the chain-agnostic stablecoin system River launched on Base on Monday, driving up demand for its RIVER native token.
This has pushed up the token’s value by 34% over the past day, making it the market’s top gainer during that period.
However, readings from RIVER’s technical indicators hint at a near-term pullback in the token’s value.
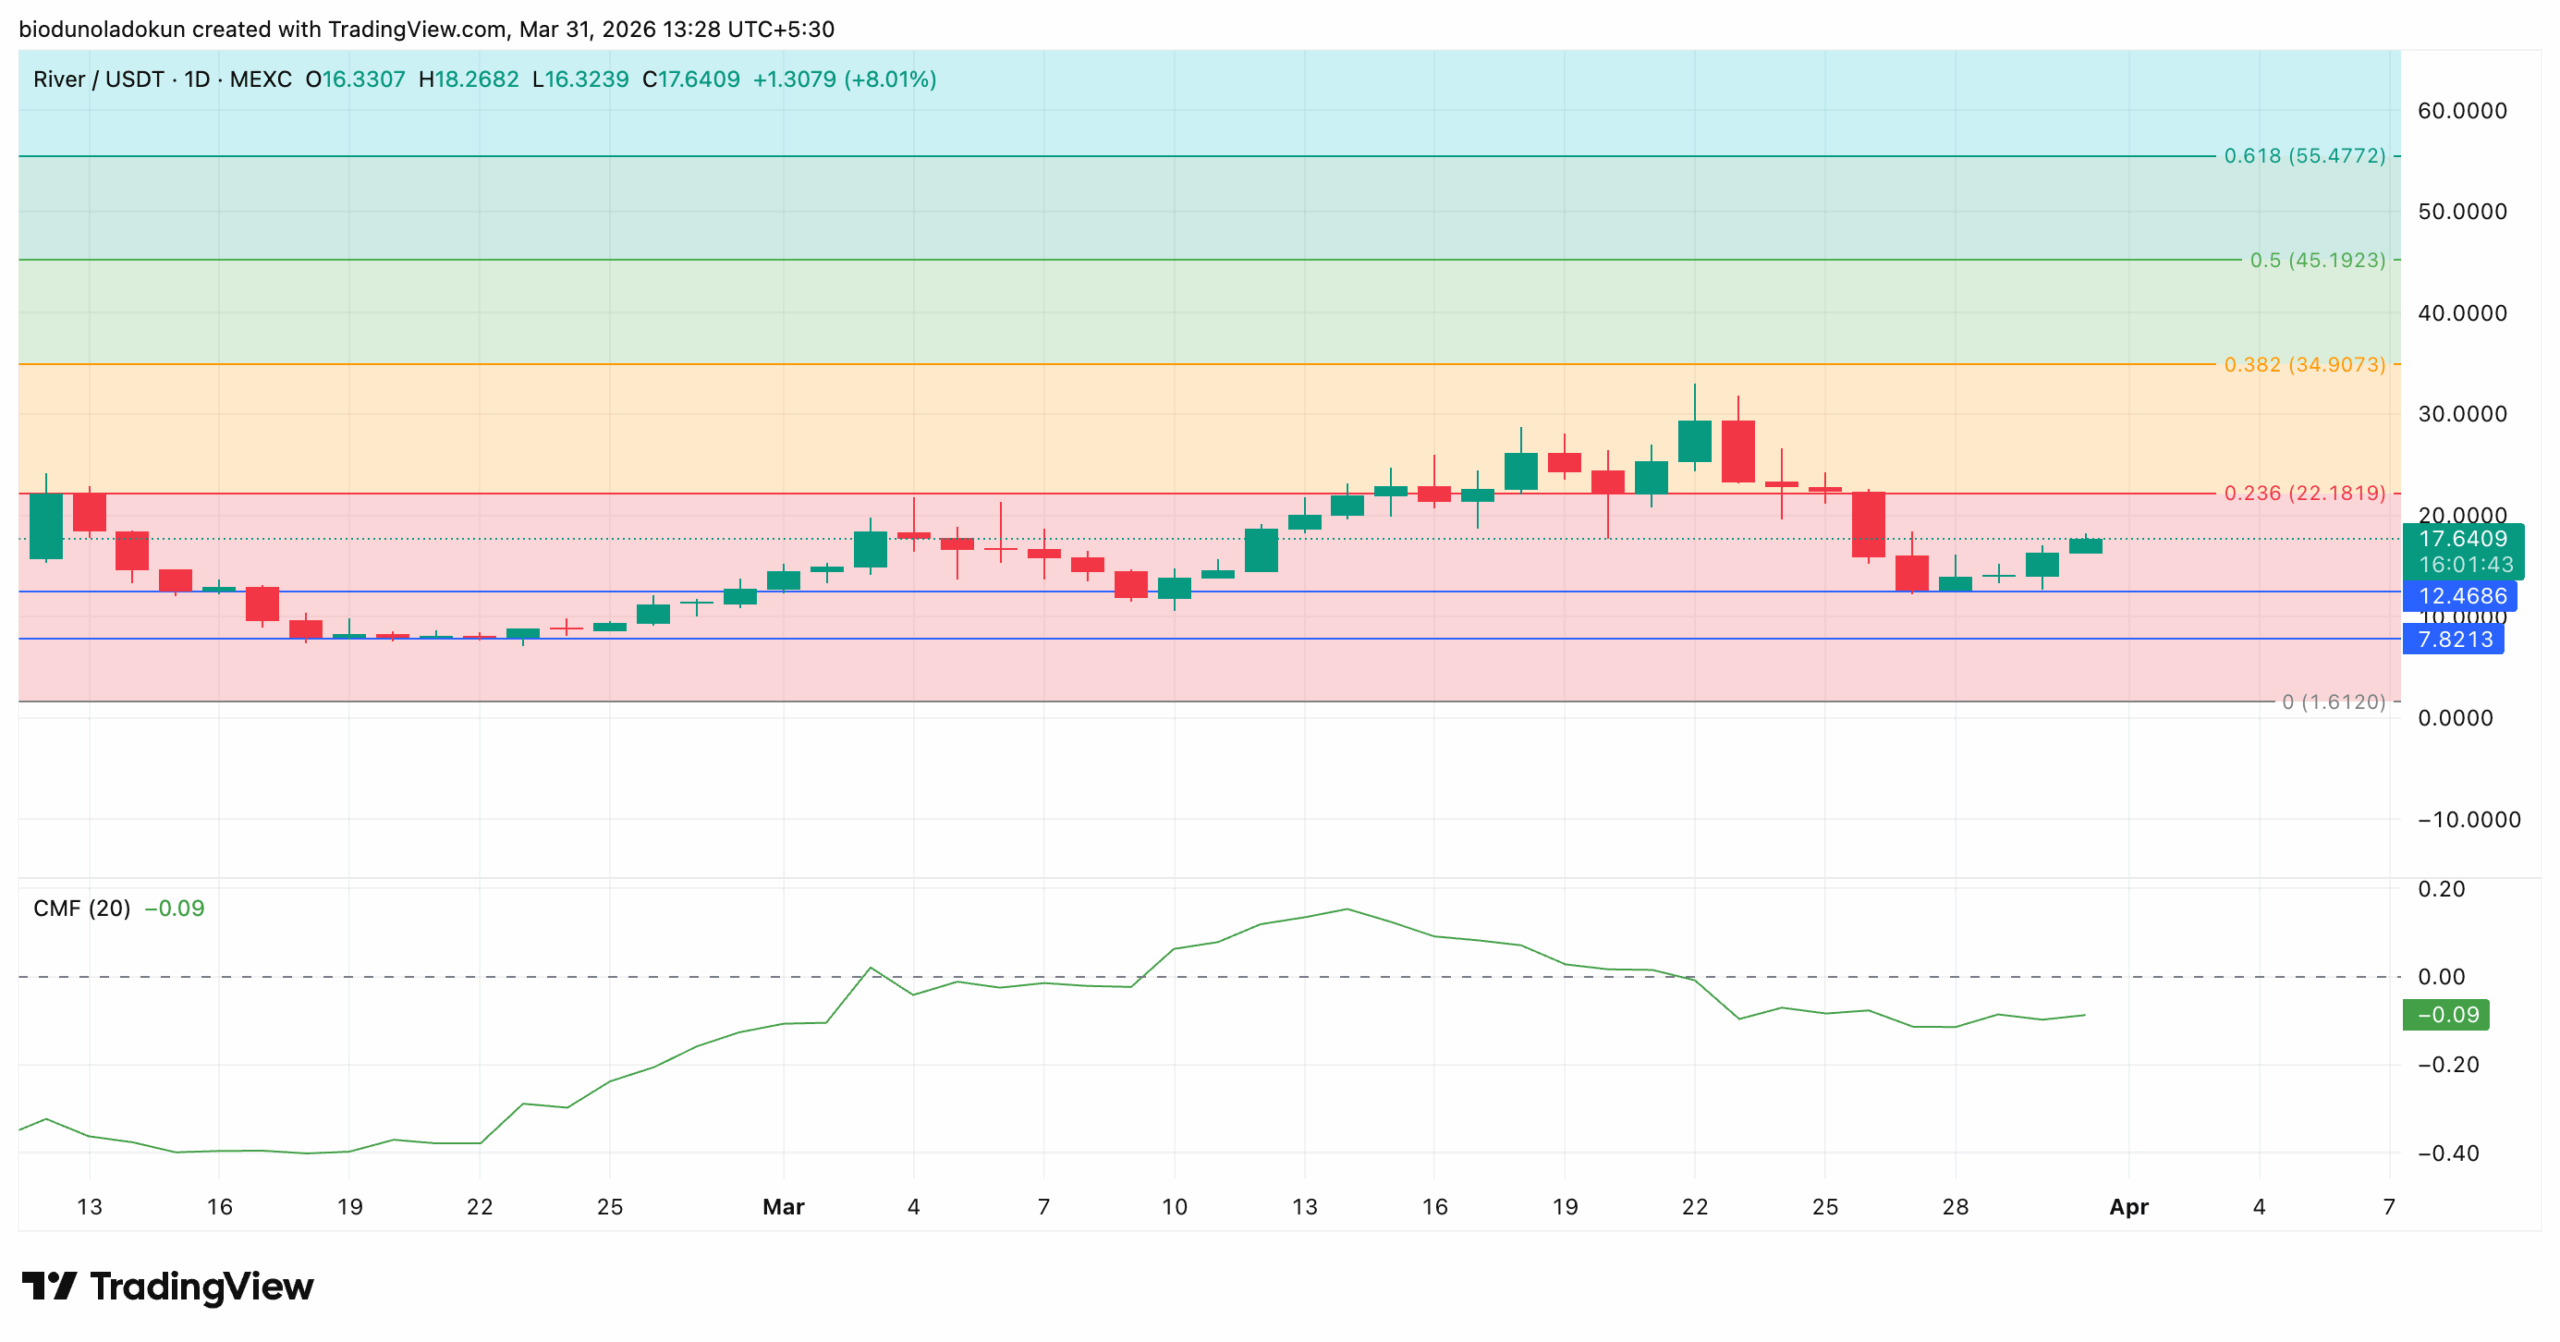
For example, while RIVER has trended higher over the past four sessions, its Chaikin Money Flow (CMF) remains below zero, maintaining a bearish divergence. As of this writing, this momentum indicator, which tracks capital inflows and outflows, is at -0.09.
A bearish divergence occurs when an asset’s price continues to climb while its CMF indicator trends downward. This means that less capital flows into the asset despite the price growth.
Such divergences typically precede pullbacks, suggesting that RIVER’s short-term momentum could weaken soon.
In this scenario, RIVER could shed some of its recent gains and plummet to $12.46. Failure to maintain this price floor could lead to a further dip to $7.82 through April.
Conversely, if new demand returns to the market, RIVER would gain strength and could extend its gains to $22.18.
Hyperliquid OI Hits $1.99B All-Time High, But HYPE Price Structure Turns Bearish
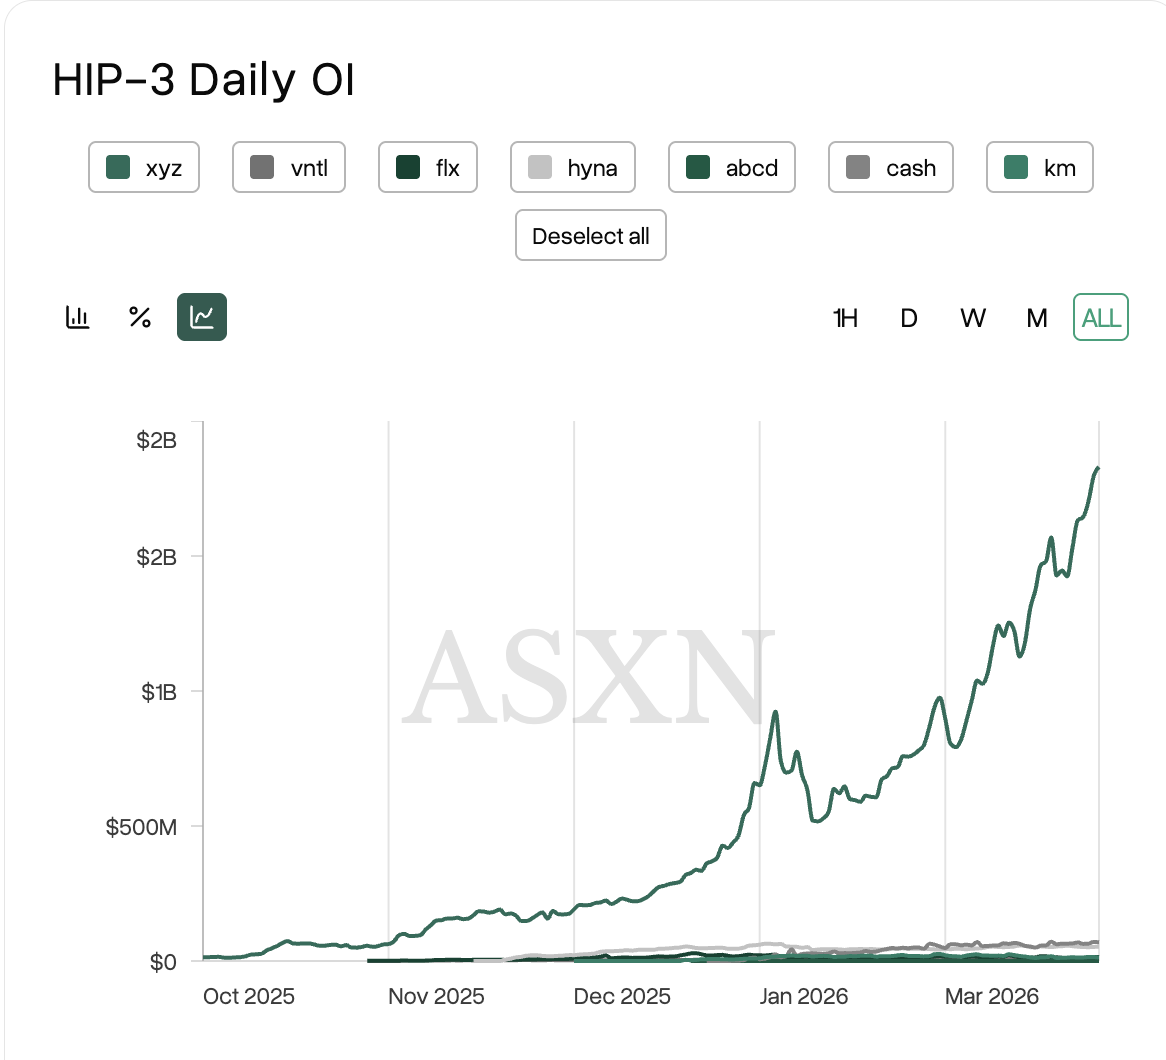
With the U.S./Israel/Iran conflict extending into April, demand for round-the-clock tokenized real-world asset (RWA) perpetual contracts on Hyperliquid is expected to climb.
This will further push up total HIP-3 daily open interest, which currently sits at an all-time high of $1.99 billion.
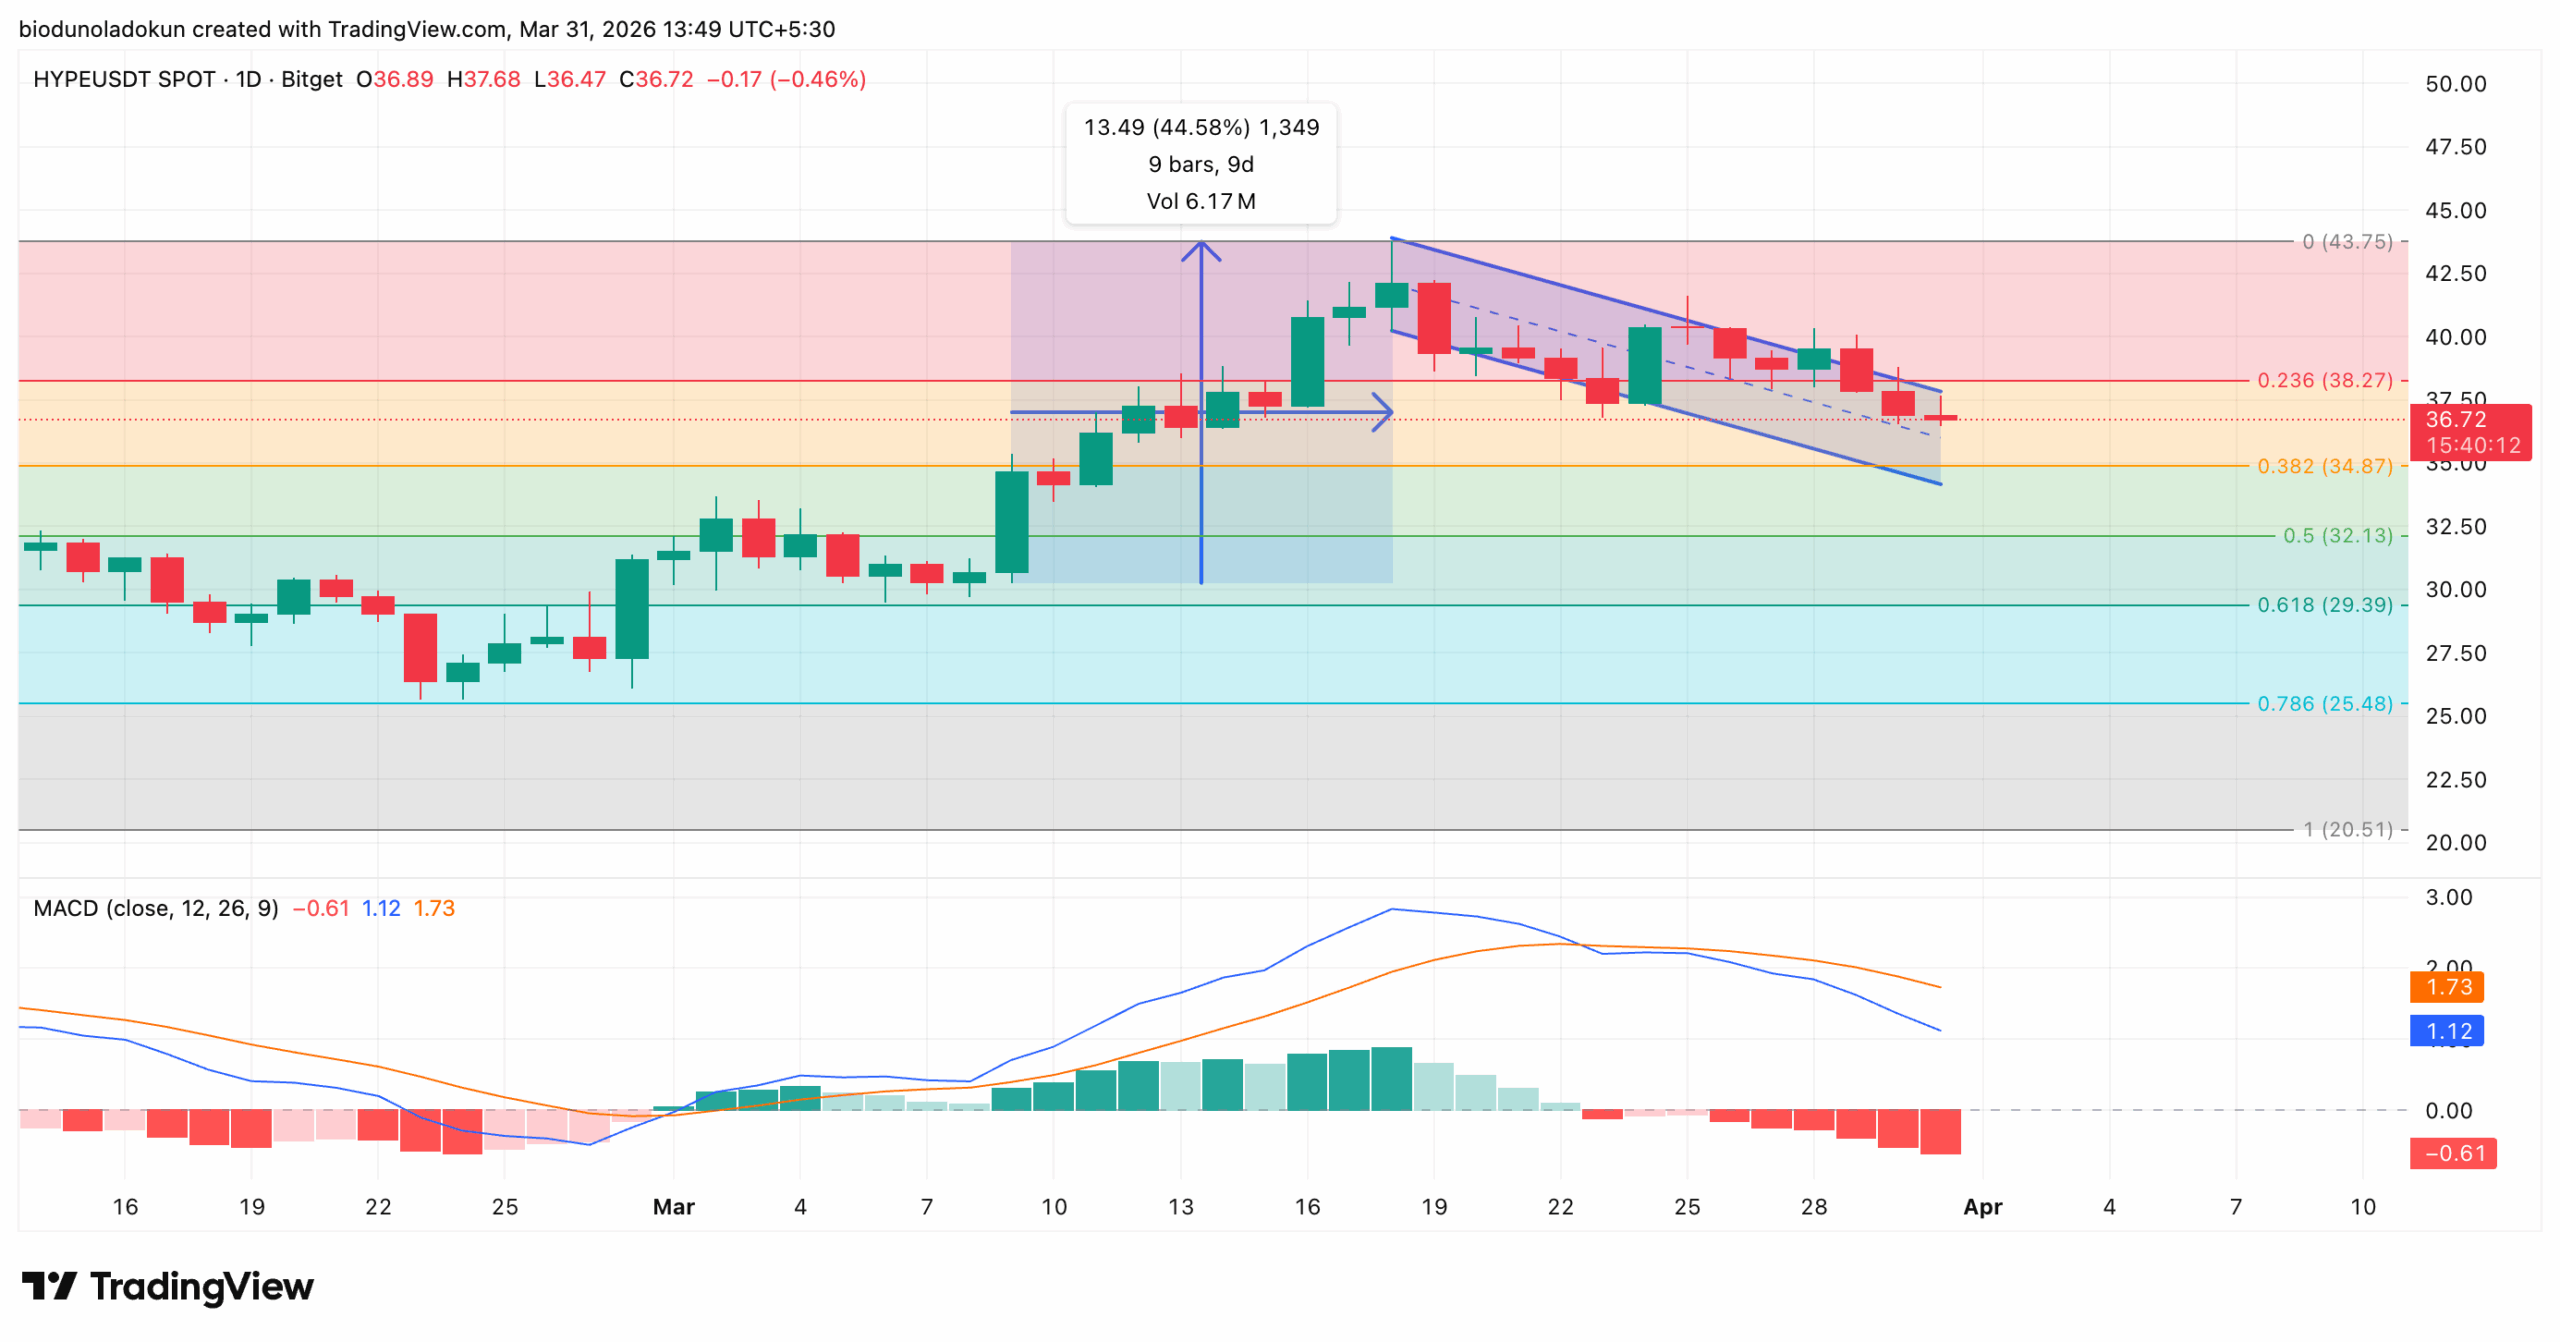
The surge in user activity on Hyperliquid drove strong demand for the HYPE token in the first half of March, pushing the altcoin up 44% between March 9 and March 18.
However, the momentum has since stalled. Since that peak, HYPE has been trading within a descending parallel channel, a trend that signals fading buy-side pressure and the potential for further downside.
The Moving Average Convergence Divergence reinforces this bearish read. At press time, the MACD line sits below the signal line, and the indicator has been producing red histogram bars whose size has grown over the past few sessions.
When an asset’s MACD is set up this way, downward momentum is building, and sellers are gaining control.
If sellers strengthen their control in April, HYPE eyes a dip to $34.87.
On the other hand, if accumulation returns to HYPE’s spot markets, it could drive a break above $38.27 and a rally toward $43.75.
[You-may-like]
Disclaimer:
The information provided in this article is for informational purposes only. It is not intended to be, nor should it be construed as, financial advice. We do not make any warranties regarding the completeness, reliability, or accuracy of this information. All investments involve risk, and past performance does not guarantee future results. We recommend consulting a financial advisor before making any investment decisions.
Abiodun Oladokun is a Research Analyst at CCN, where he covers cryptocurrency markets with a focus on on-chain analysis, technical assessments, and emerging trends across decentralized finance (DeFi), real-world assets (RWA), artificial intelligence (AI), decentralized physical infrastructure networks (DePIN), Layer 2s, and meme coins.
Prior to CCN, he served as a Senior On-Chain Analyst at BeInCrypto, producing market reports spanning diverse crypto sectors.
Before that, he conducted technical analysis and market assessments of various altcoins at AMBCrypto, where he also contributed long-form quarterly research papers on DeFi, NFTs, DAOs, and scaling architectures, leveraging on-chain platforms including Messari, Santiment, DefiLlama, and Dune Analytics.
He began his crypto career as a research analyst at SixthSense DAO, developing blockchain forensic tools to trace the history of stolen assets.
Abiodun is a lawyer called to the Nigerian Bar and the founder of Ilé Ijó, a Lagos-based electronic dance music collective.