Bitcoin is on track to close this month as its strongest April since 2020, after spending the month recovering from losses tied to the US–Israel war on Iran and the fragile ceasefire that followed.
Spot Bitcoin ETF inflows have topped $2.44 billion in April, while wallets holding 100–1,000 BTC have added 40,000 coins ($3.1 billion) over the past month, a sign of institutional accumulation.
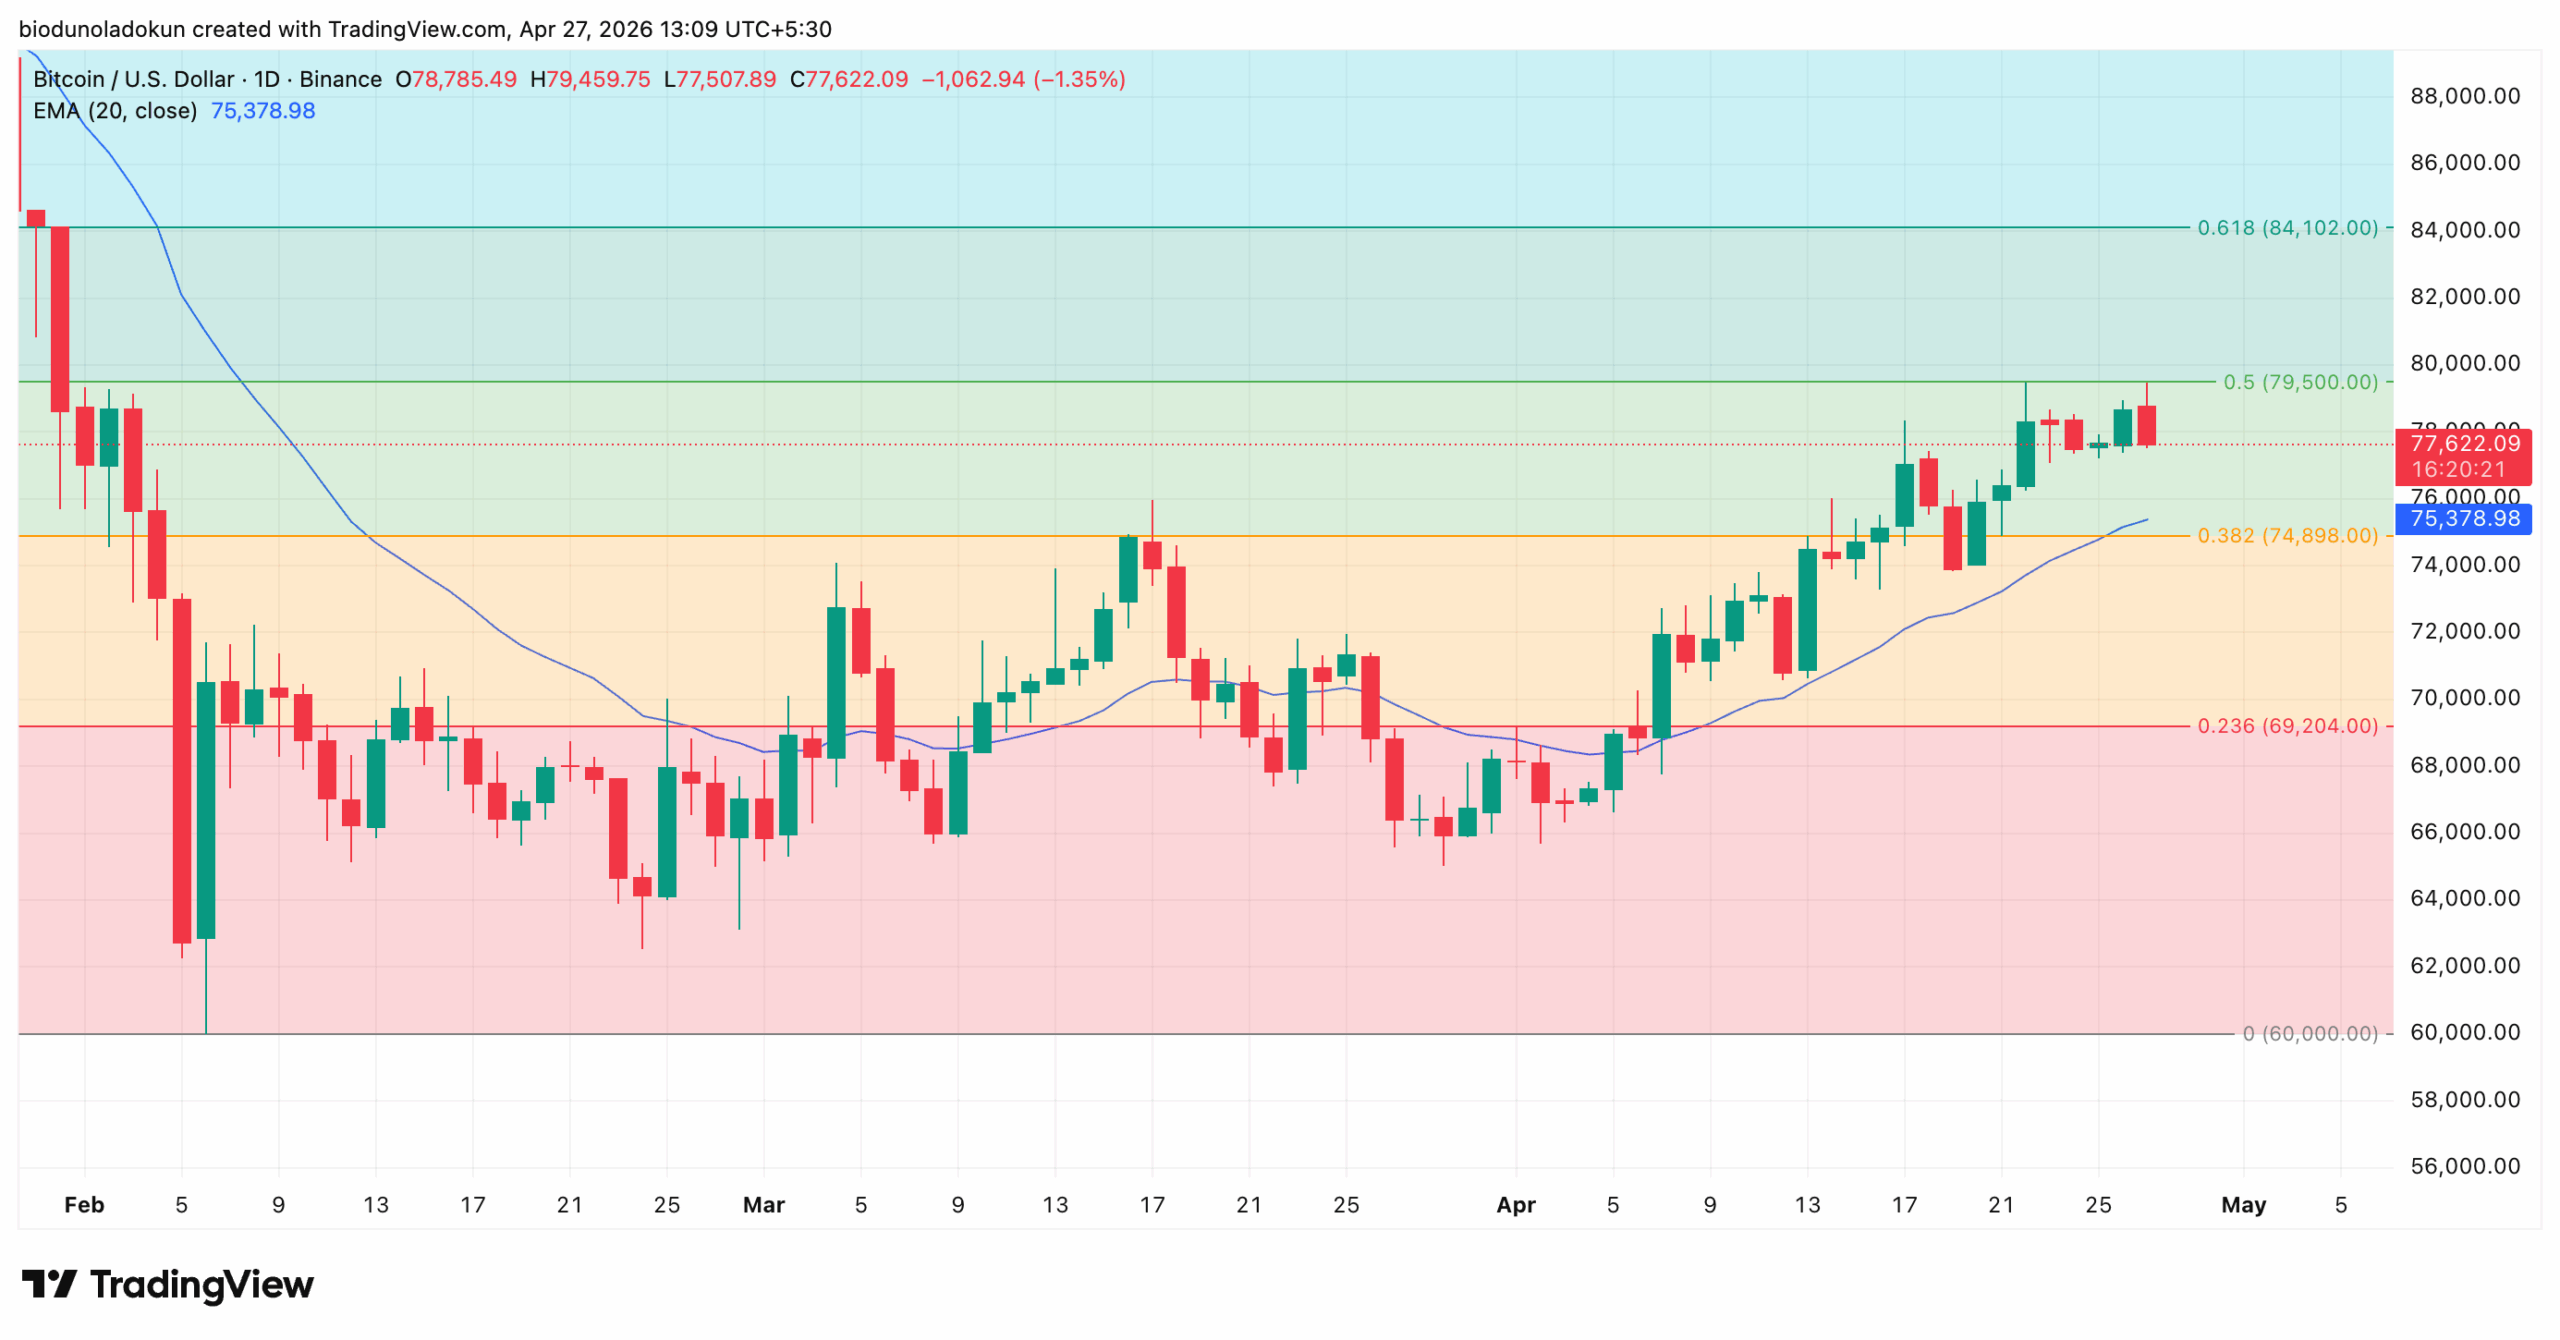
A clean break above the $79,500 resistance would open the path to $84,102.
Bitcoin (BTC) has spent all of April recovering from losses sustained during the US–Israel war on Iran and the fragile ceasefire that followed.
Up 16% since the month began, BTC has maintained a steady uptrend and has recorded its best April performance since 2020.
With on-chain and technical signals converging on the bullish side, BTC is set to extend its gains, hold above $80,000, and push toward the next psychological price level.
Institutional Money Pours Back Into Bitcoin
The improving sentiment and growing demand among key BTC holders following the ceasefire talks are major factors behind its double-digit rally.
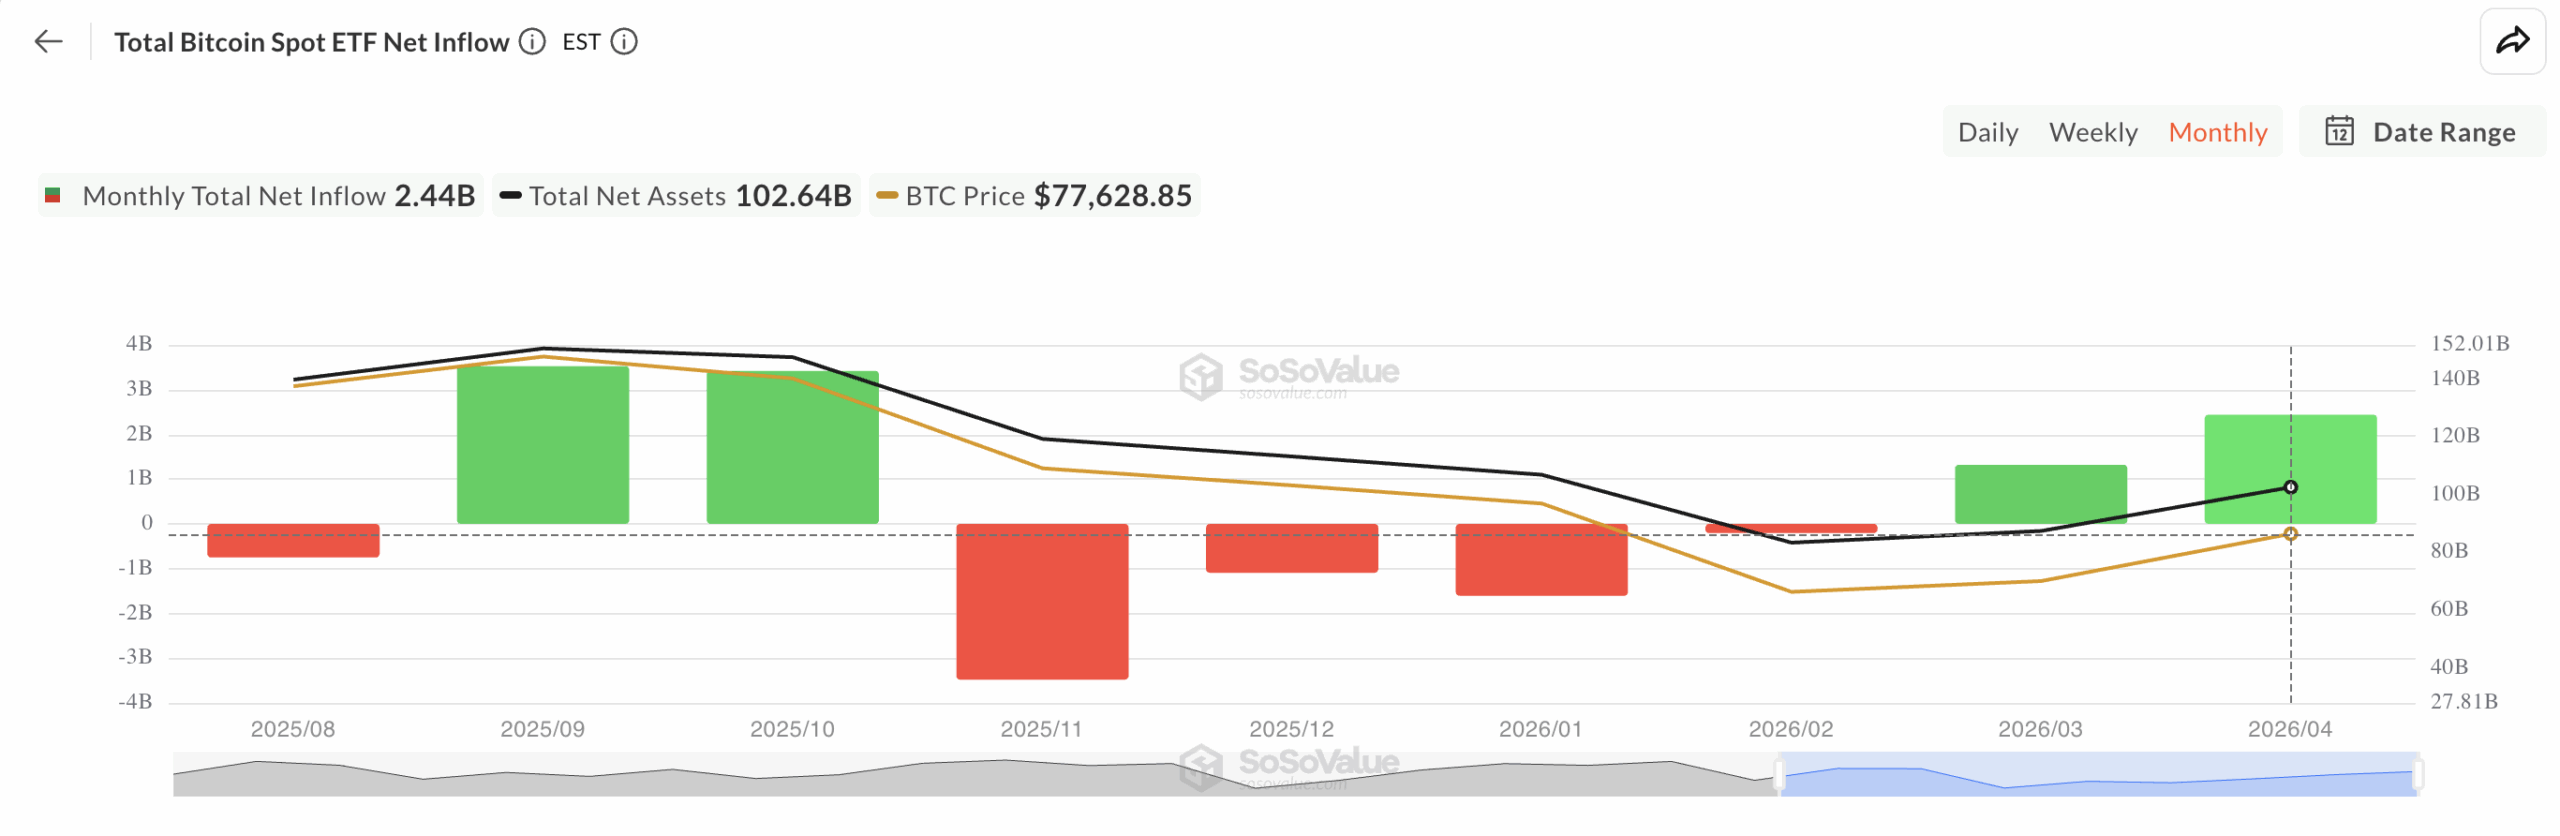
According to SoSoValue, April’s spot Bitcoin ETF inflows have topped $2.44 billion, making it the most successful month for US spot BTC ETFs so far in 2026.
Sponsored
Disclosure
We sometimes use affiliate links in our content, when clicking on those we might receive a commission at no extra cost to you. By using this website you agree to our terms and conditions and privacy policy.
Total Bitcoin Spot ETF Net Inflow | Credit: SosoValue
ETF inflows are widely used as a gauge of investor sentiment.
When netflows turn consistently positive, it signals that institutional exposure to the asset is expanding and that conviction among ETF holders is strengthening.
For BTC, four consecutive weeks of inflows tell a clear story: institutional money is flowing back in, and that sustained demand could help drive prices higher in the near term.
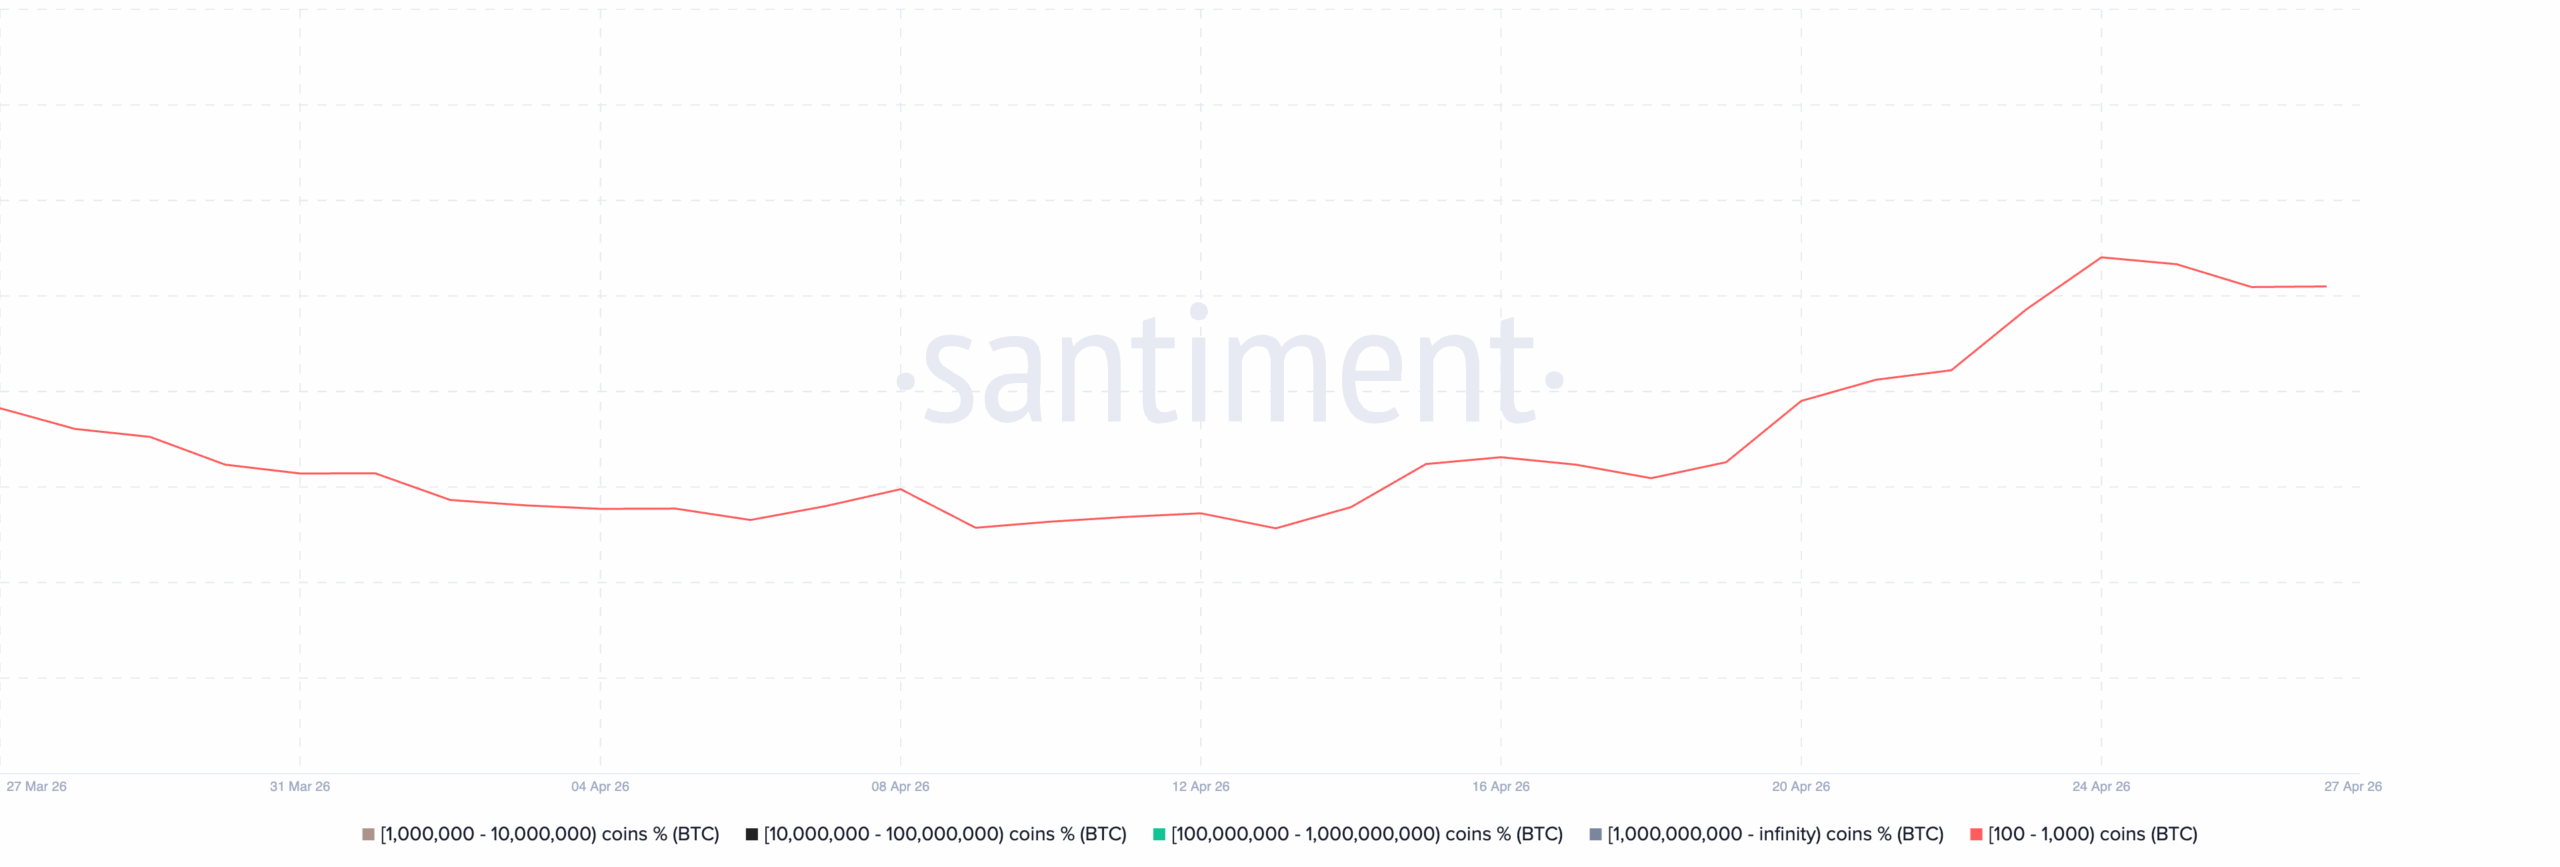
Also, BTC whales have steadily expanded their holdings as the price has rocketed over the past few weeks.
Per Santiment, wallets holding between 100 and 1,000 BTC have added roughly 40,000 coins to their supply over the past month, a position worth around $3.1 billion at current market prices.
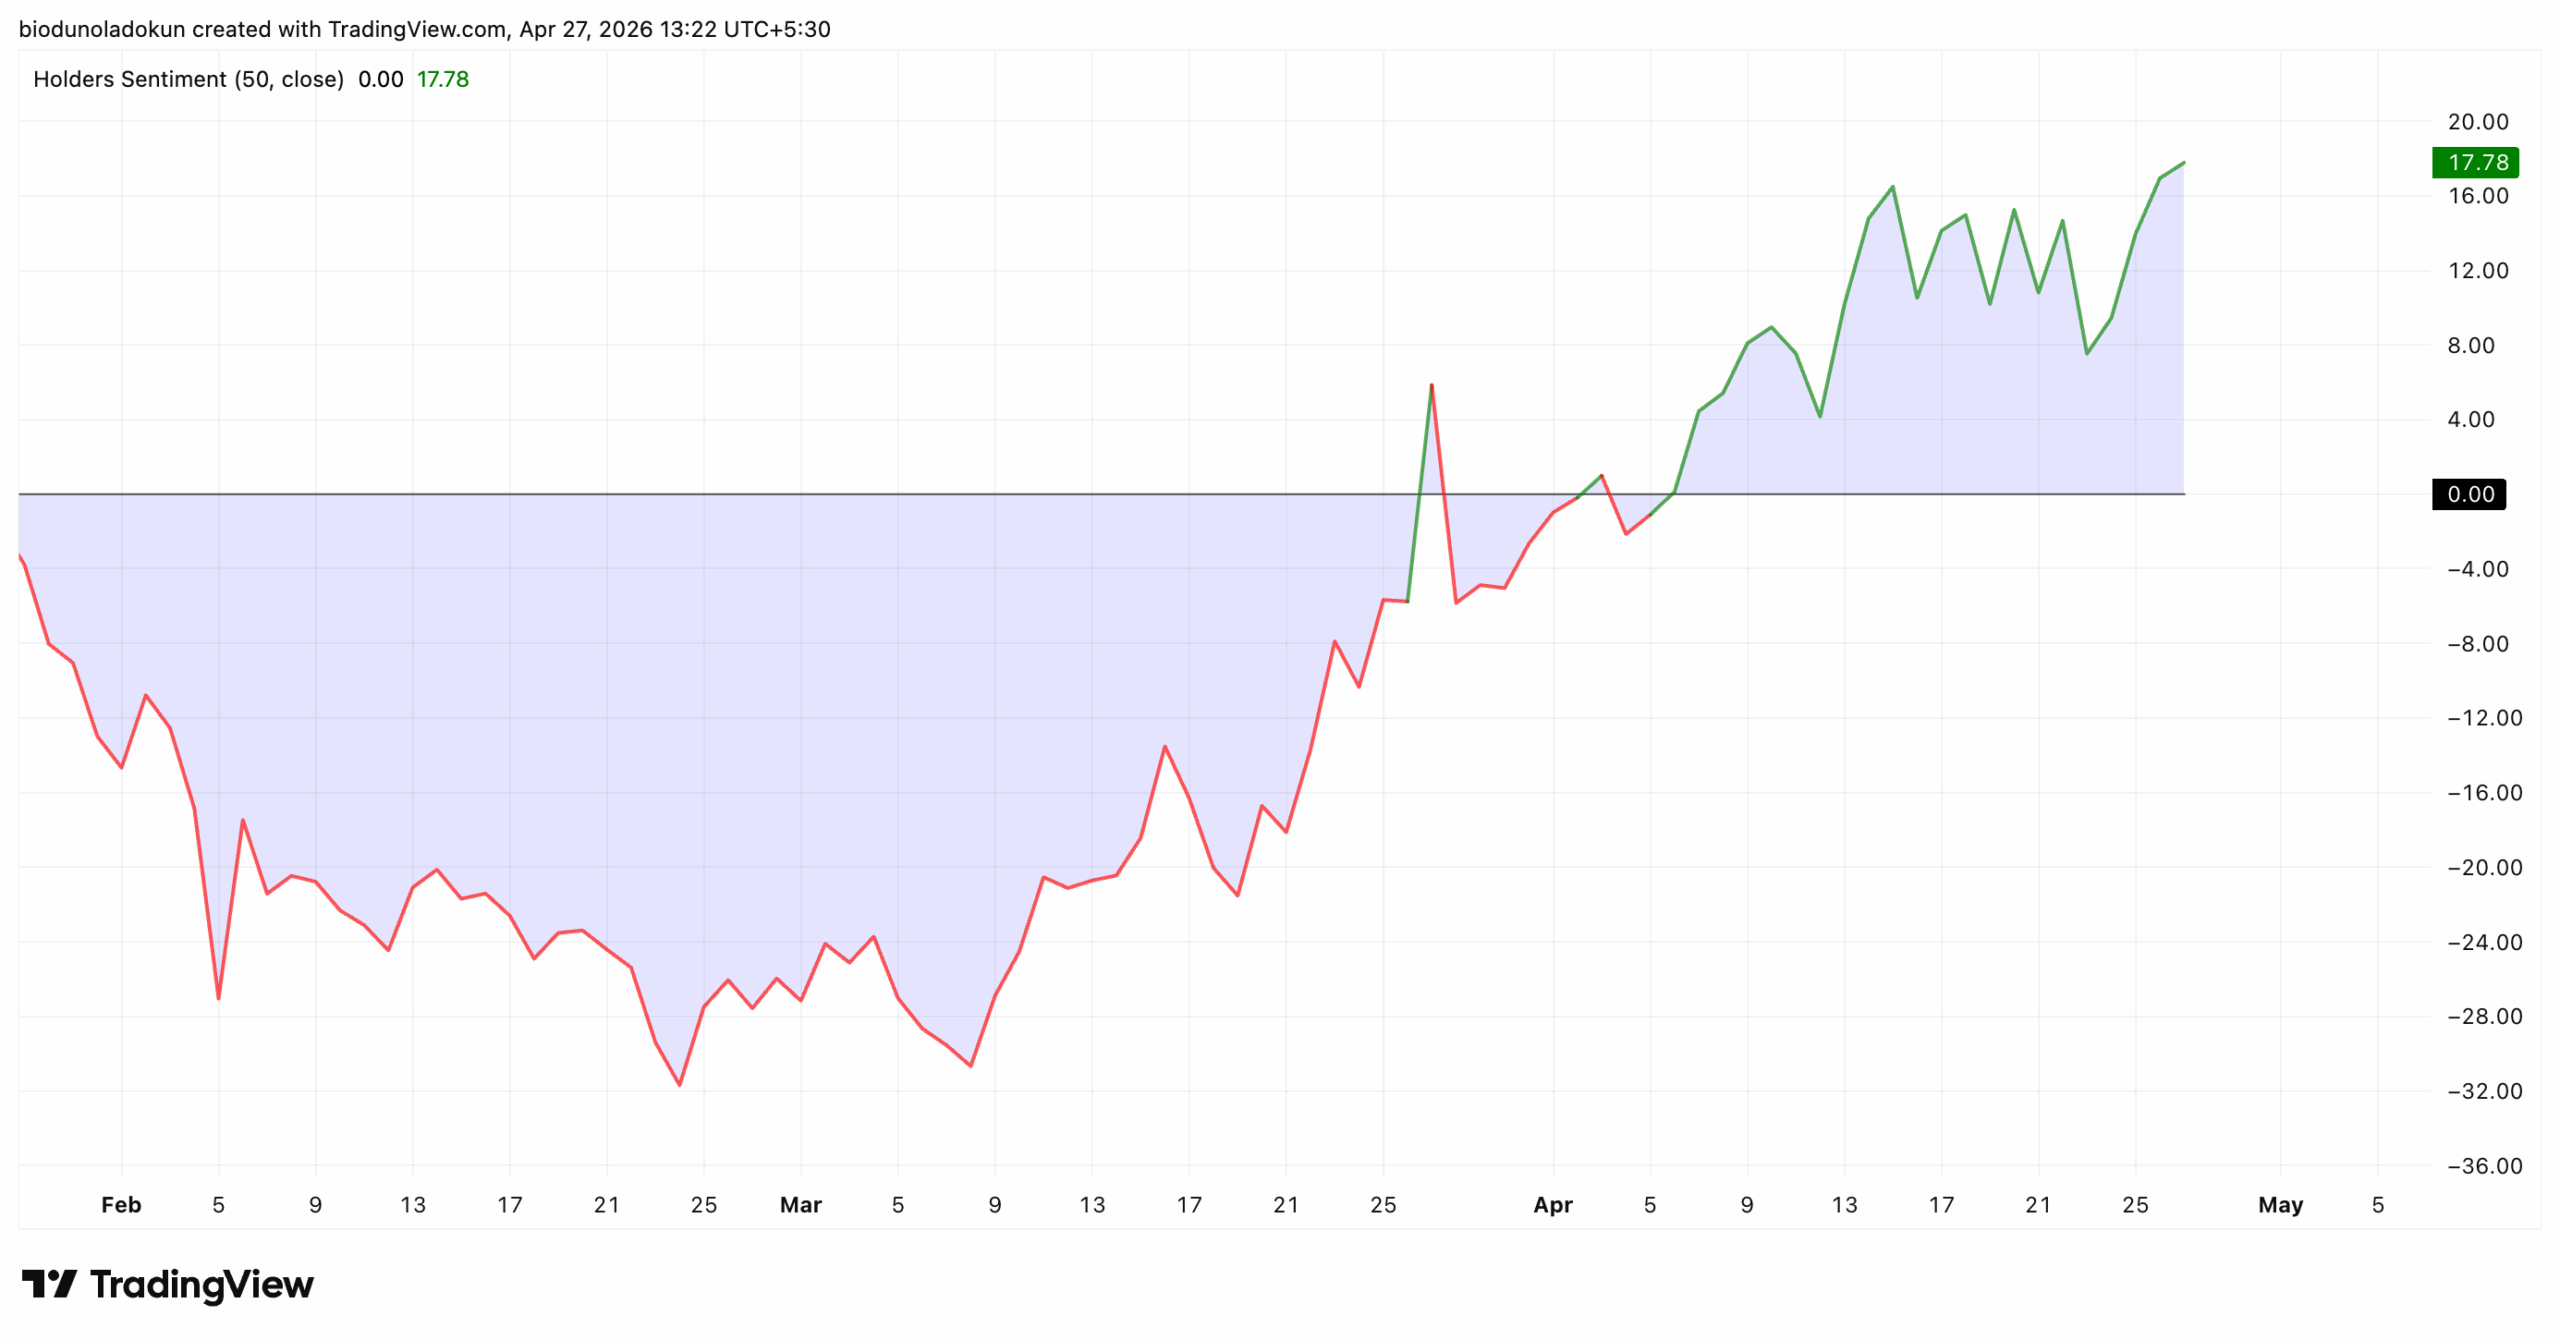
The Holder Sentiment indicator tracks how much an asset’s price has changed over time, offering a read on the mood of open positions and holders.
When it climbs like this, it signals that the average holder is feeling positive about the asset. This typically attracts further capital inflows from buyers chasing the trend.
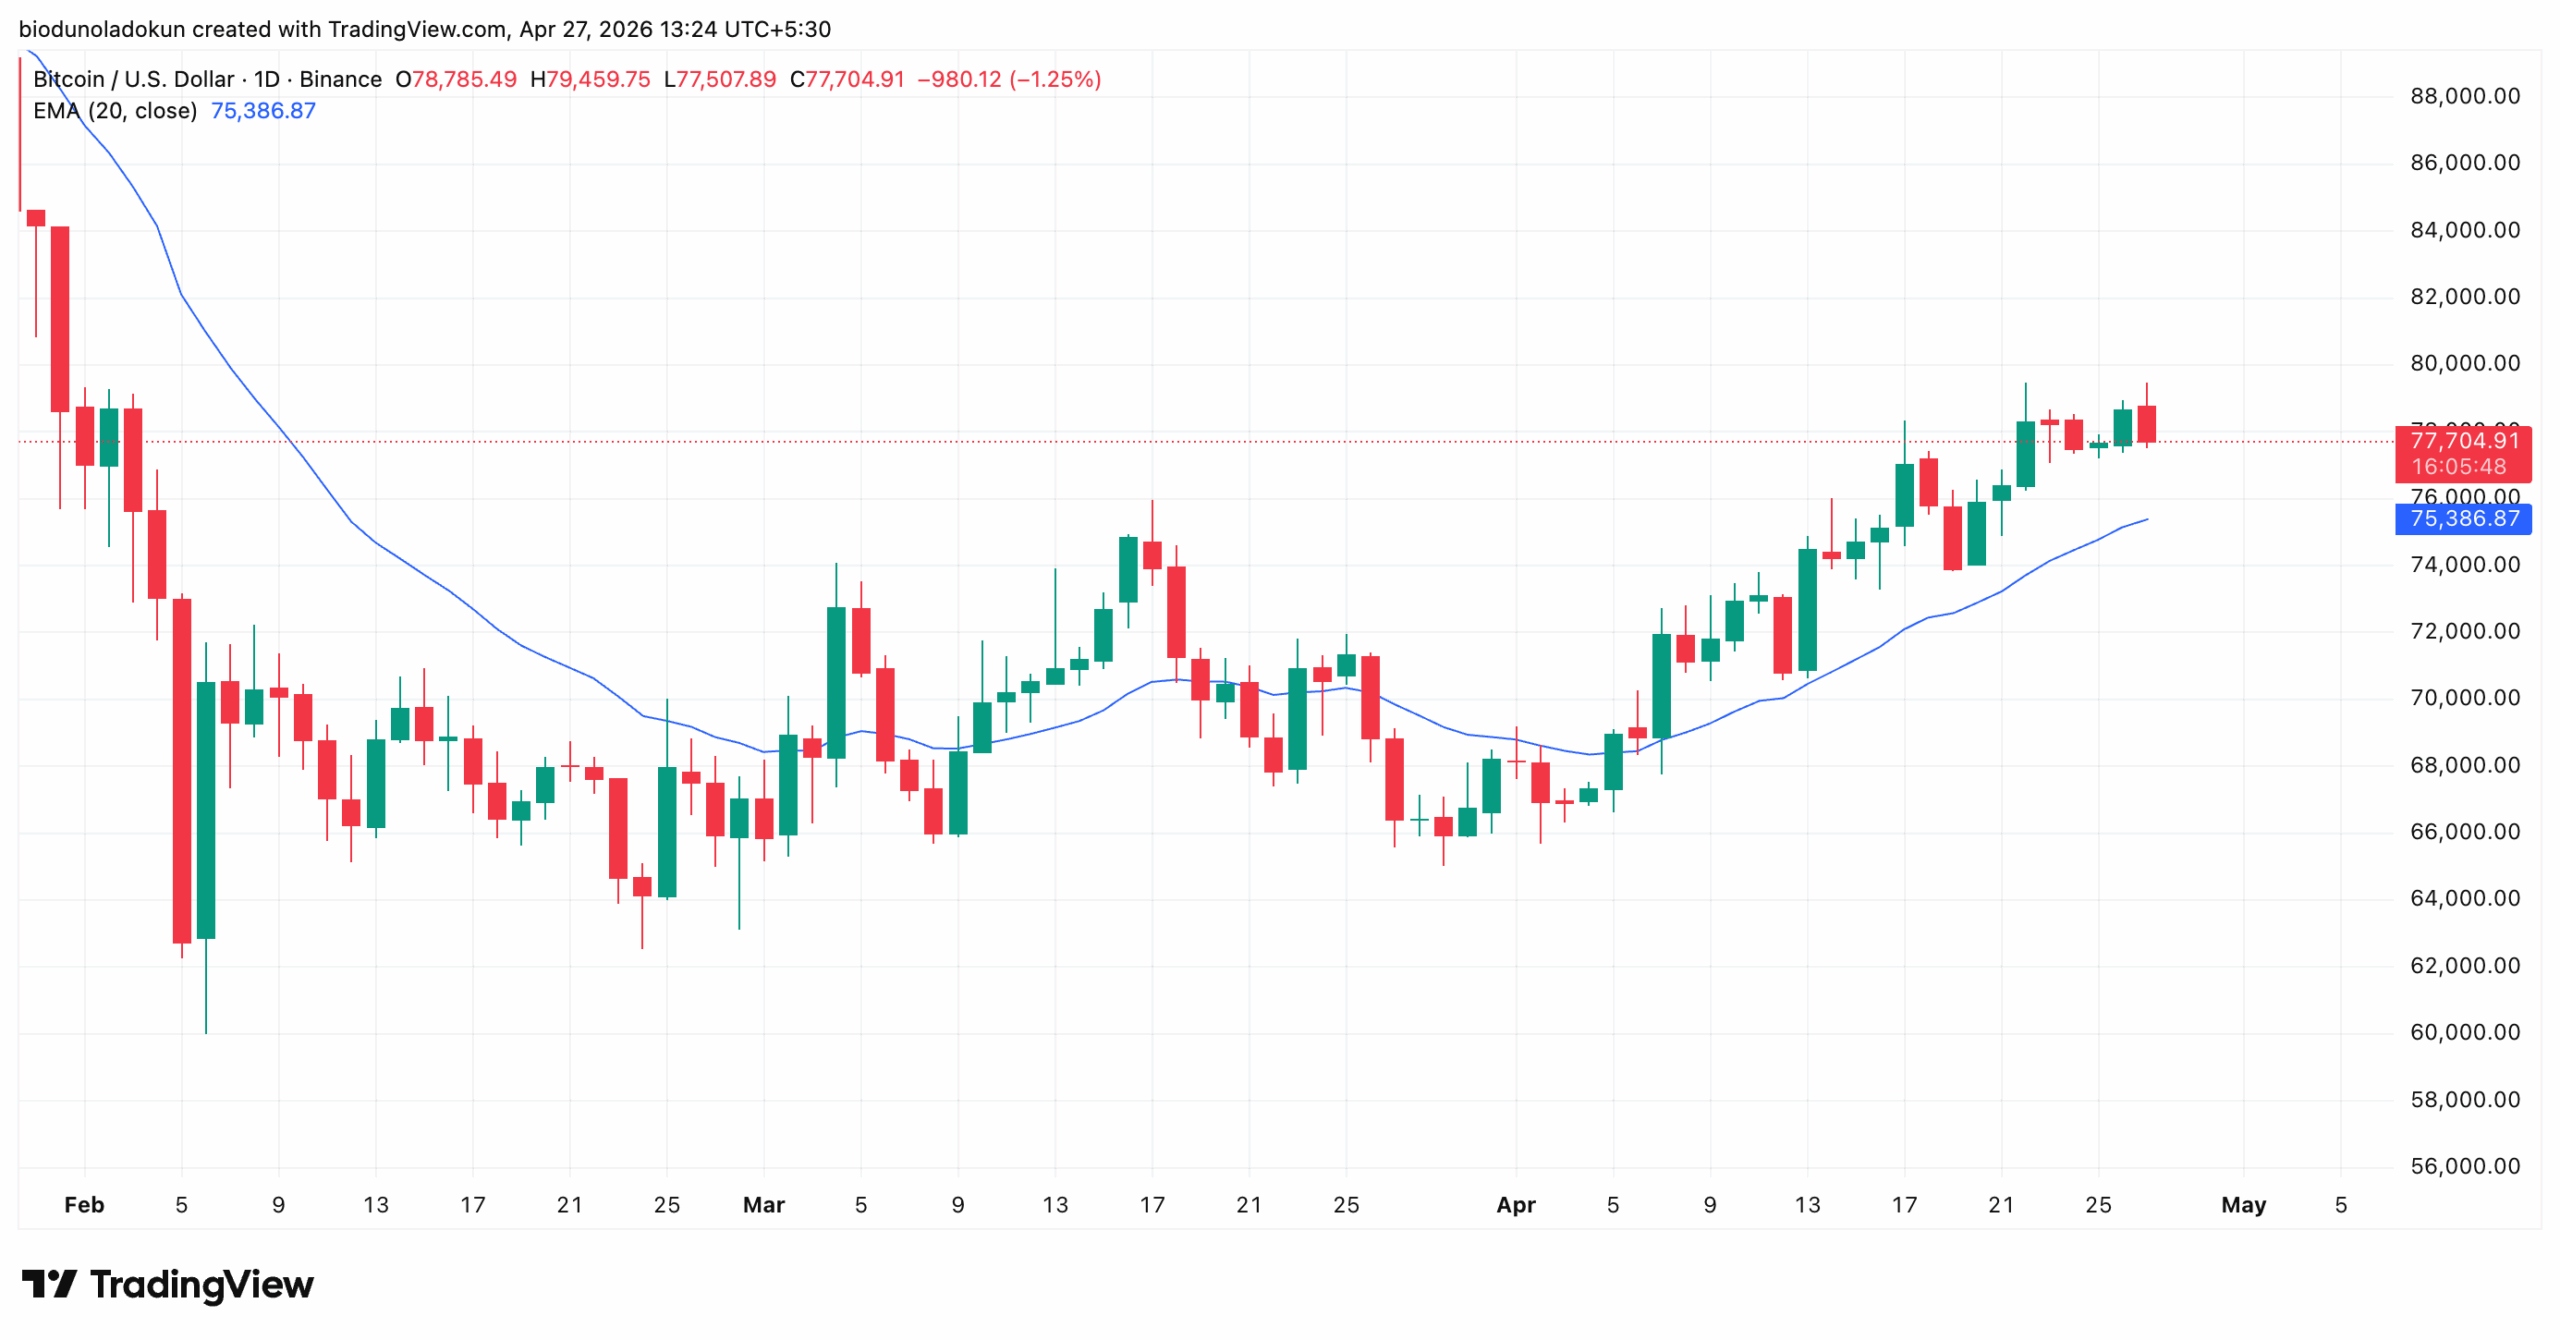
Moreover, BTC’s uptrend since April has pushed it above its 20-day exponential moving average.
As of this writing, this key moving average forms dynamic support below the coin’s price at $75,383, absorbing sell-side pressure.
The 20-day EMA tracks an asset’s average price over the past 20 trading days, giving more weight to recent prices.
When the price falls under it, it means short-term momentum has flipped bearish, and buyers have lost control of the immediate trend.
Conversely, price holding above the 20-day EMA — as BTC is doing now — confirms that short-term momentum remains with the bulls.
Last Wall Before Run Past $80,000
A sustained buy-side pressure could push BTC past its next major resistance at $79,500, marked by the 0.5 Fibonacci retracement level.
A close above this would clear the path to the psychological $80,000 level and drive a further rally.
In this case, a move to at $84,102 is likely, if overhead supply at that zone fails to hold.
On the other hand, a rejection at $79,500 could see BTC slip back into consolidation, with $74,898 and the 20-day EMA at $75,378 forming the first line of defense.
Disclaimer:
The information provided in this article is for informational purposes only. It is not intended to be, nor should it be construed as, financial advice. We do not make any warranties regarding the completeness, reliability, or accuracy of this information. All investments involve risk, and past performance does not guarantee future results. We recommend consulting a financial advisor before making any investment decisions.
Abiodun Oladokun is a Research Analyst at CCN, where he covers cryptocurrency markets with a focus on on-chain analysis, technical assessments, and emerging trends across decentralized finance (DeFi), real-world assets (RWA), artificial intelligence (AI), decentralized physical infrastructure networks (DePIN), Layer 2s, and meme coins.
Prior to CCN, he served as a Senior On-Chain Analyst at BeInCrypto, producing market reports spanning diverse crypto sectors.
Before that, he conducted technical analysis and market assessments of various altcoins at AMBCrypto, where he also contributed long-form quarterly research papers on DeFi, NFTs, DAOs, and scaling architectures, leveraging on-chain platforms including Messari, Santiment, DefiLlama, and Dune Analytics.
He began his crypto career as a research analyst at SixthSense DAO, developing blockchain forensic tools to trace the history of stolen assets.
Abiodun is a lawyer called to the Nigerian Bar and the founder of Ilé Ijó, a Lagos-based electronic dance music collective.