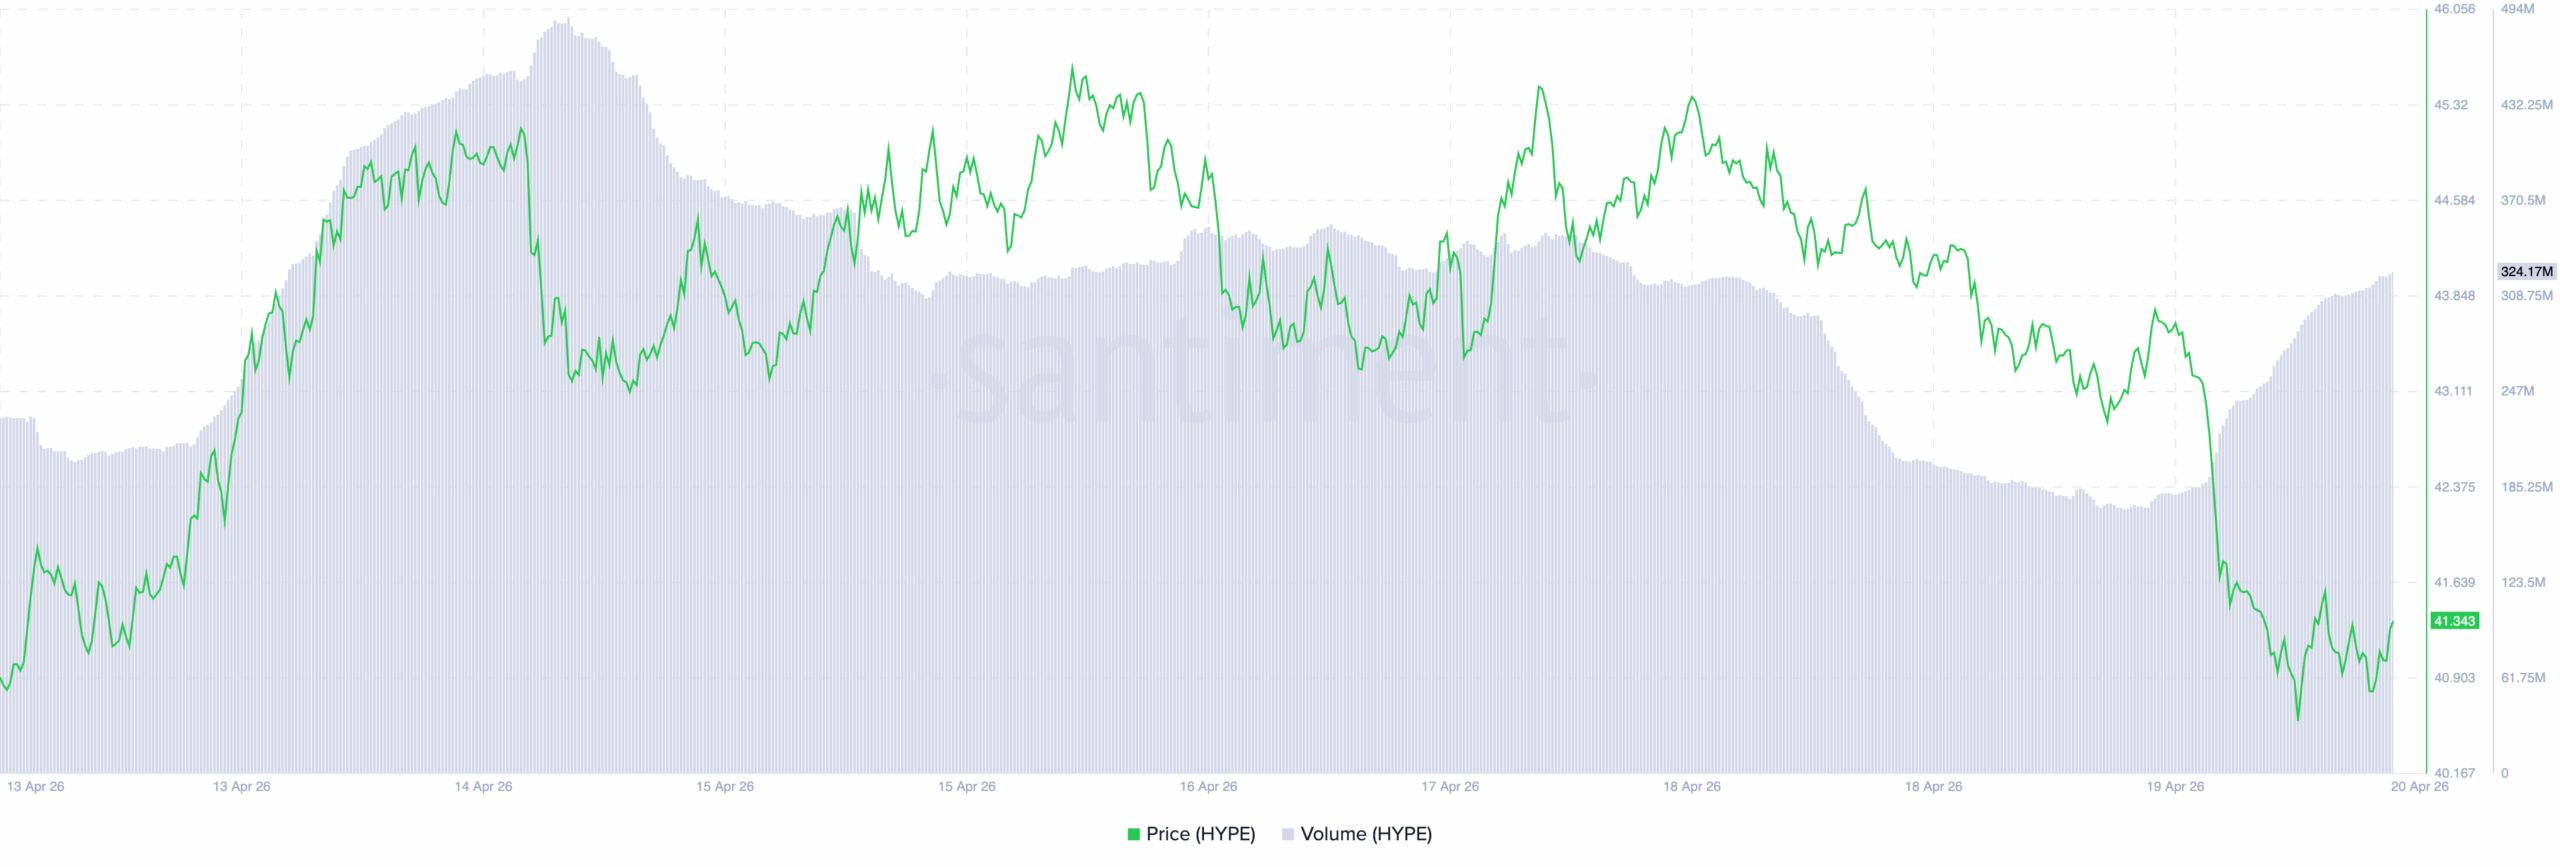
HYPE has fallen 13% across two sessions, with a 75% volume surge pointing to active distribution rather than a healthy correction.
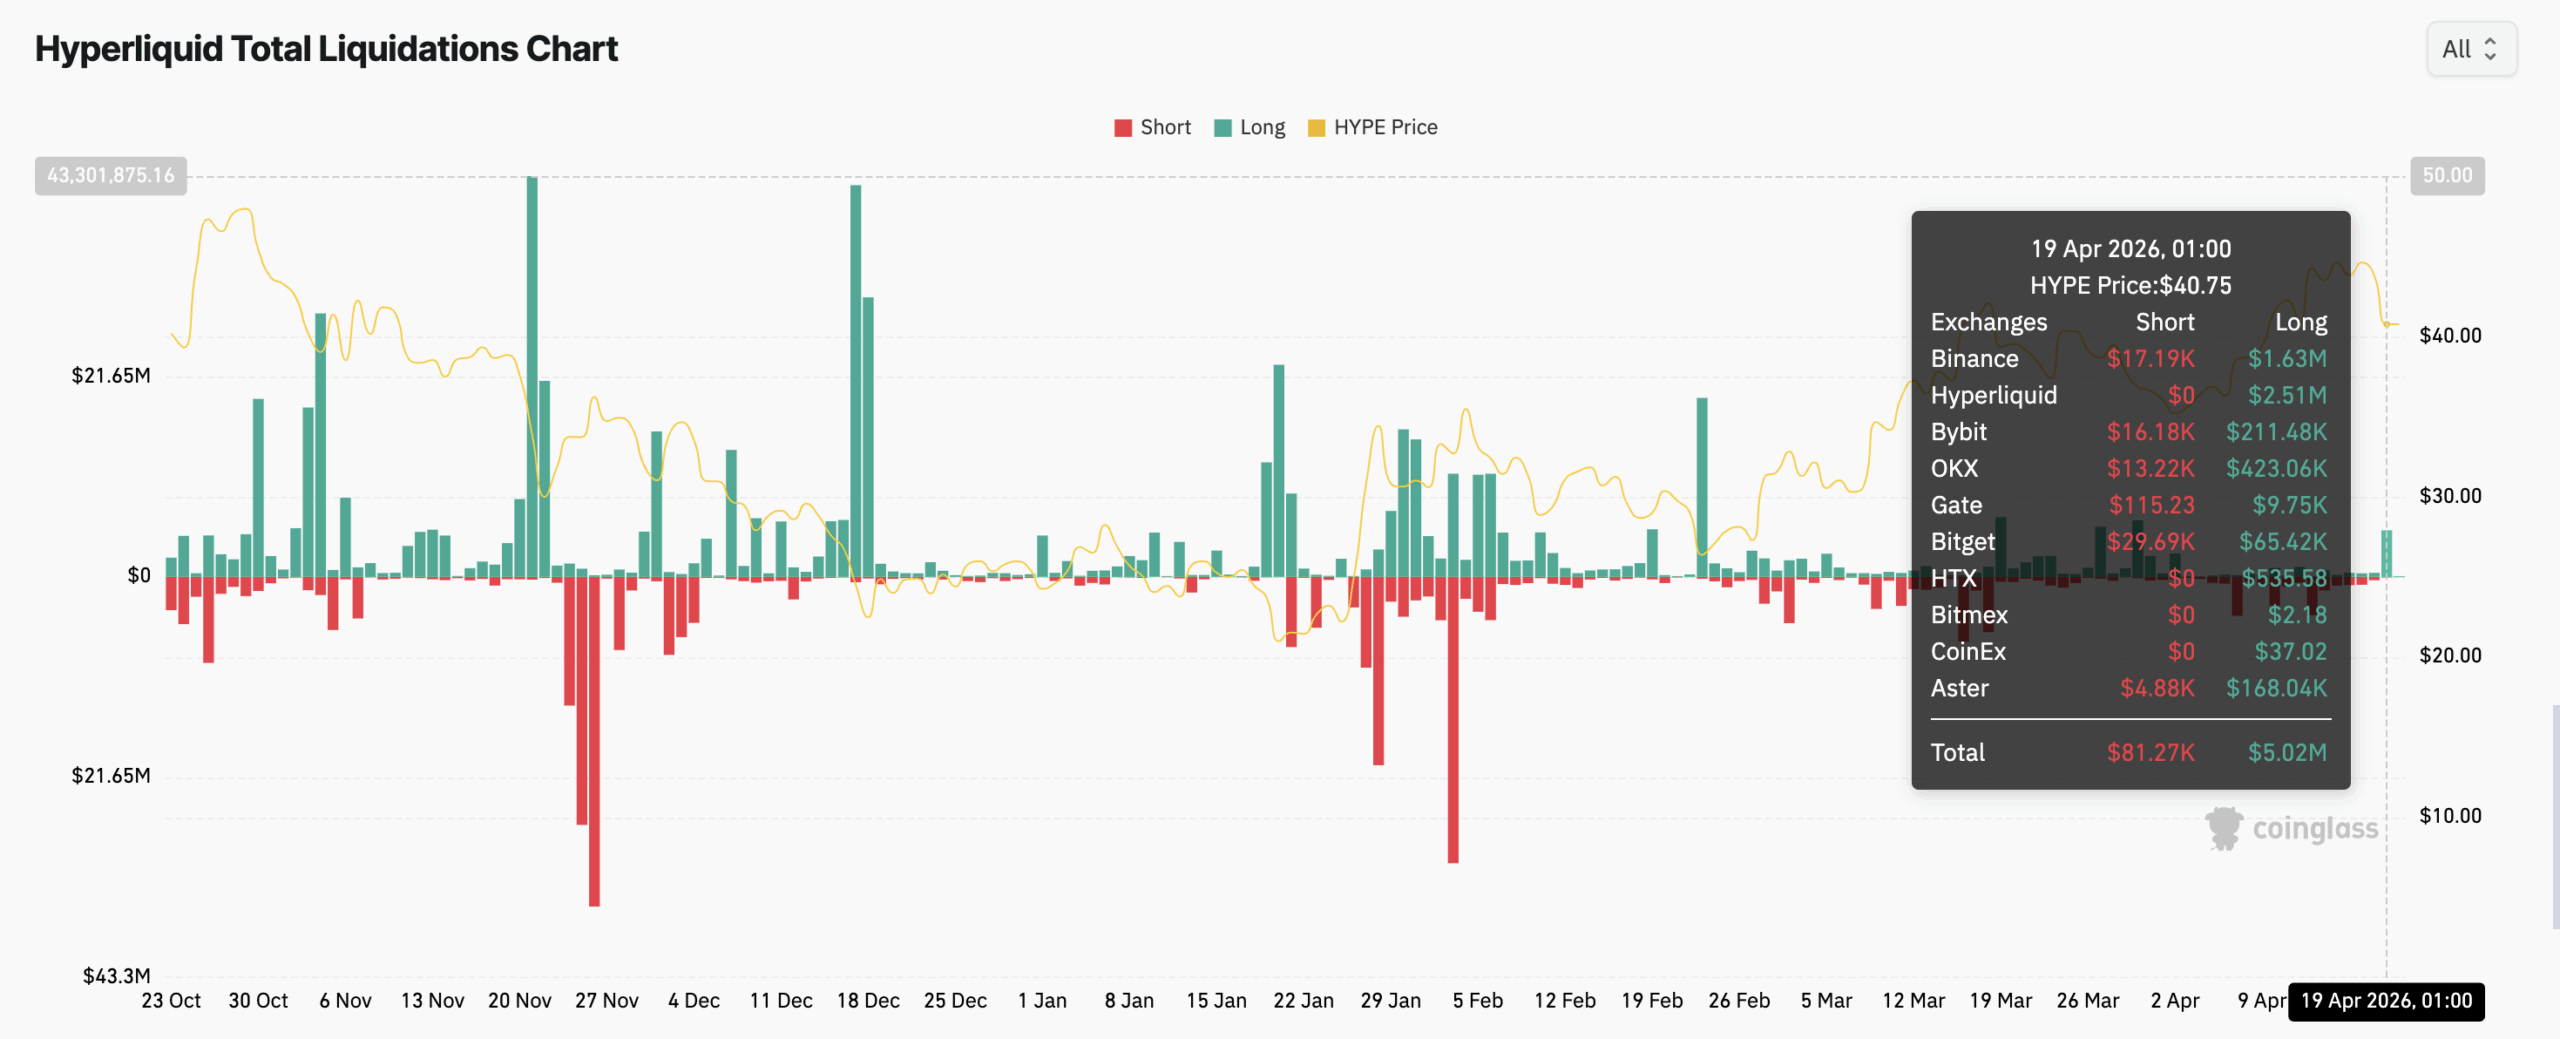
Long liquidations reached $5.02 million on April 19 as overleveraged bulls betting on a $45 breakout were wiped out.
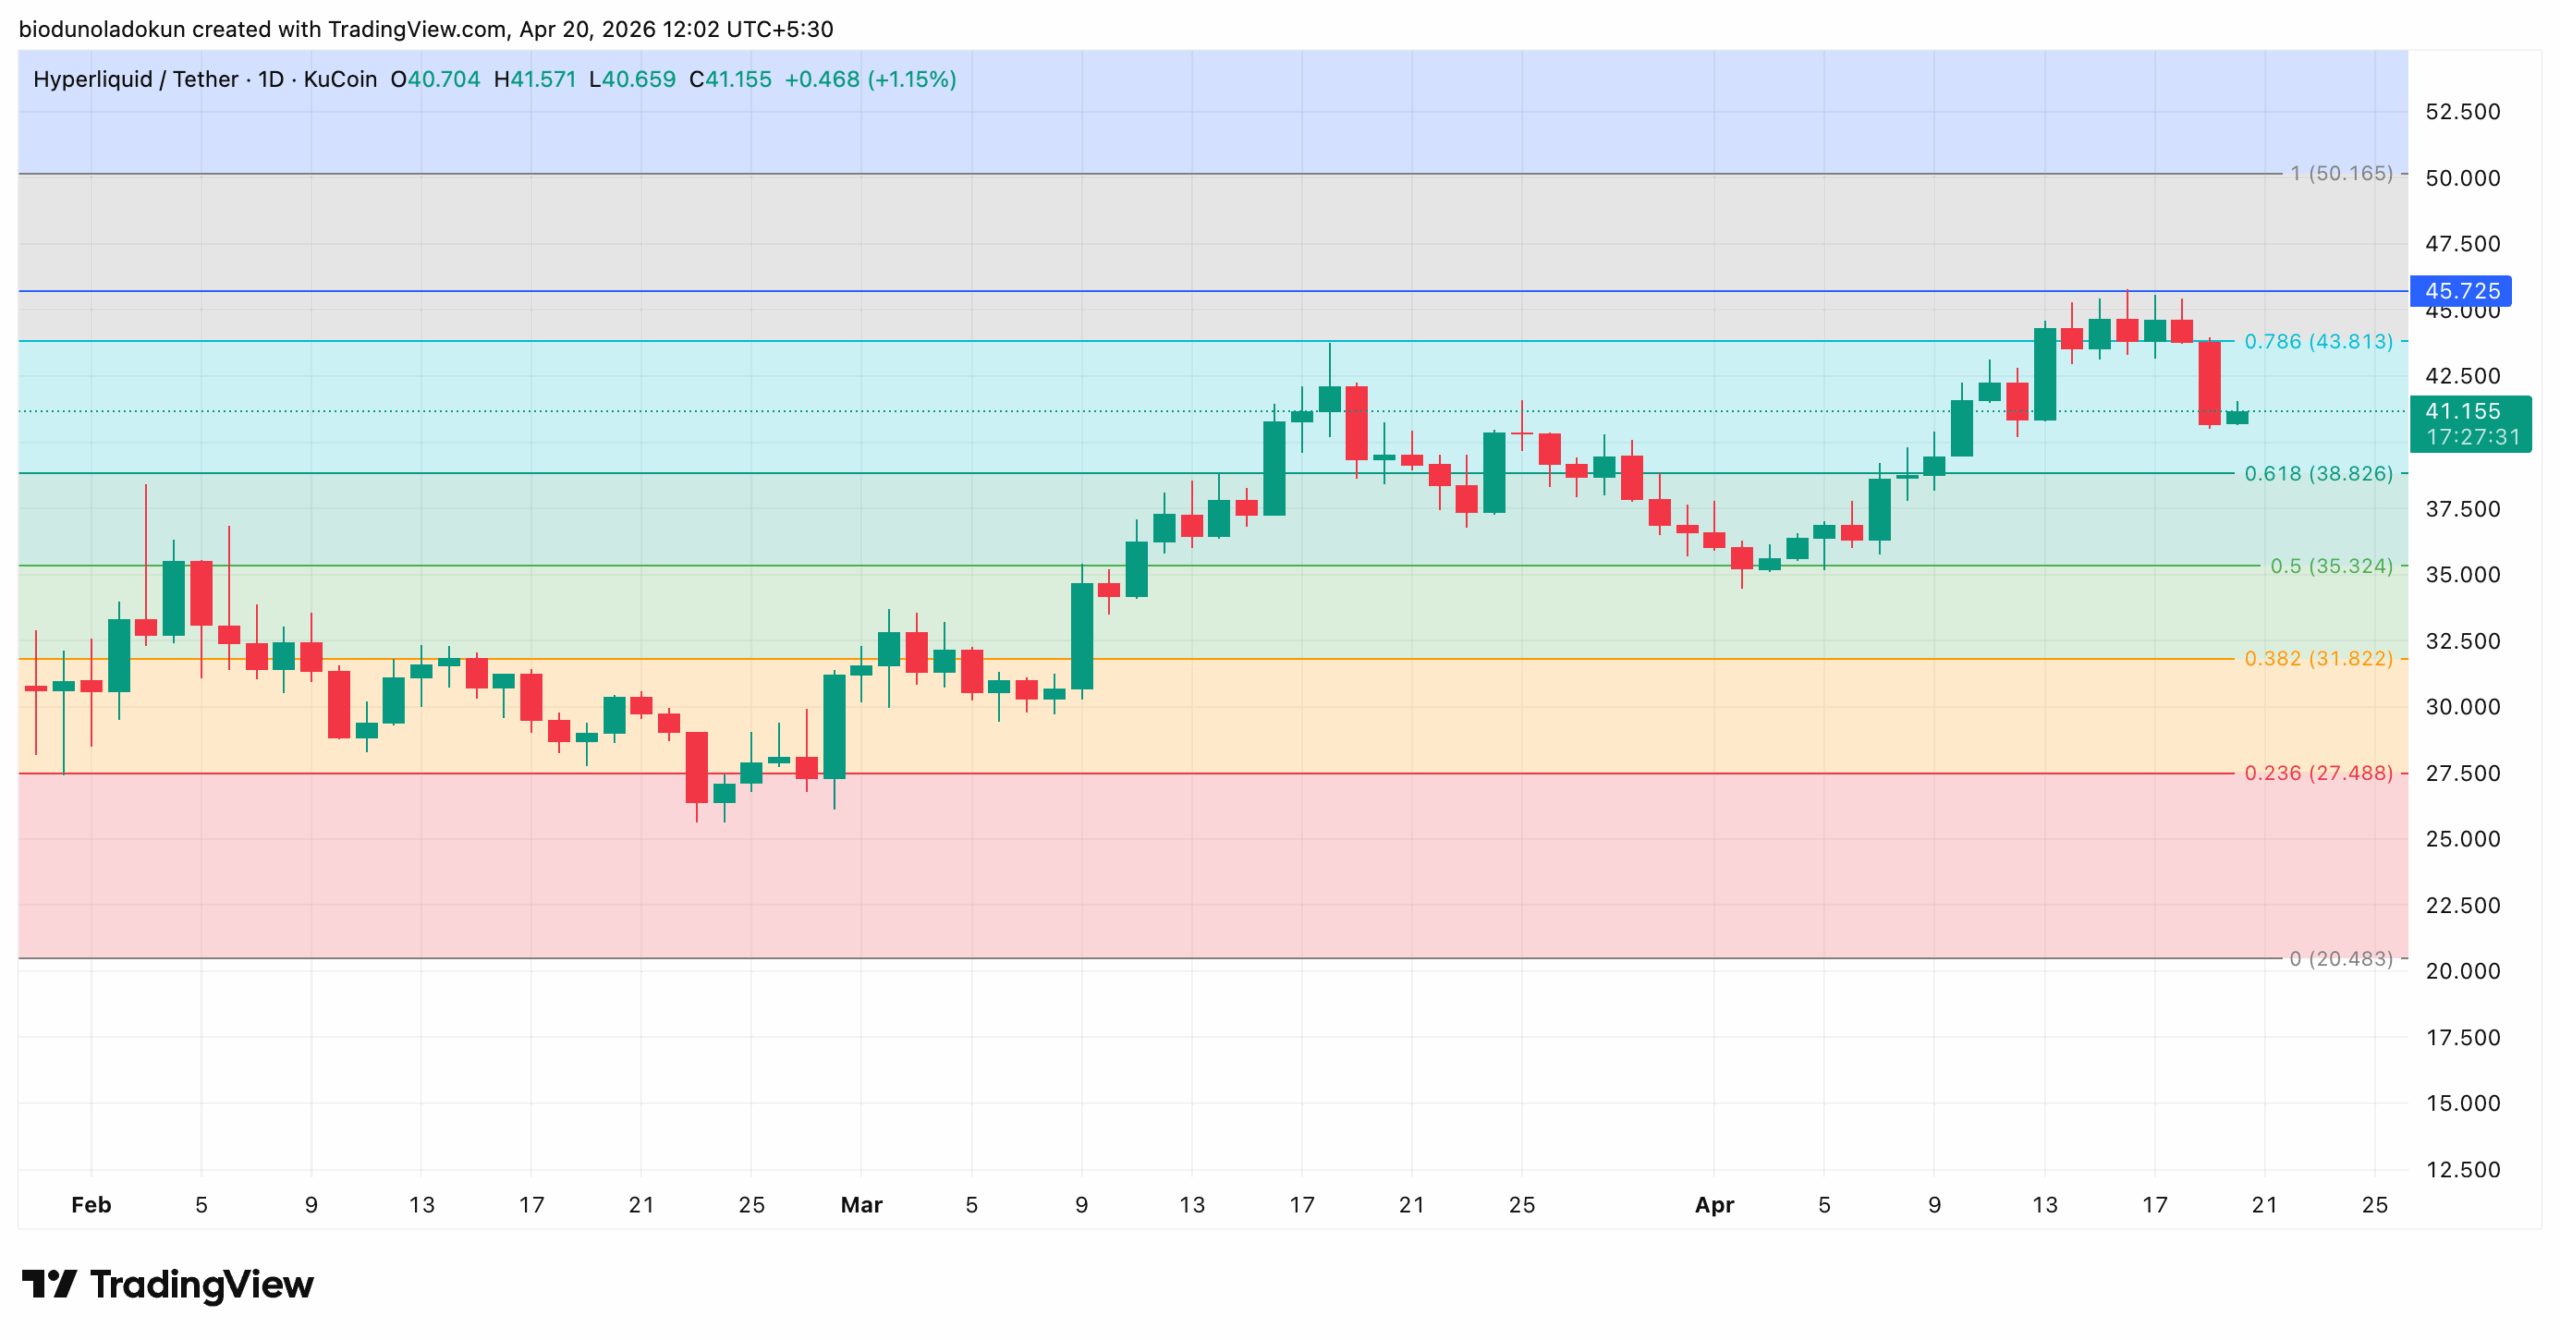
A daily close below $38.82 could accelerate losses toward $35.32, while bulls need to reclaim $45.72 convincingly to shift the market structure.
After a week of sideways price action that failed to produce a break above the $45 level, Hyperliquid’s native token HYPE appears to be entering a new phase of decline.
The altcoin dropped 7% yesterday, closing near $40. The sell-off has extended into today’s session, with HYPE down an additional 6% over the past 24 hours.
It currently trades near its Sunday’s close at $40.81, a sign that buyers are struggling to contribute any meaningful recovery.
The Derivatives Market Is Flashing Red
According to Coinglass, yesterday’s leg down triggered a spike in long liquidations among HYPE futures traders. It pushed the single-day long liquidation volume to $5.02 million, its highest level since April began.
Hyperliquid Total Liquidations | Credit: Coinglass
Long liquidations occur when traders who have opened leveraged long positions (bets that an asset’s price will rise) are forced to close out their positions by an exchange because their margin balance has fallen below the required threshold.
Sponsored
Disclosure
We sometimes use affiliate links in our content, when clicking on those we might receive a commission at no extra cost to you. By using this website you agree to our terms and conditions and privacy policy.
For HYPE, the $5.02 million long liquidations suggest a meaningful cohort of traders had been betting on a breakout above the $45 resistance level.
When that breakout failed, and HYPE’s price trended downward instead, those positions were wiped out, contributing to yesterday’s 7% drop.
HYPE Sentiment Flips Bearish
Currently trading at $40.81, HYPE is down 6% over the past 24 hours. Trading volume has surged by 75% over the same period, a dynamic typically described as bearish. At press time, it stands at $324.17 million.
When an asset’s price falls amid rising volume, it creates a negative divergence, suggesting traders are aggressively offloading positions rather than stepping in to absorb supply.
This may push HYPE prices lower in the near term.
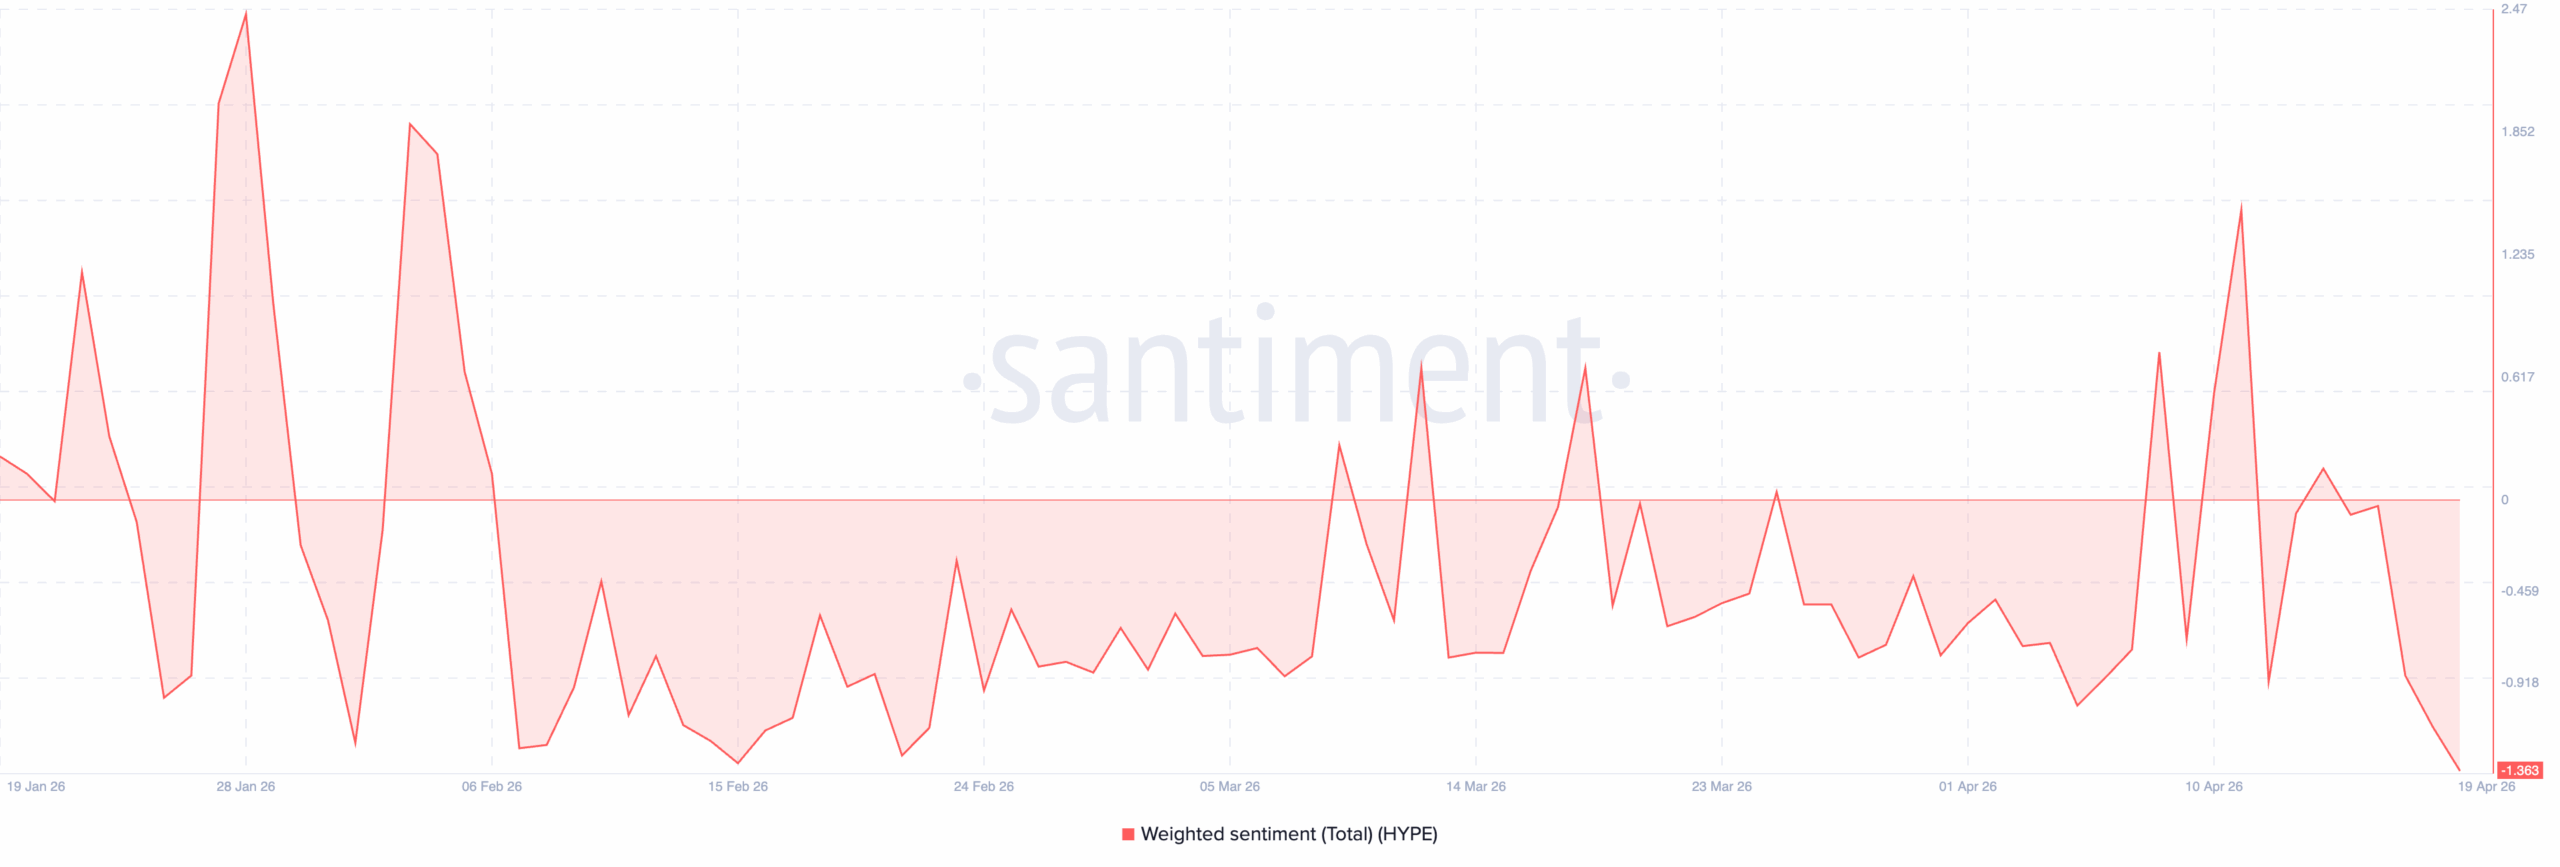
Further, HYPE’s weighted sentiment continues to plummet, signaling an uptick in bearish bias against the altcoin. Per Santiment, this metric, which tracks the market’s overall mood toward an asset, fell to -1.363 yesterday, its lowest reading in over three months.
When an asset’s weighted sentiment is negative, most social media discussions about it are fueled by negative emotions, which often prevent them from trading less.
If fear persists among HYPE holders, it may lead to continued price weakness for the altcoin.
HYPE Technical Indicators Flash Warning Signs
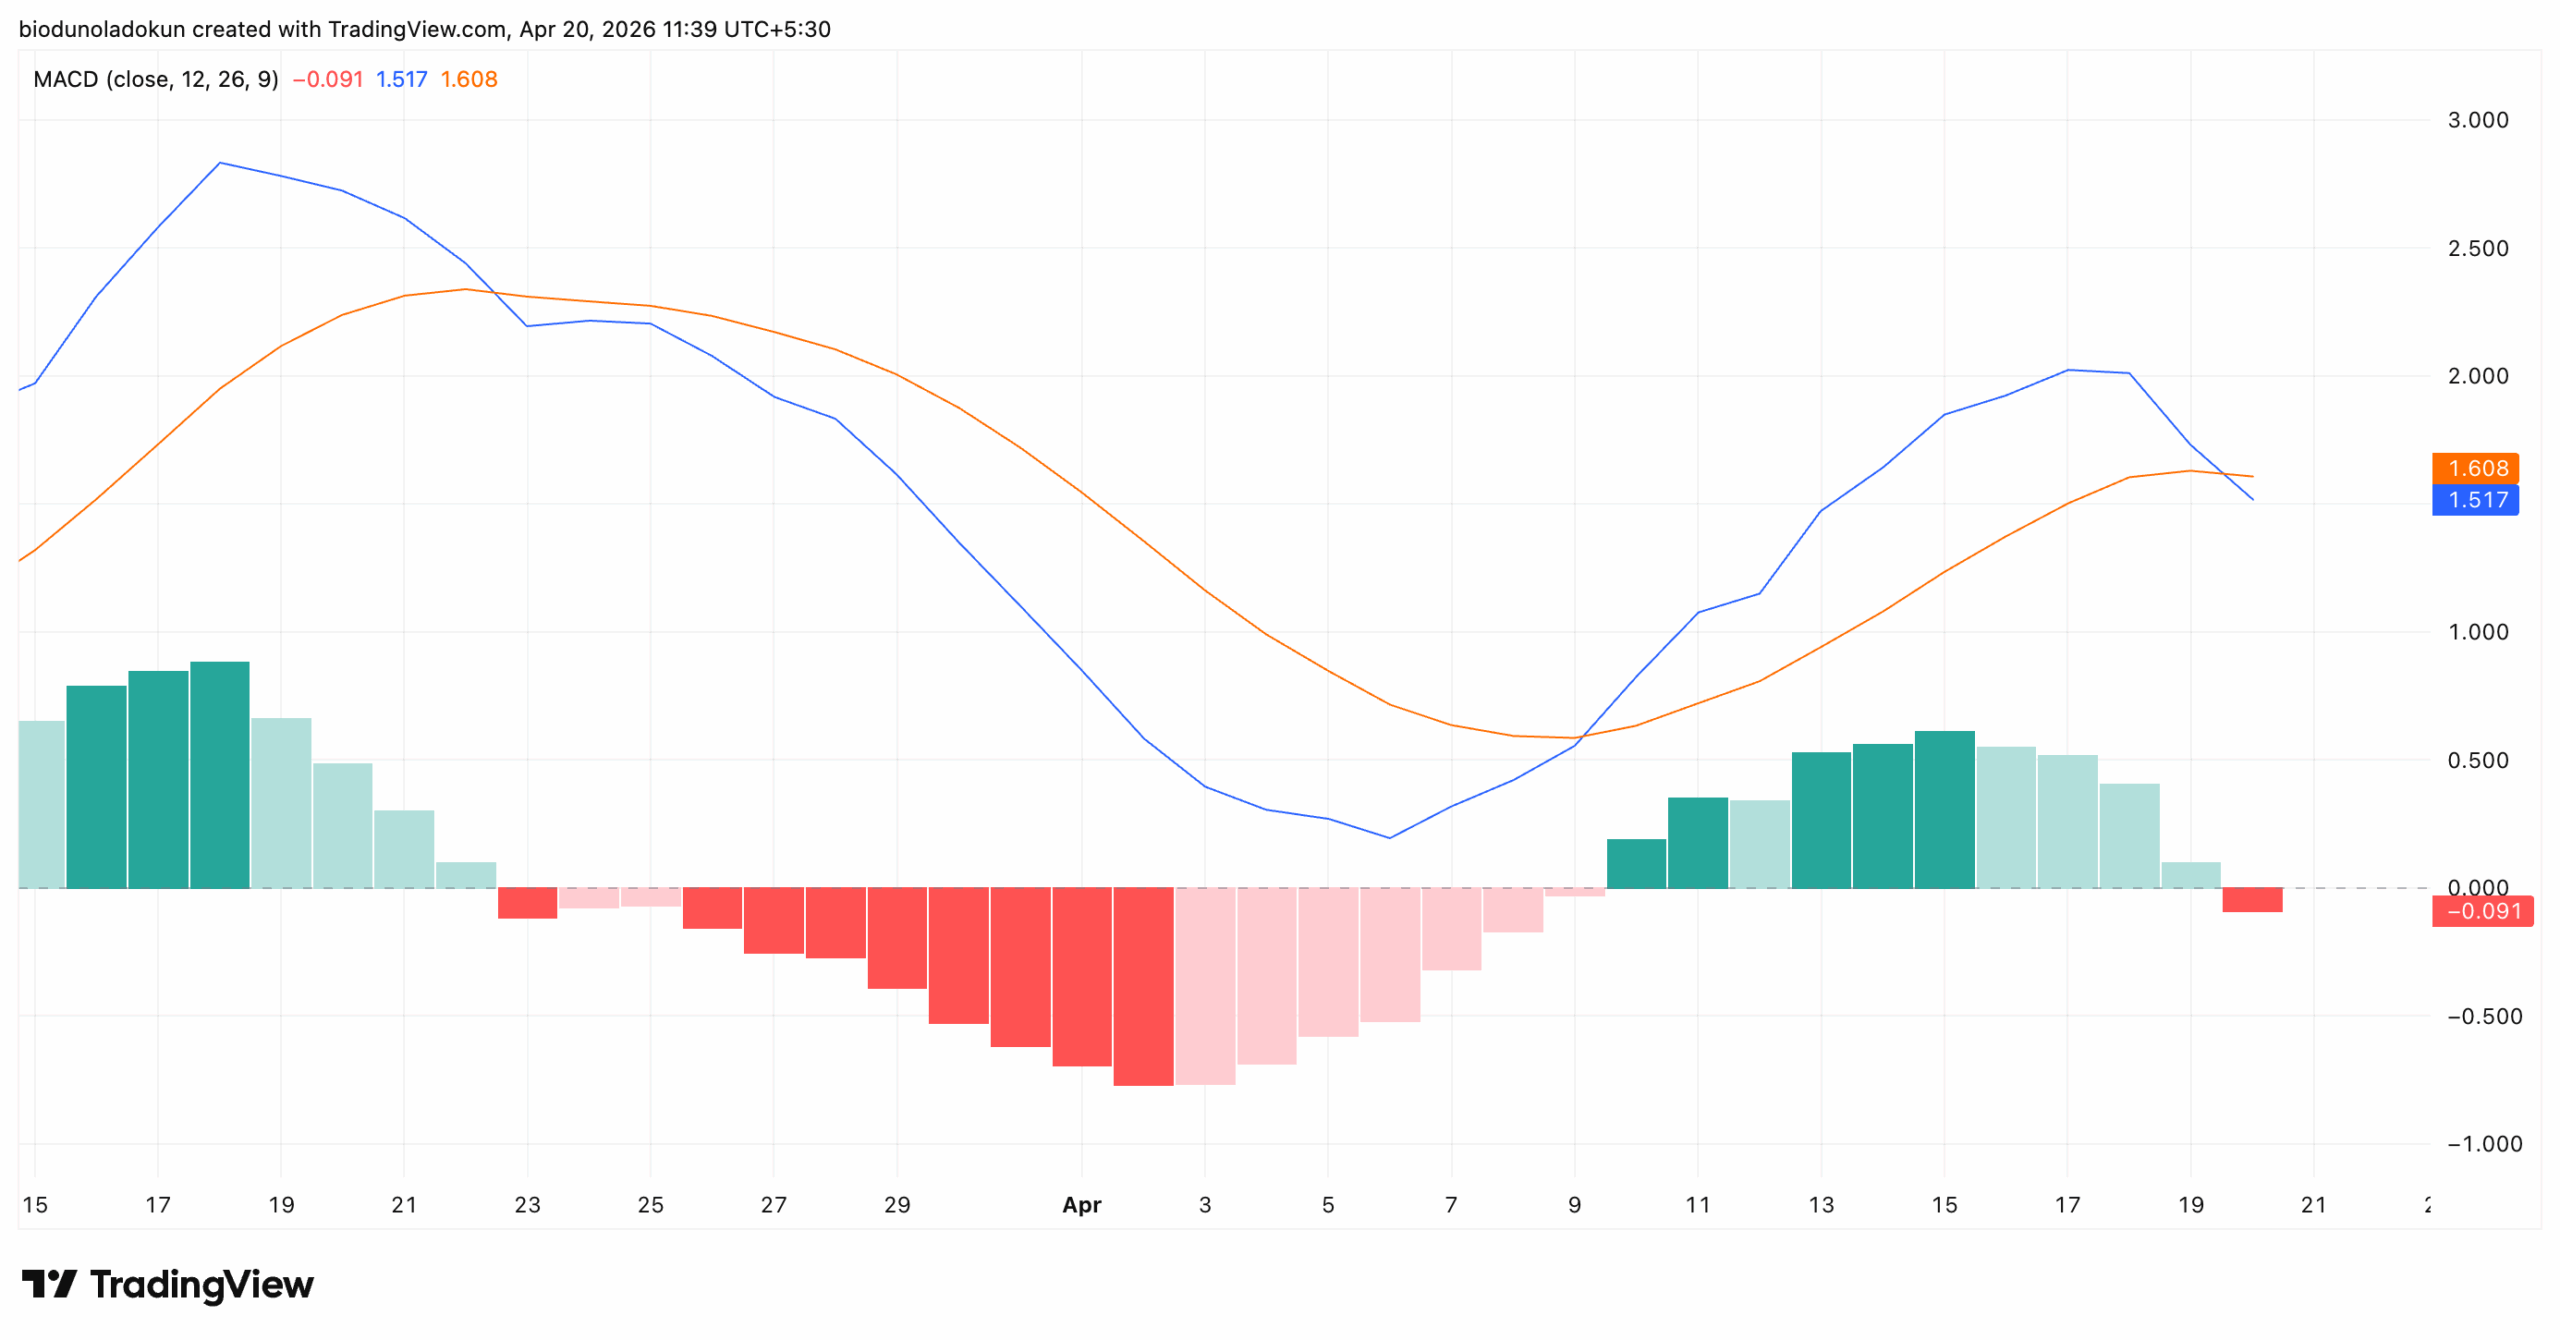
Readings from the HYPE/USD one-day chart indicate the token’s Moving Average Convergence Divergence (MACD) has formed a bearish crossover, suggesting deeper losses in the near term.
The MACD indicator identifies trends and momentum in an asset’s price movement, helping traders spot potential buy or sell signals through crossovers between the MACD and signal lines.
A bearish crossover occurs when the MACD line (blue) dips below the signal line (orange), indicating a weakening in bullish momentum and a possible shift toward downward price pressure.
At press time, HYPE’s MACD line sits at 1.517, having slipped below the signal line at 1.608.
Also, the indicator is printing its first red histogram bar in 11 days, ending a run of green bars that had built up since April 10 as HYPE attempted a recovery from the late-March lows.
This is significant because the 11-day green histogram stretch coincided almost exactly with HYPE’s push toward the $45 resistance zone.
Therefore, the return to red suggests the energy behind that rally has been exhausted, and that $45 may now serve as a ceiling.
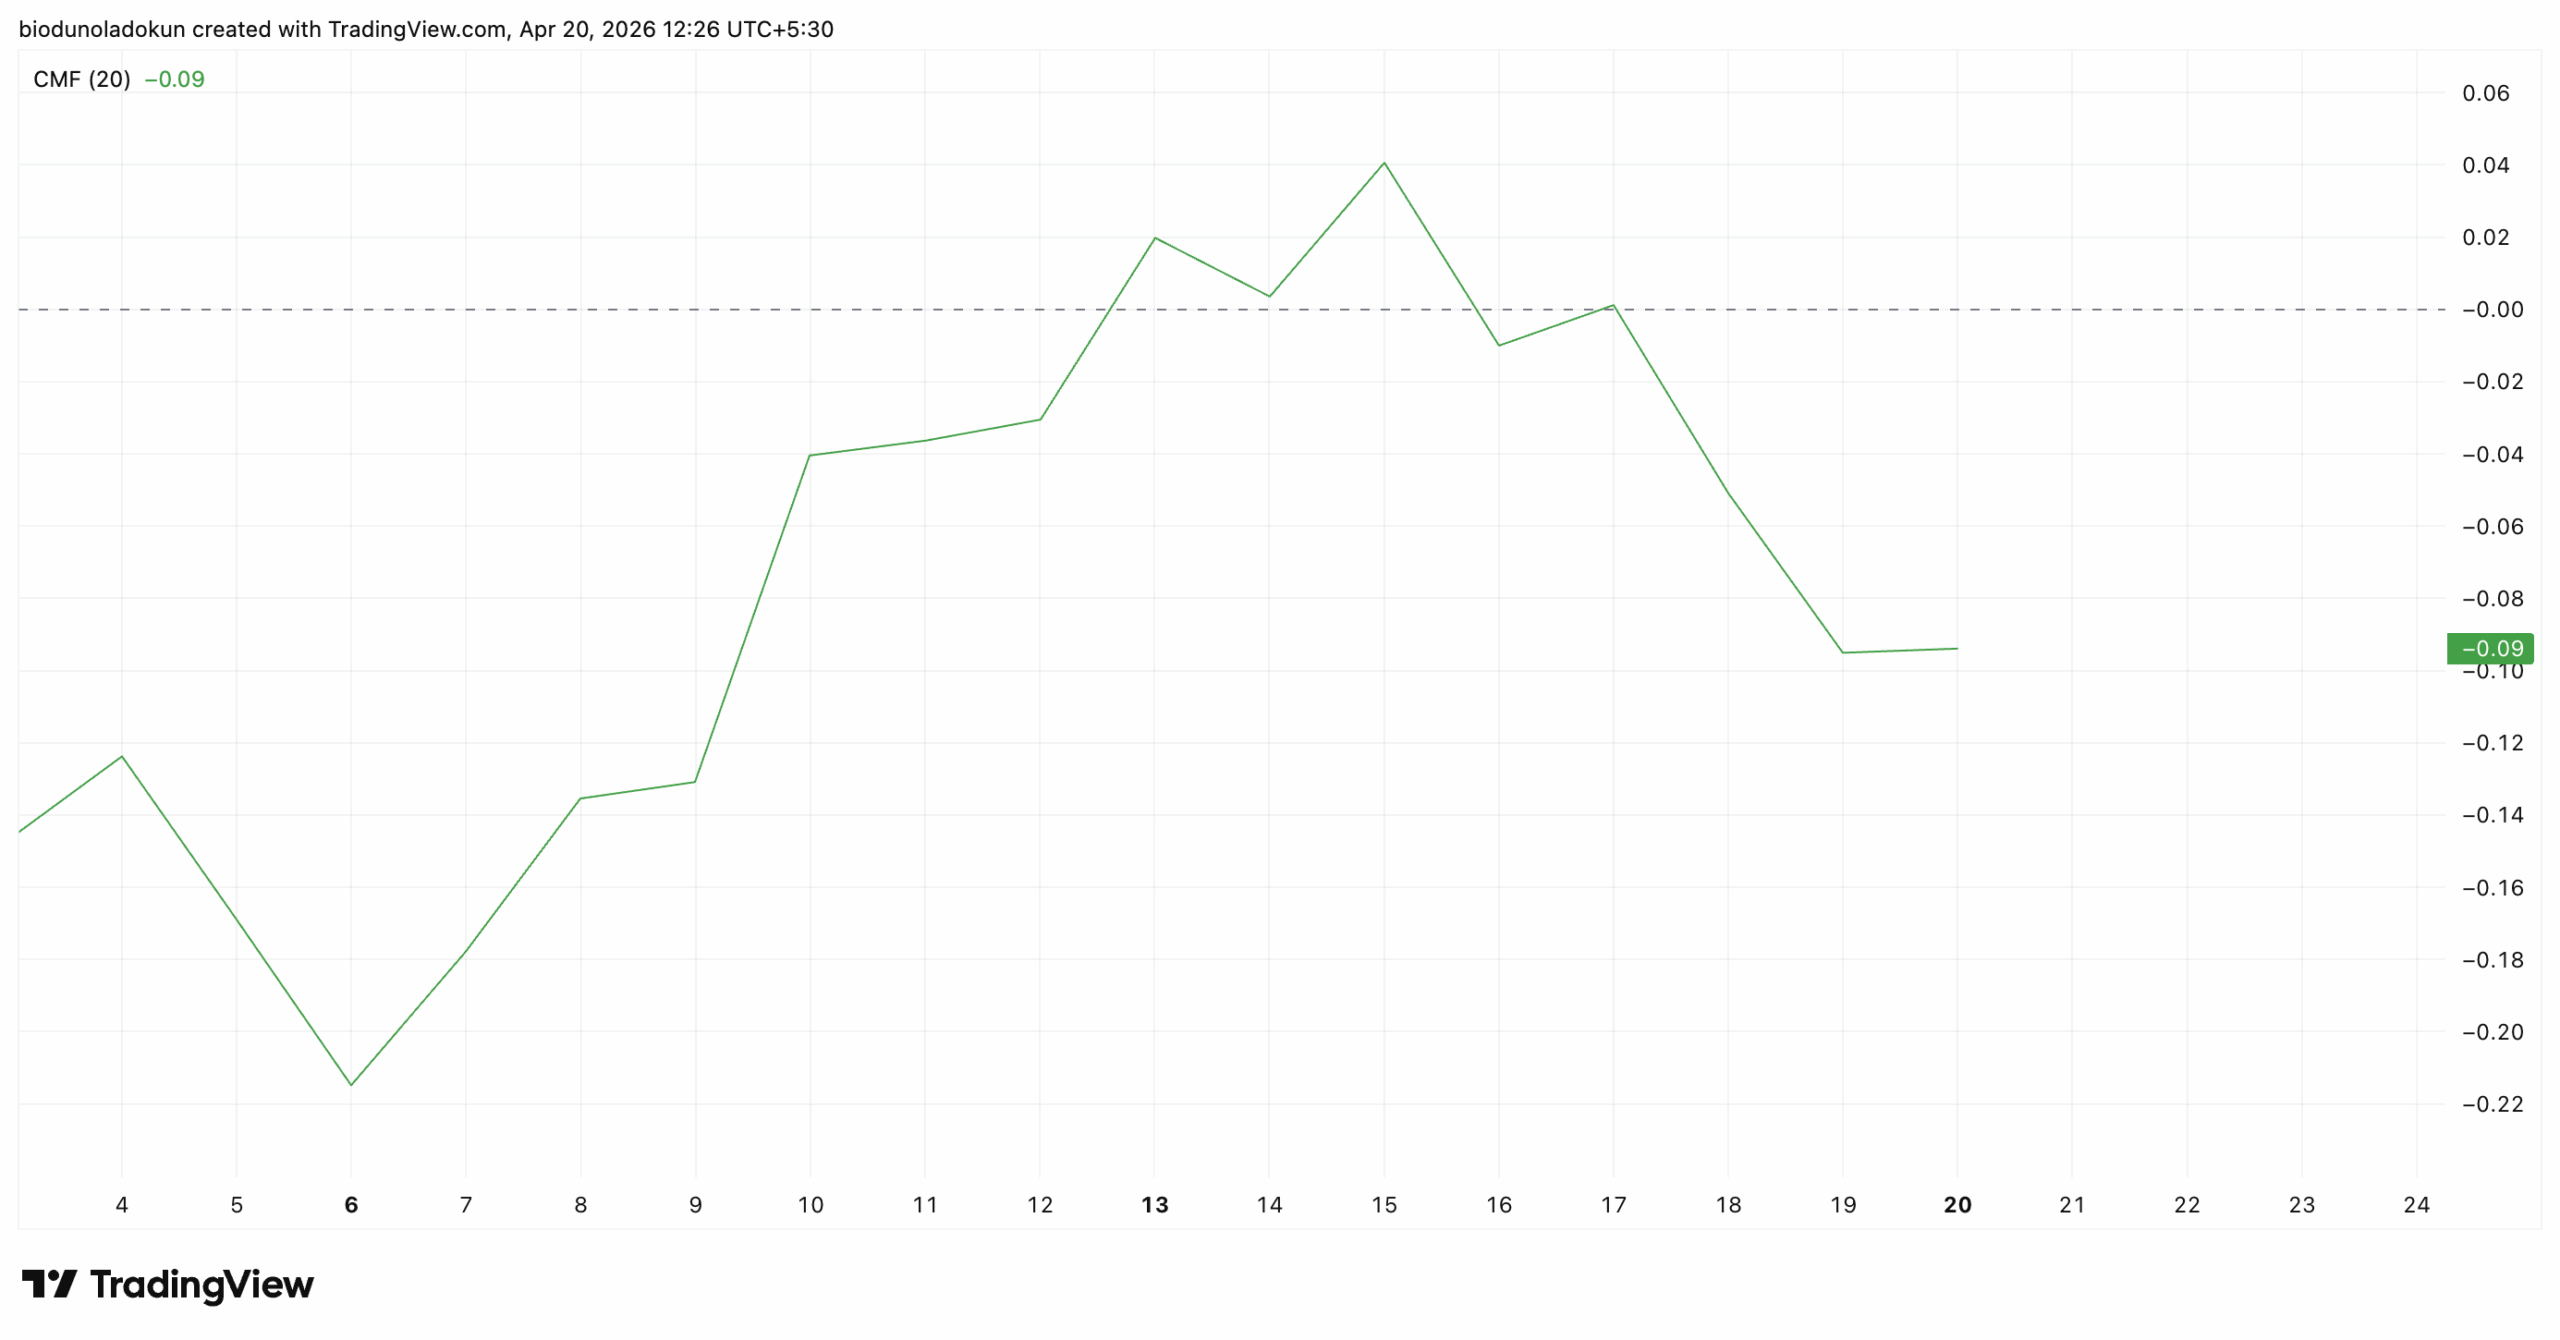
Moreover, at press time, HYPE’s Chaikin Money Flow (CMF) sits below the zero line at -0.09, and continues to trend lower.
The CMF indicator measures the flow of money into and out of an asset. When its value is positive, it suggests high demand and upward price momentum.
On the other hand, negative CMF readings like this point to strengthening selling pressure and rising bearish sentiment.
Bears Have a Clear Target If $38.82 Fails
HYPE currently hovers above the key support floor formed at $38.82. A break below this level is possible if sentiment worsens and demand continues to decline.
In this scenario, the token may fall to $35.32, marking a 14% decline from current prices.
On the other hand, a recovery from current levels would first need to reclaim and rally past at $43.81. The more significant test lies at the $45.72 level, which has capped multiple breakout attempts over since April 14.
A convincing daily close above that level would be required to shift the short-term market structure from bearish to neutral and potentially open the door for a retest of the $50 region.
Disclaimer:
The information provided in this article is for informational purposes only. It is not intended to be, nor should it be construed as, financial advice. We do not make any warranties regarding the completeness, reliability, or accuracy of this information. All investments involve risk, and past performance does not guarantee future results. We recommend consulting a financial advisor before making any investment decisions.
Abiodun Oladokun is a Research Analyst at CCN, where he covers cryptocurrency markets with a focus on on-chain analysis, technical assessments, and emerging trends across decentralized finance (DeFi), real-world assets (RWA), artificial intelligence (AI), decentralized physical infrastructure networks (DePIN), Layer 2s, and meme coins.
Prior to CCN, he served as a Senior On-Chain Analyst at BeInCrypto, producing market reports spanning diverse crypto sectors.
Before that, he conducted technical analysis and market assessments of various altcoins at AMBCrypto, where he also contributed long-form quarterly research papers on DeFi, NFTs, DAOs, and scaling architectures, leveraging on-chain platforms including Messari, Santiment, DefiLlama, and Dune Analytics.
He began his crypto career as a research analyst at SixthSense DAO, developing blockchain forensic tools to trace the history of stolen assets.
Abiodun is a lawyer called to the Nigerian Bar and the founder of Ilé Ijó, a Lagos-based electronic dance music collective.