Bitcoin dominance has hit a 5-month high, reflecting renewed risk appetite tied to US–Iran ceasefire extension talks.
Spot Bitcoin ETFs have logged $1.5 billion in net inflows across six consecutive days, lifting total net assets to $99.08B, confirming a coordinated return of institutional capital.
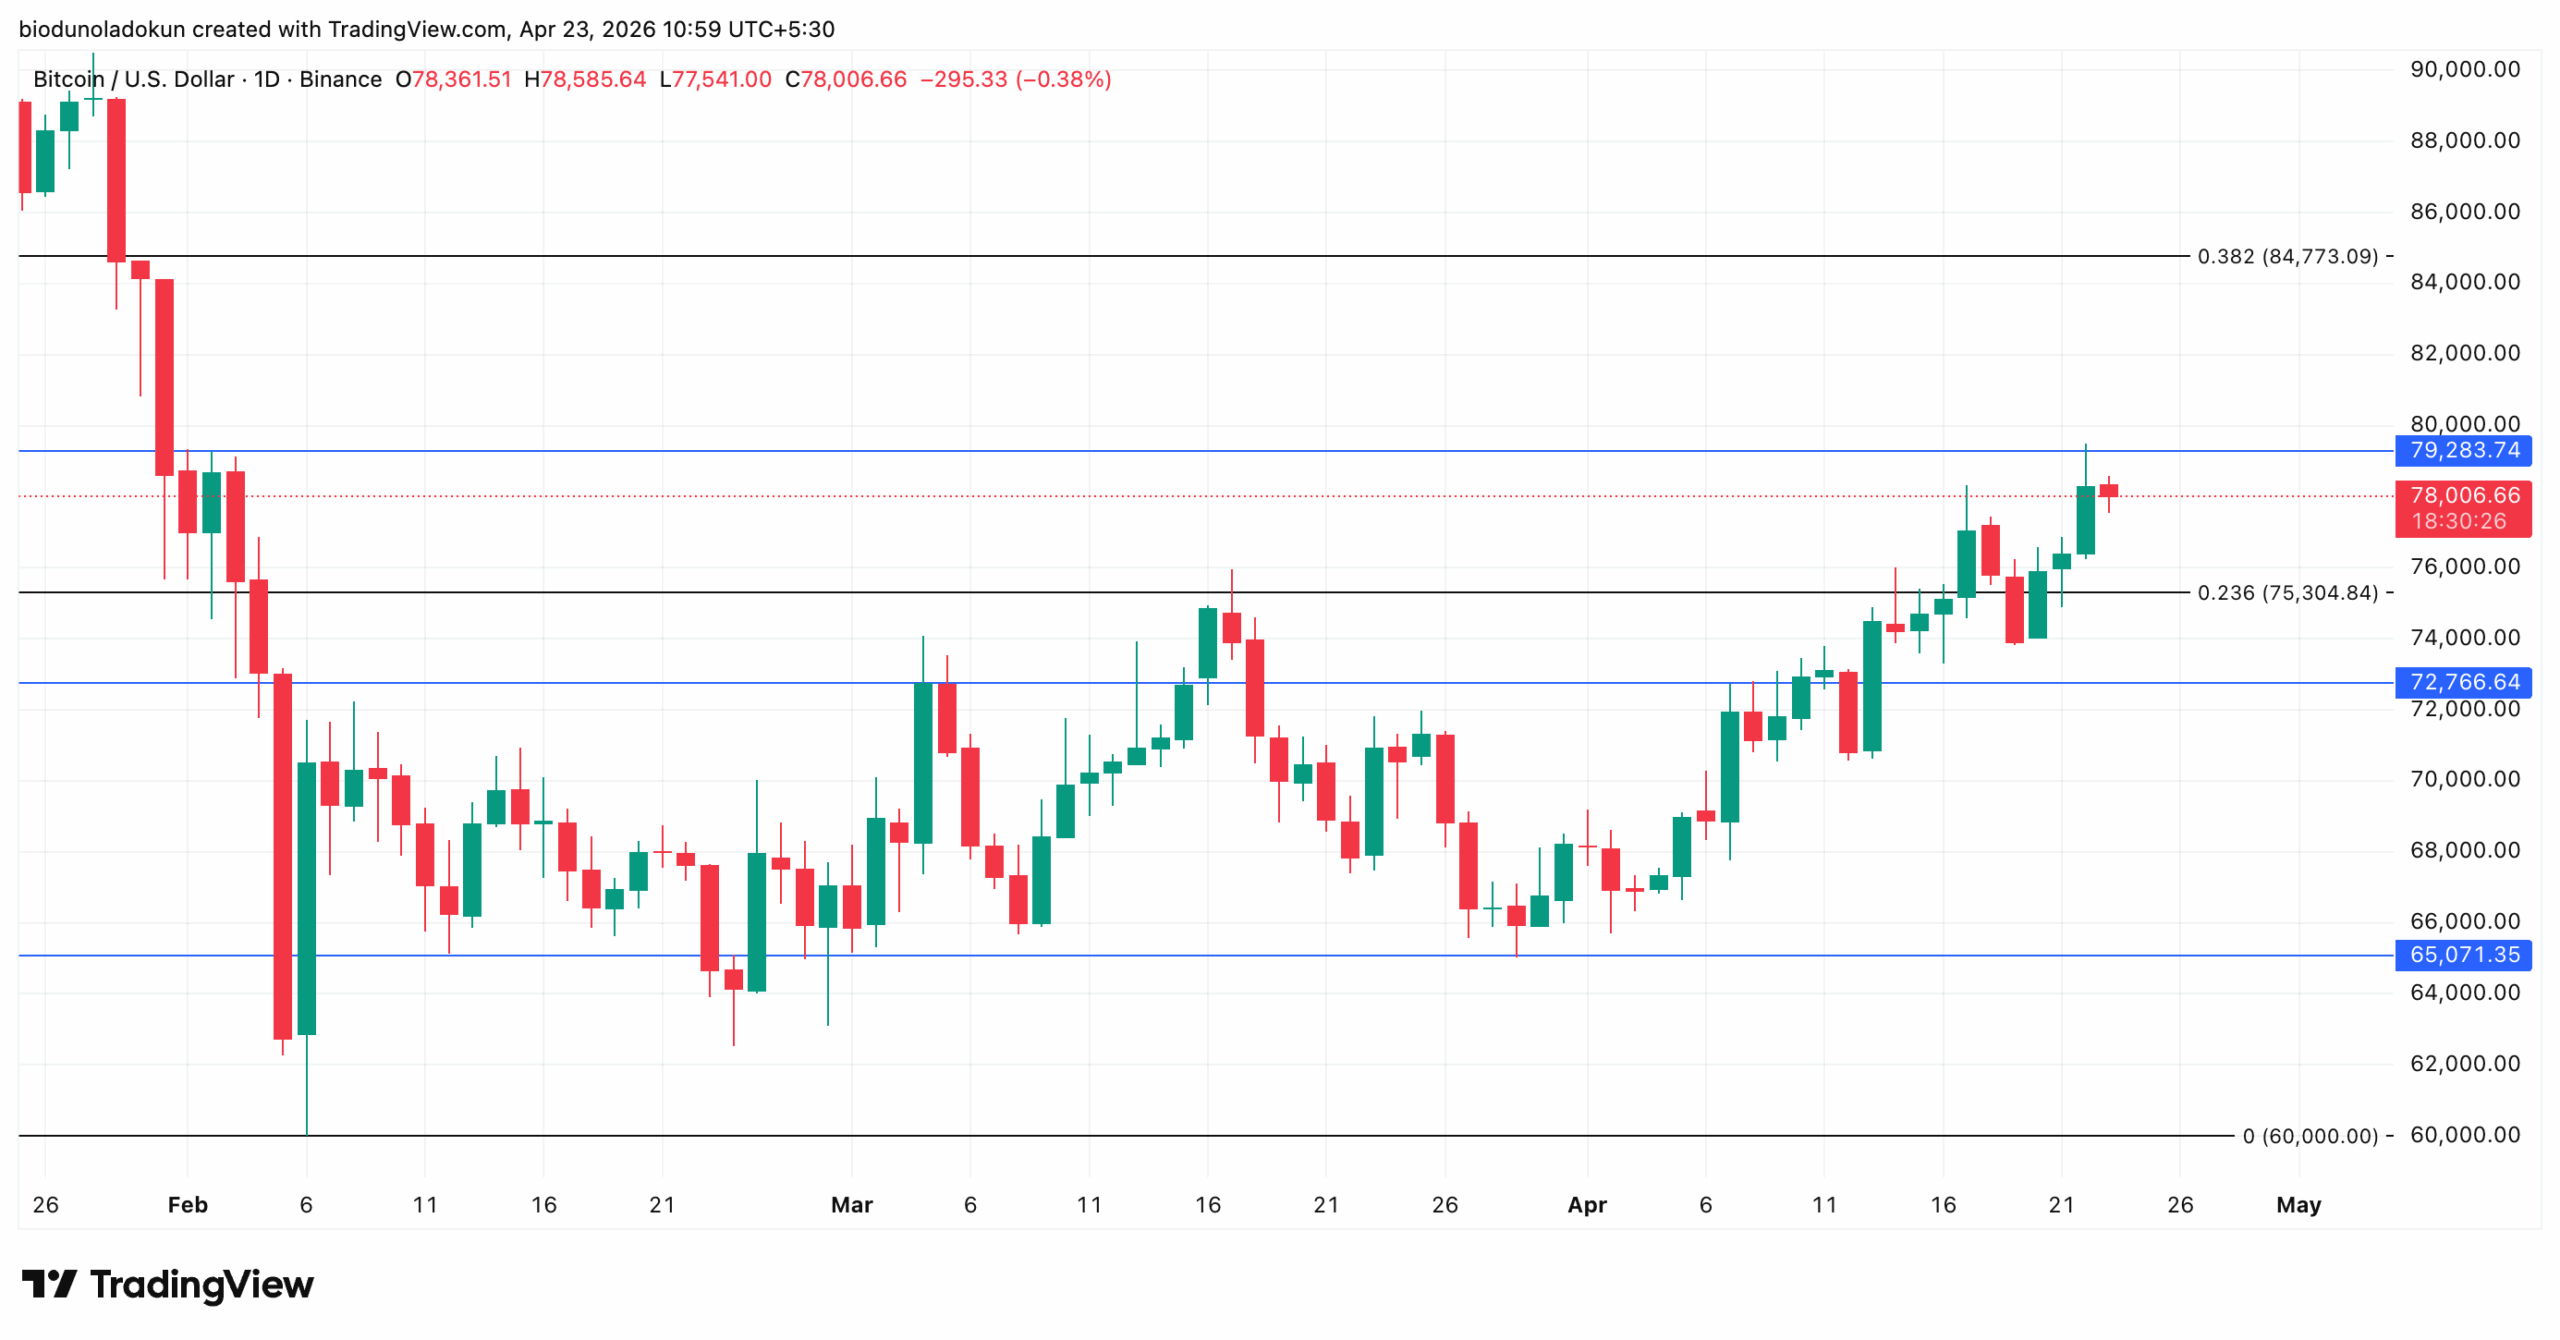
A daily close above $79,283 would open the door to the $80,000 psychological level and a potential extension toward $84,773, while a rejection could send BTC back toward $75,304 support, with $72,766 and $65,071 as deeper downside levels.
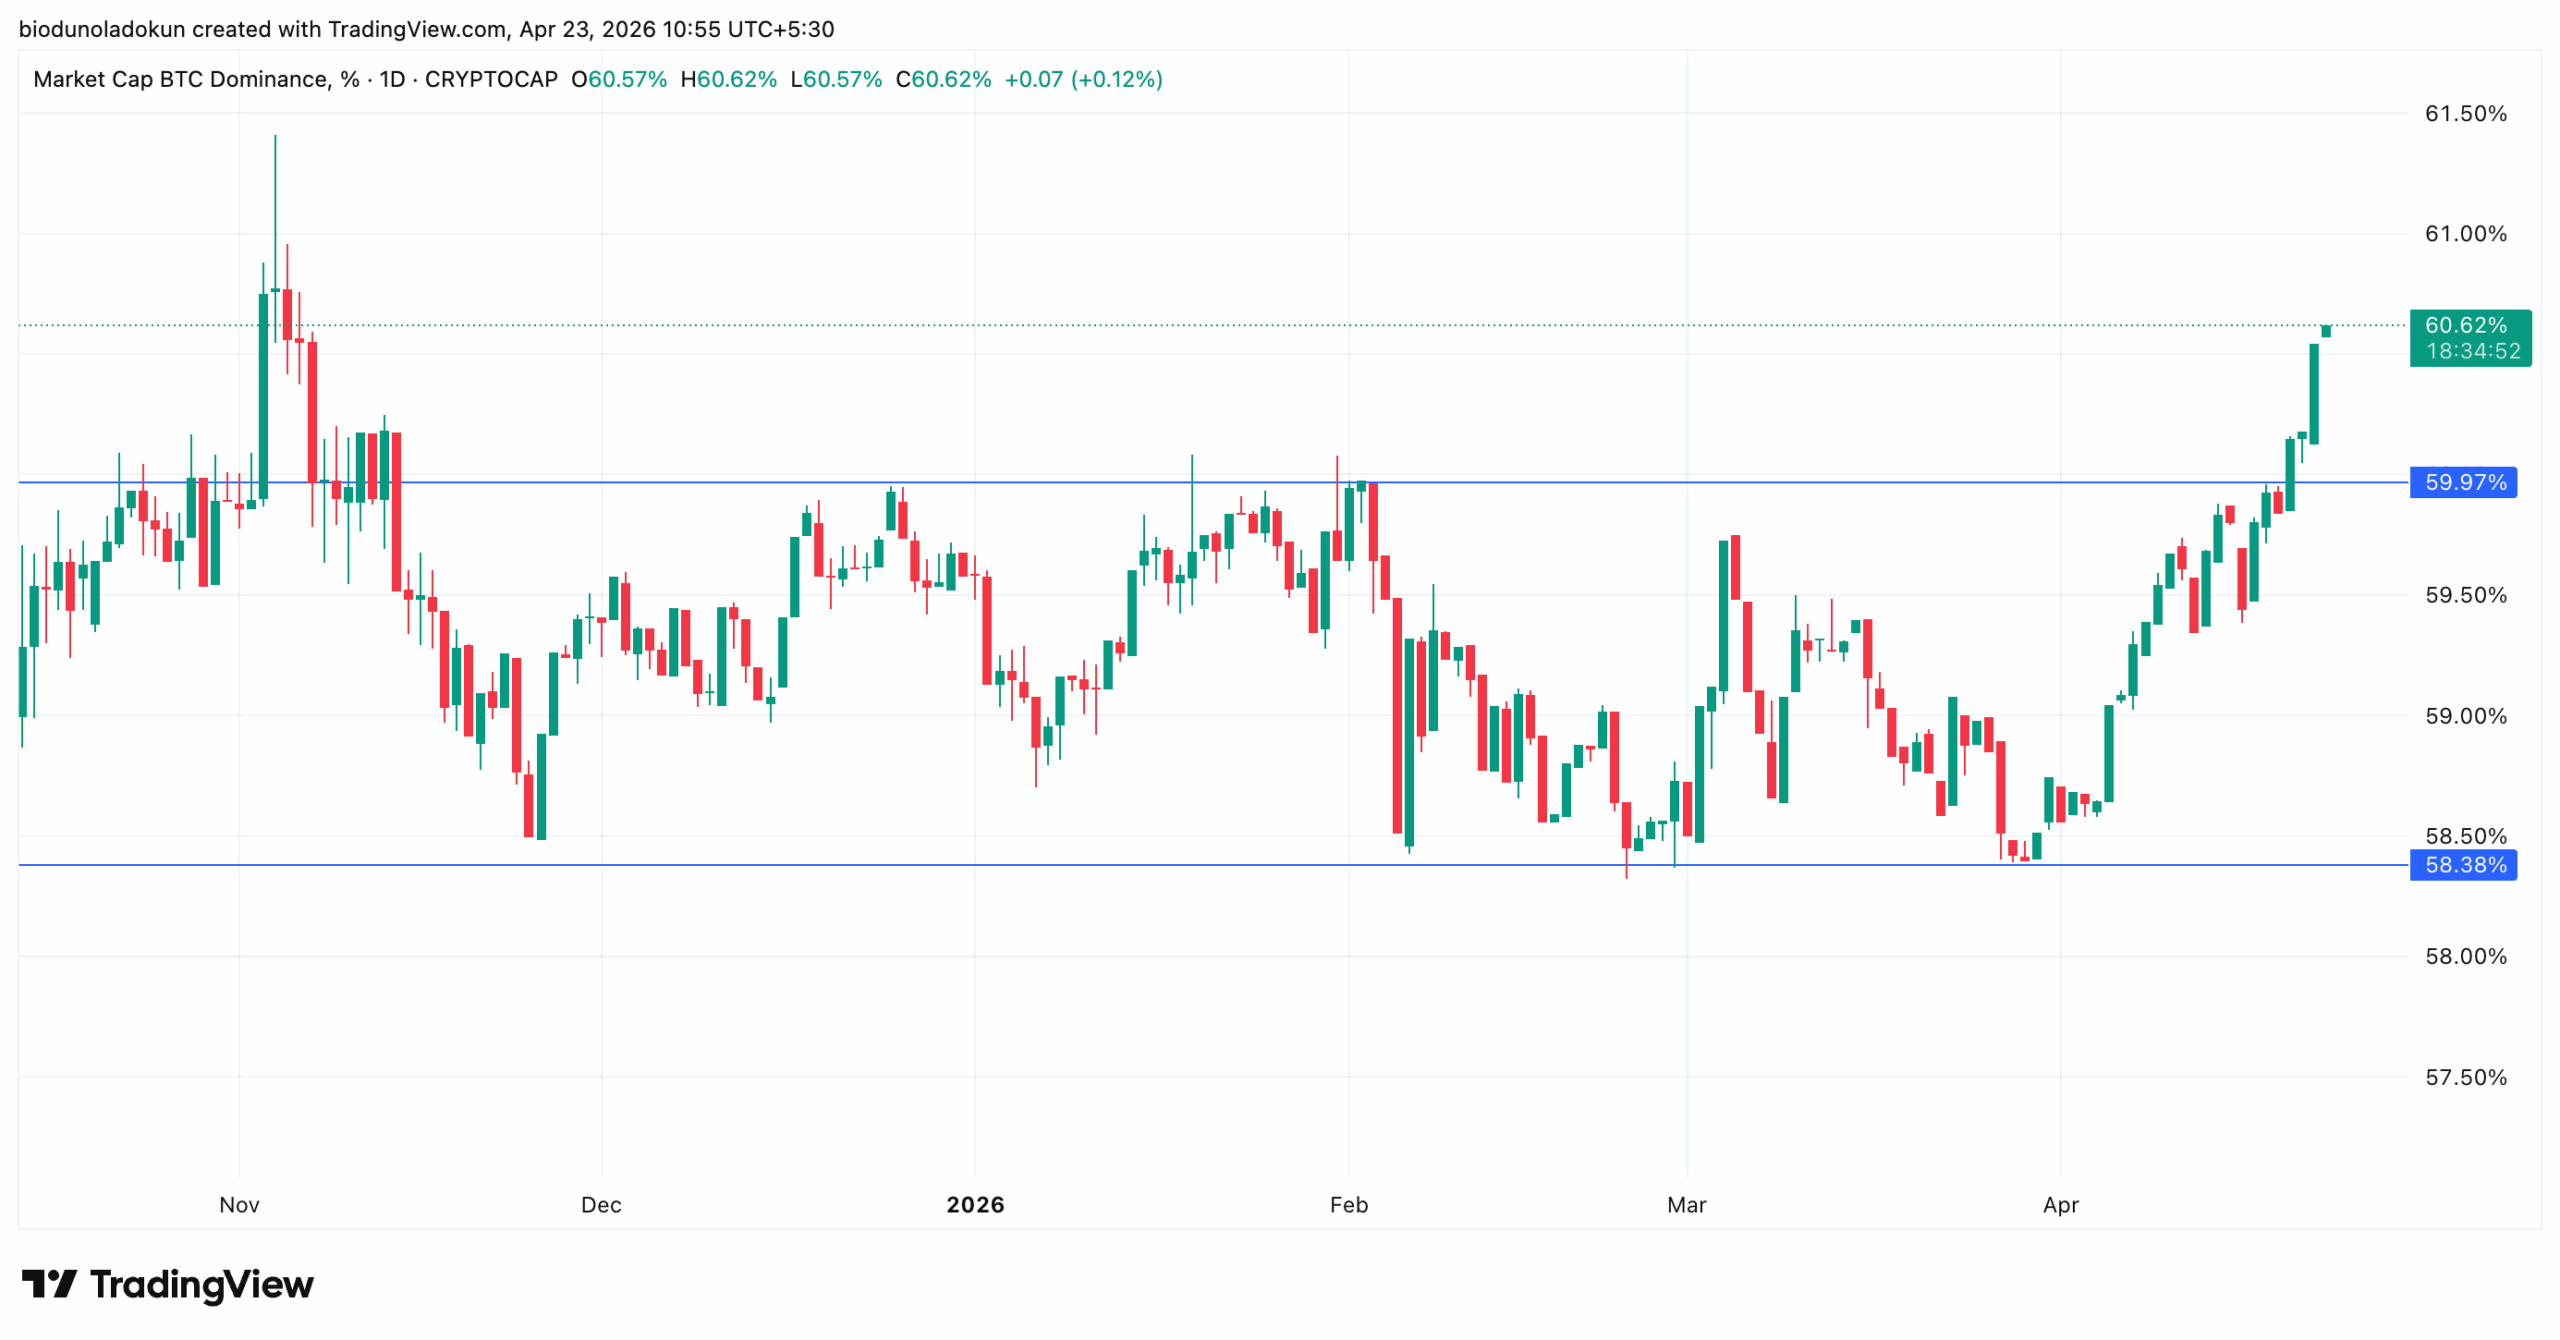
Bitcoin dominance (BTC.D) has climbed to a year-to-date high of 60.62% amid a resurgence in bullish sentiment across the crypto market.
This reflects a continued recovery in risk appetite, driven by the US–Iran ceasefire extension talks, which appear to have improved investor sentiment for the king coin.
With on-chain and technical indicators now aligning bullishly, a rally past the $80,000 line may be back on the table.
Bitcoin Dominance Climbs to 5-Month High
BTC.D, which tracks Bitcoin’s share of the total crypto market capitalization, spent the first quarter consolidating between 59.97% and 58.38%%, before staging a breakout on Monday.
Since then, it has trended upward slightly, reaching a 5-month high of 60.62 as of this writing.
The dominance surge is happening amid a rise in new demand, which has pushed BTC’s price up roughly 4% over the past week.
Big Money Piles In
On-chain and derivatives data suggest the rally has room to run in the short term as large players continue to increase exposure.
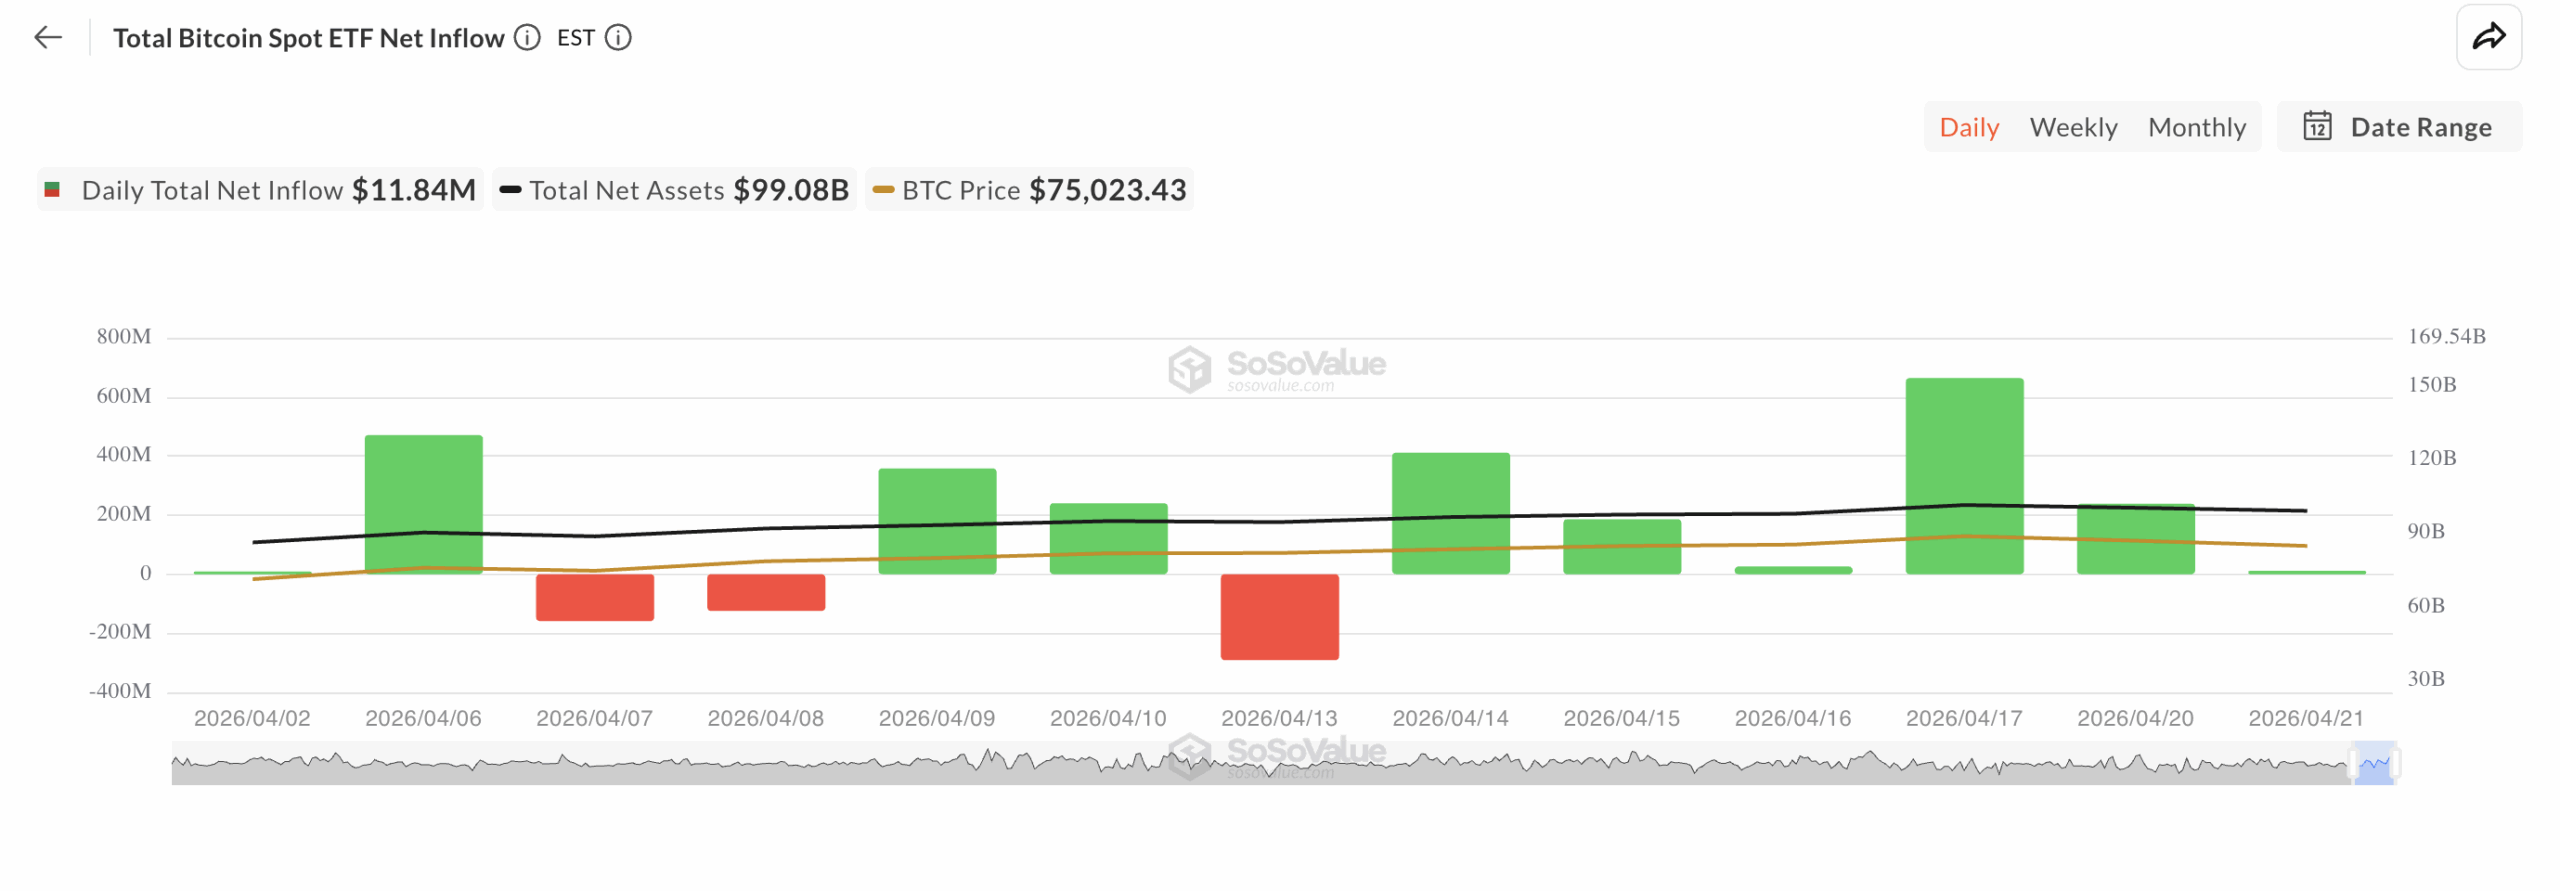
According to SoSoValue, spot Bitcoin ETFs have recorded six consecutive days of net inflows, totaling $1.5 billion.
This brings the total net assets across the 11 US-listed spot BTC funds to $99.08 billion.
Total Bitcoin Spot ETF Net Inflow | Credit: SosoValue
When spot BTC ETFs print rising net inflows of this kind, it signals sustained institutional demand. Historically, multi-day streaks of ETF inflows have been a reliable leading indicator of BTC price rallies.
If the current streak holds and daily inflows remain positive, the coin’s price could gain more strength in the meantime.
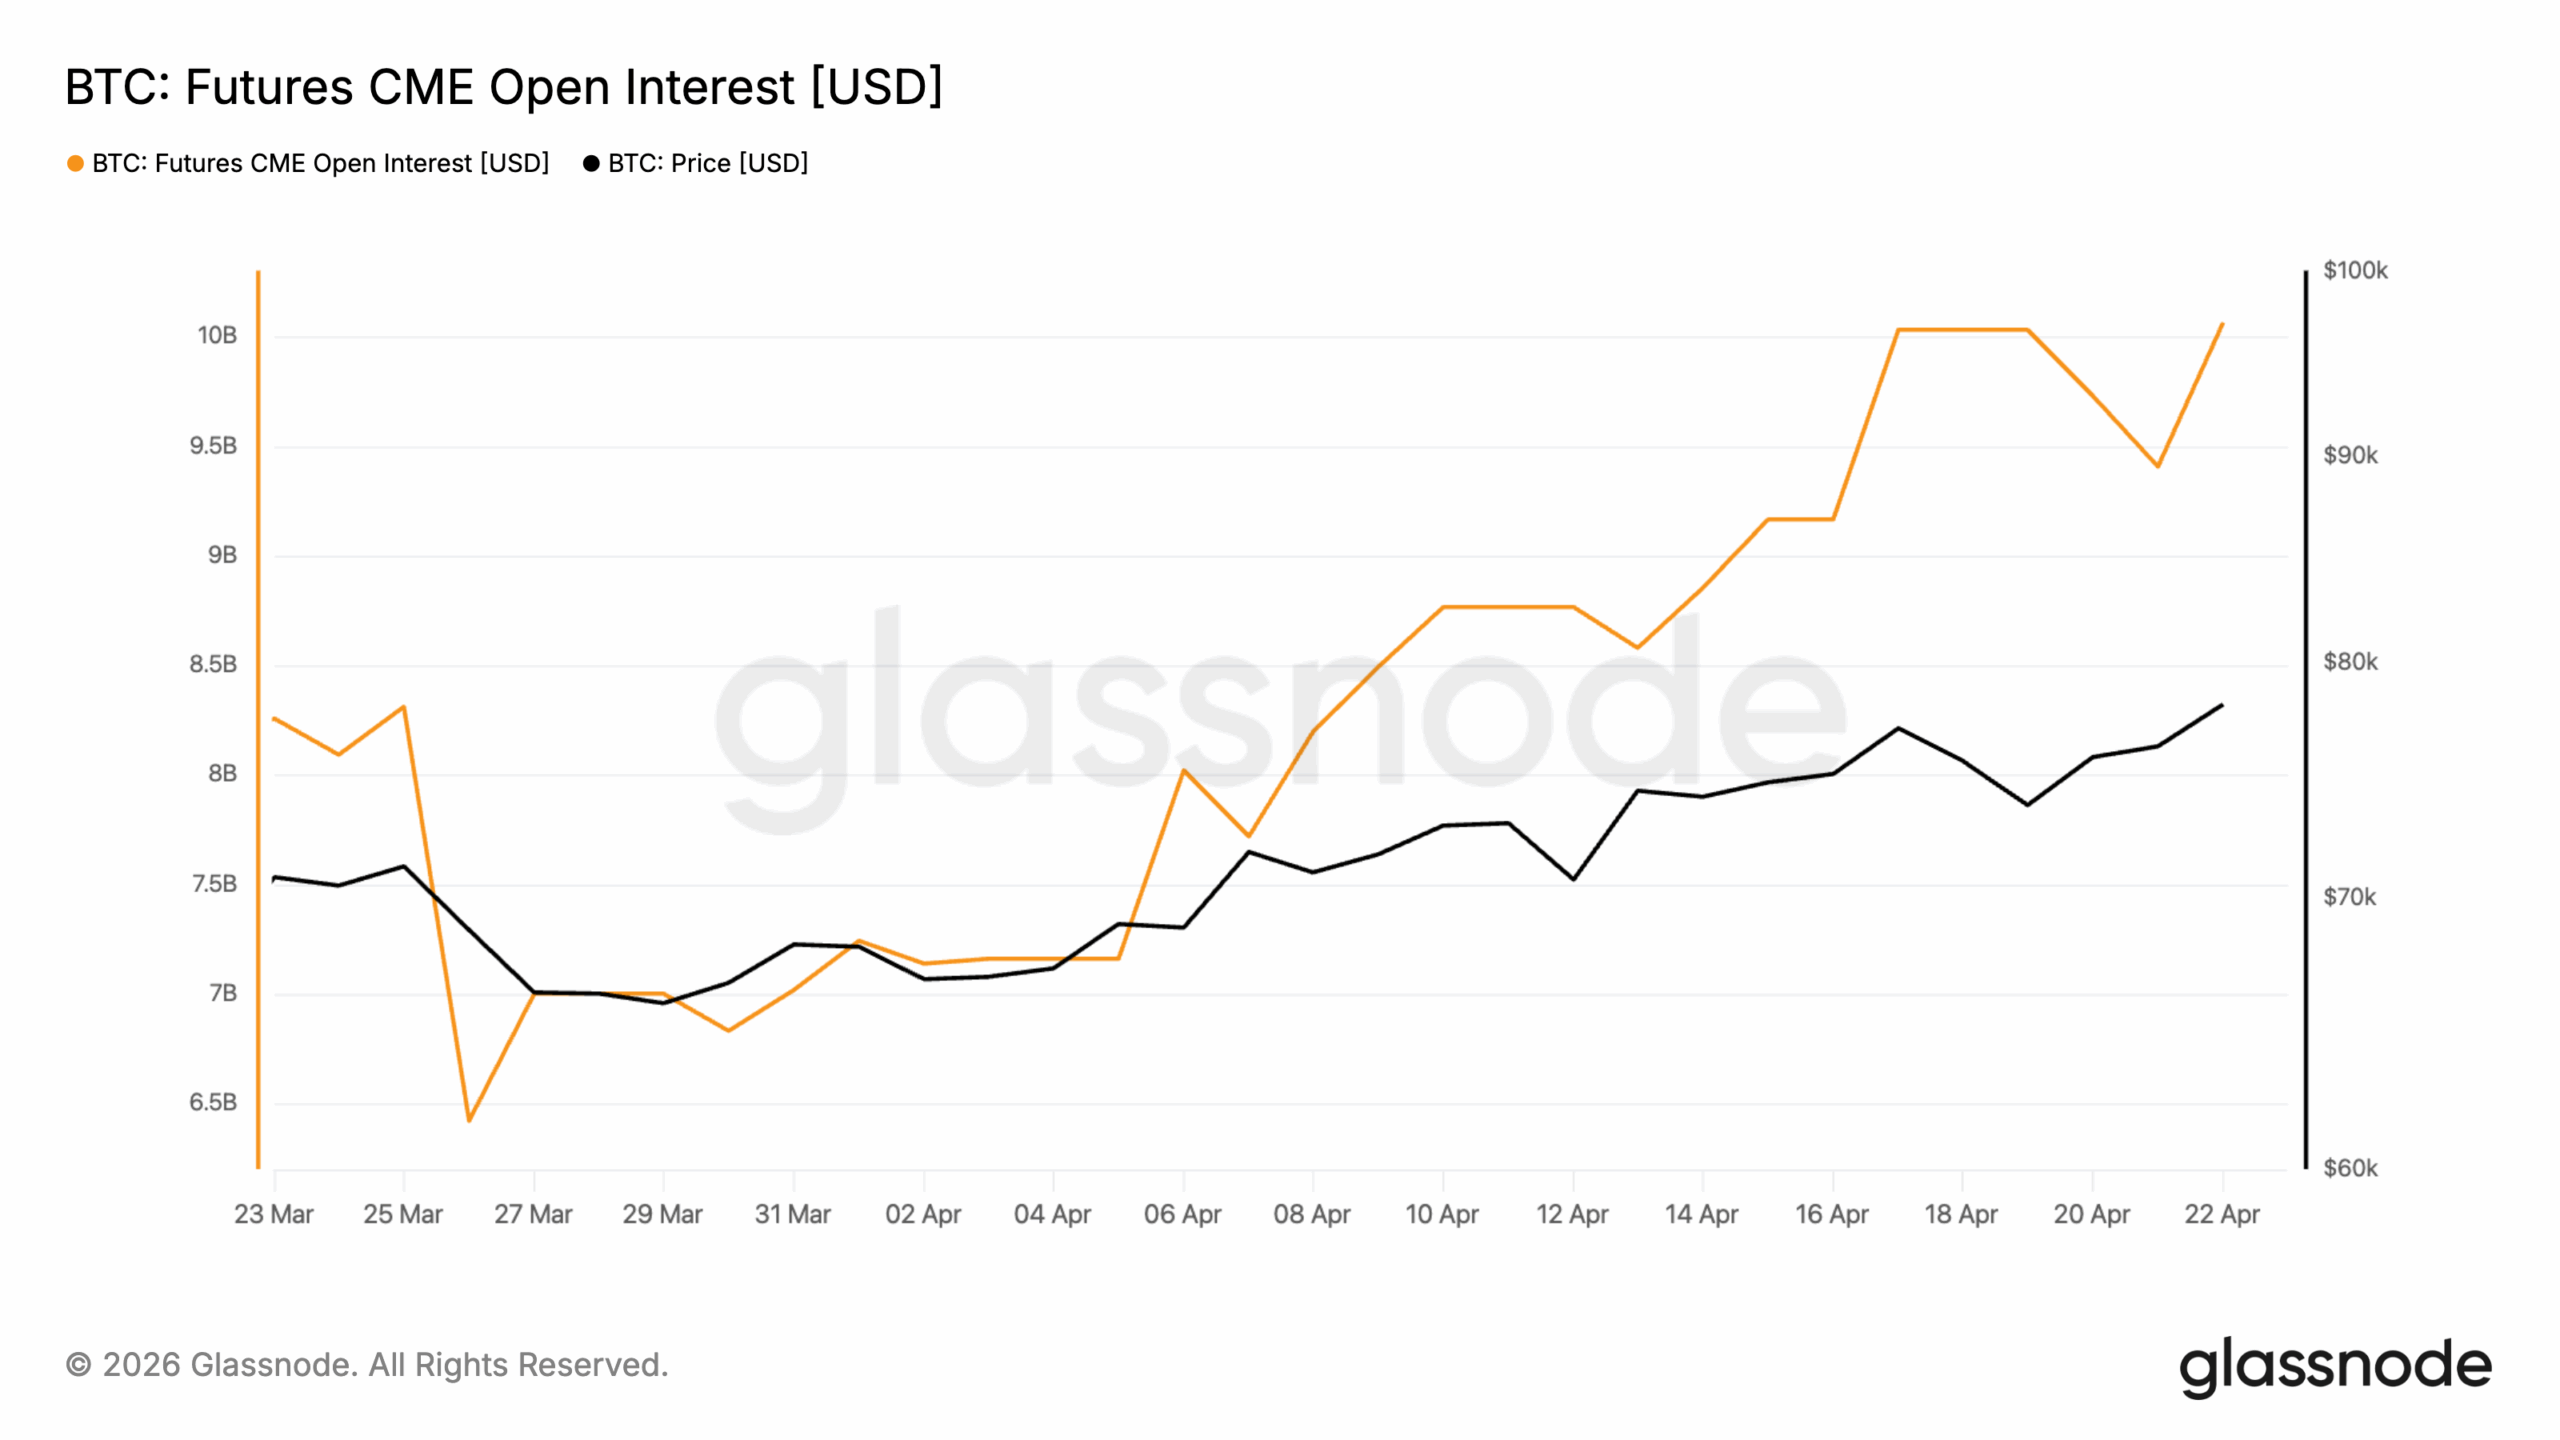
Further, over the past seven days, open interest in BTC futures contracts on the Chicago Mercantile Exchange (CME) has risen sharply.
Per Glassnode, CME BTC futures open interest closed at a 30-day high of $10.06 billion on Wednesday, confirming the steady surge in participation from larger market players.
The CME is a proxy for institutional sentiment, given that its contracts are primarily traded by regulated entities.
Unlike retail-driven activity, flows from these holders can provide more sustained market support, increasing the chances of a BTC further rally.
Spot Demand Sees Growth
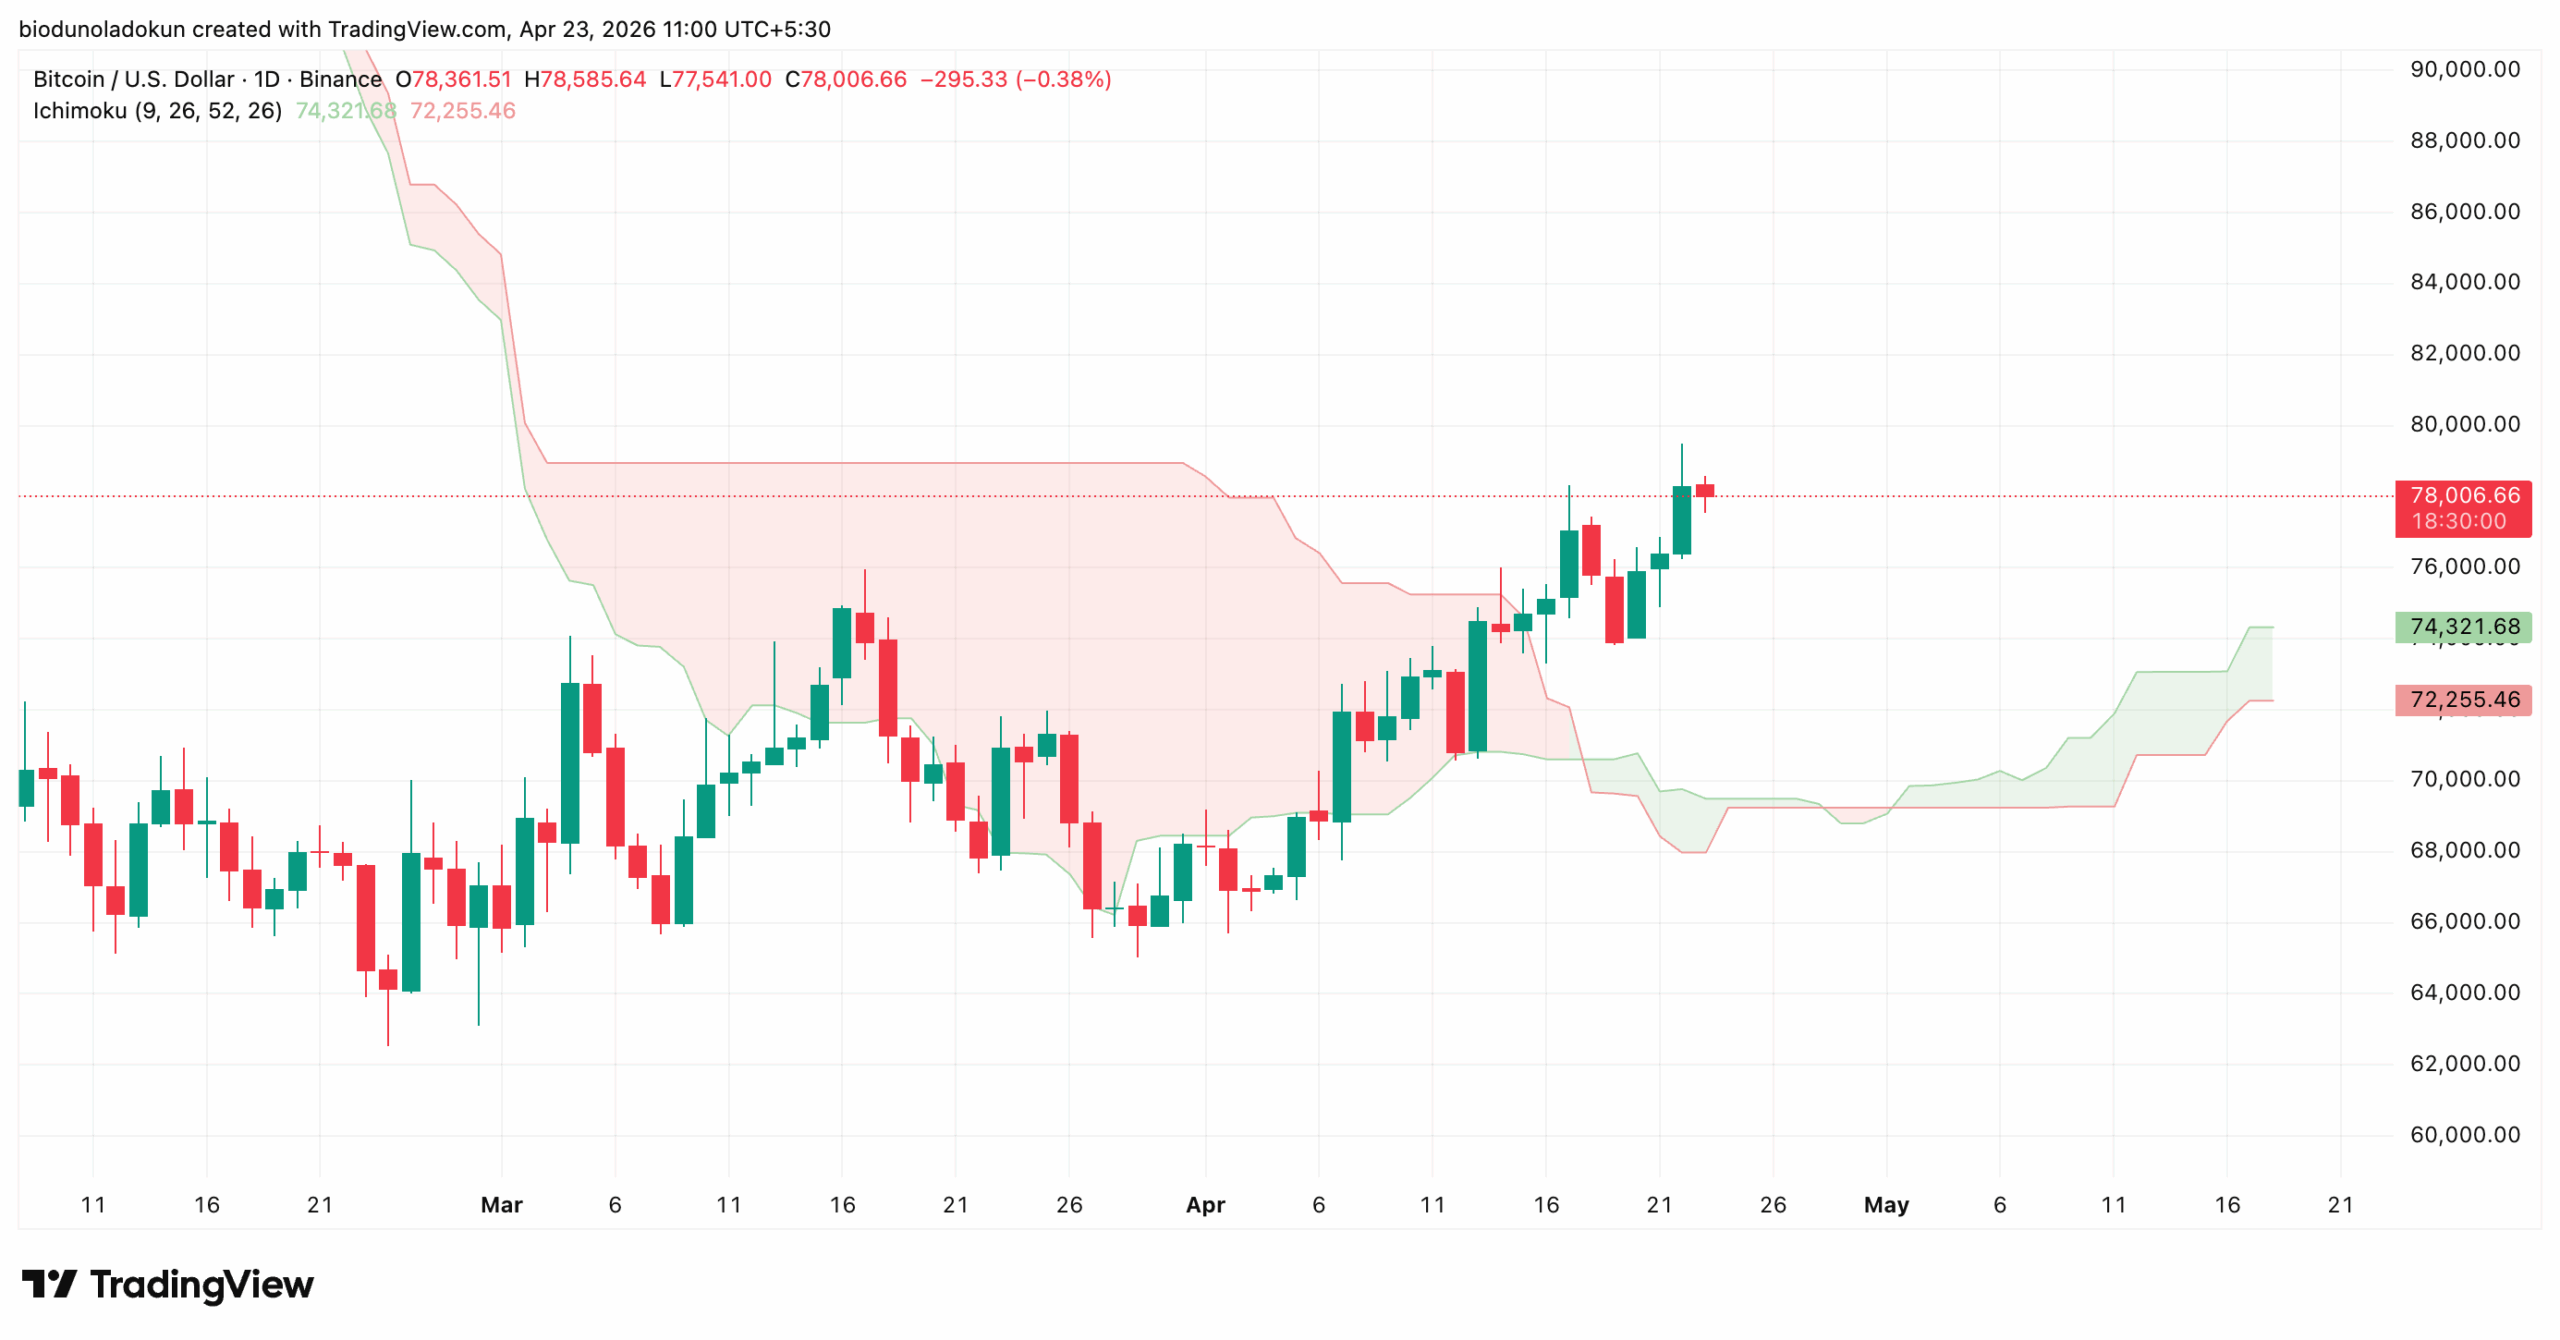
On the daily chart, BTC now sits above the Ichimoku Cloud, confirming the rising spot market demand.
At press time, the coin trades above the Leading Spans A and B of this key indicator, which currently have formed dynamic support levels at $74,321 and $72,255, respectively.
The Ichimoku Cloud tracks an asset’s market momentum and identifies potential support and resistance levels.
When an asset’s price falls below this cloud, it signals bearish control, with the cloud itself acting as resistance that sellers will defend on any attempted recovery.
Conversely, as with BTC, a price trading above the cloud signals a bullish trend, with the Leading Spans acting as support floors that buyers try to defend.
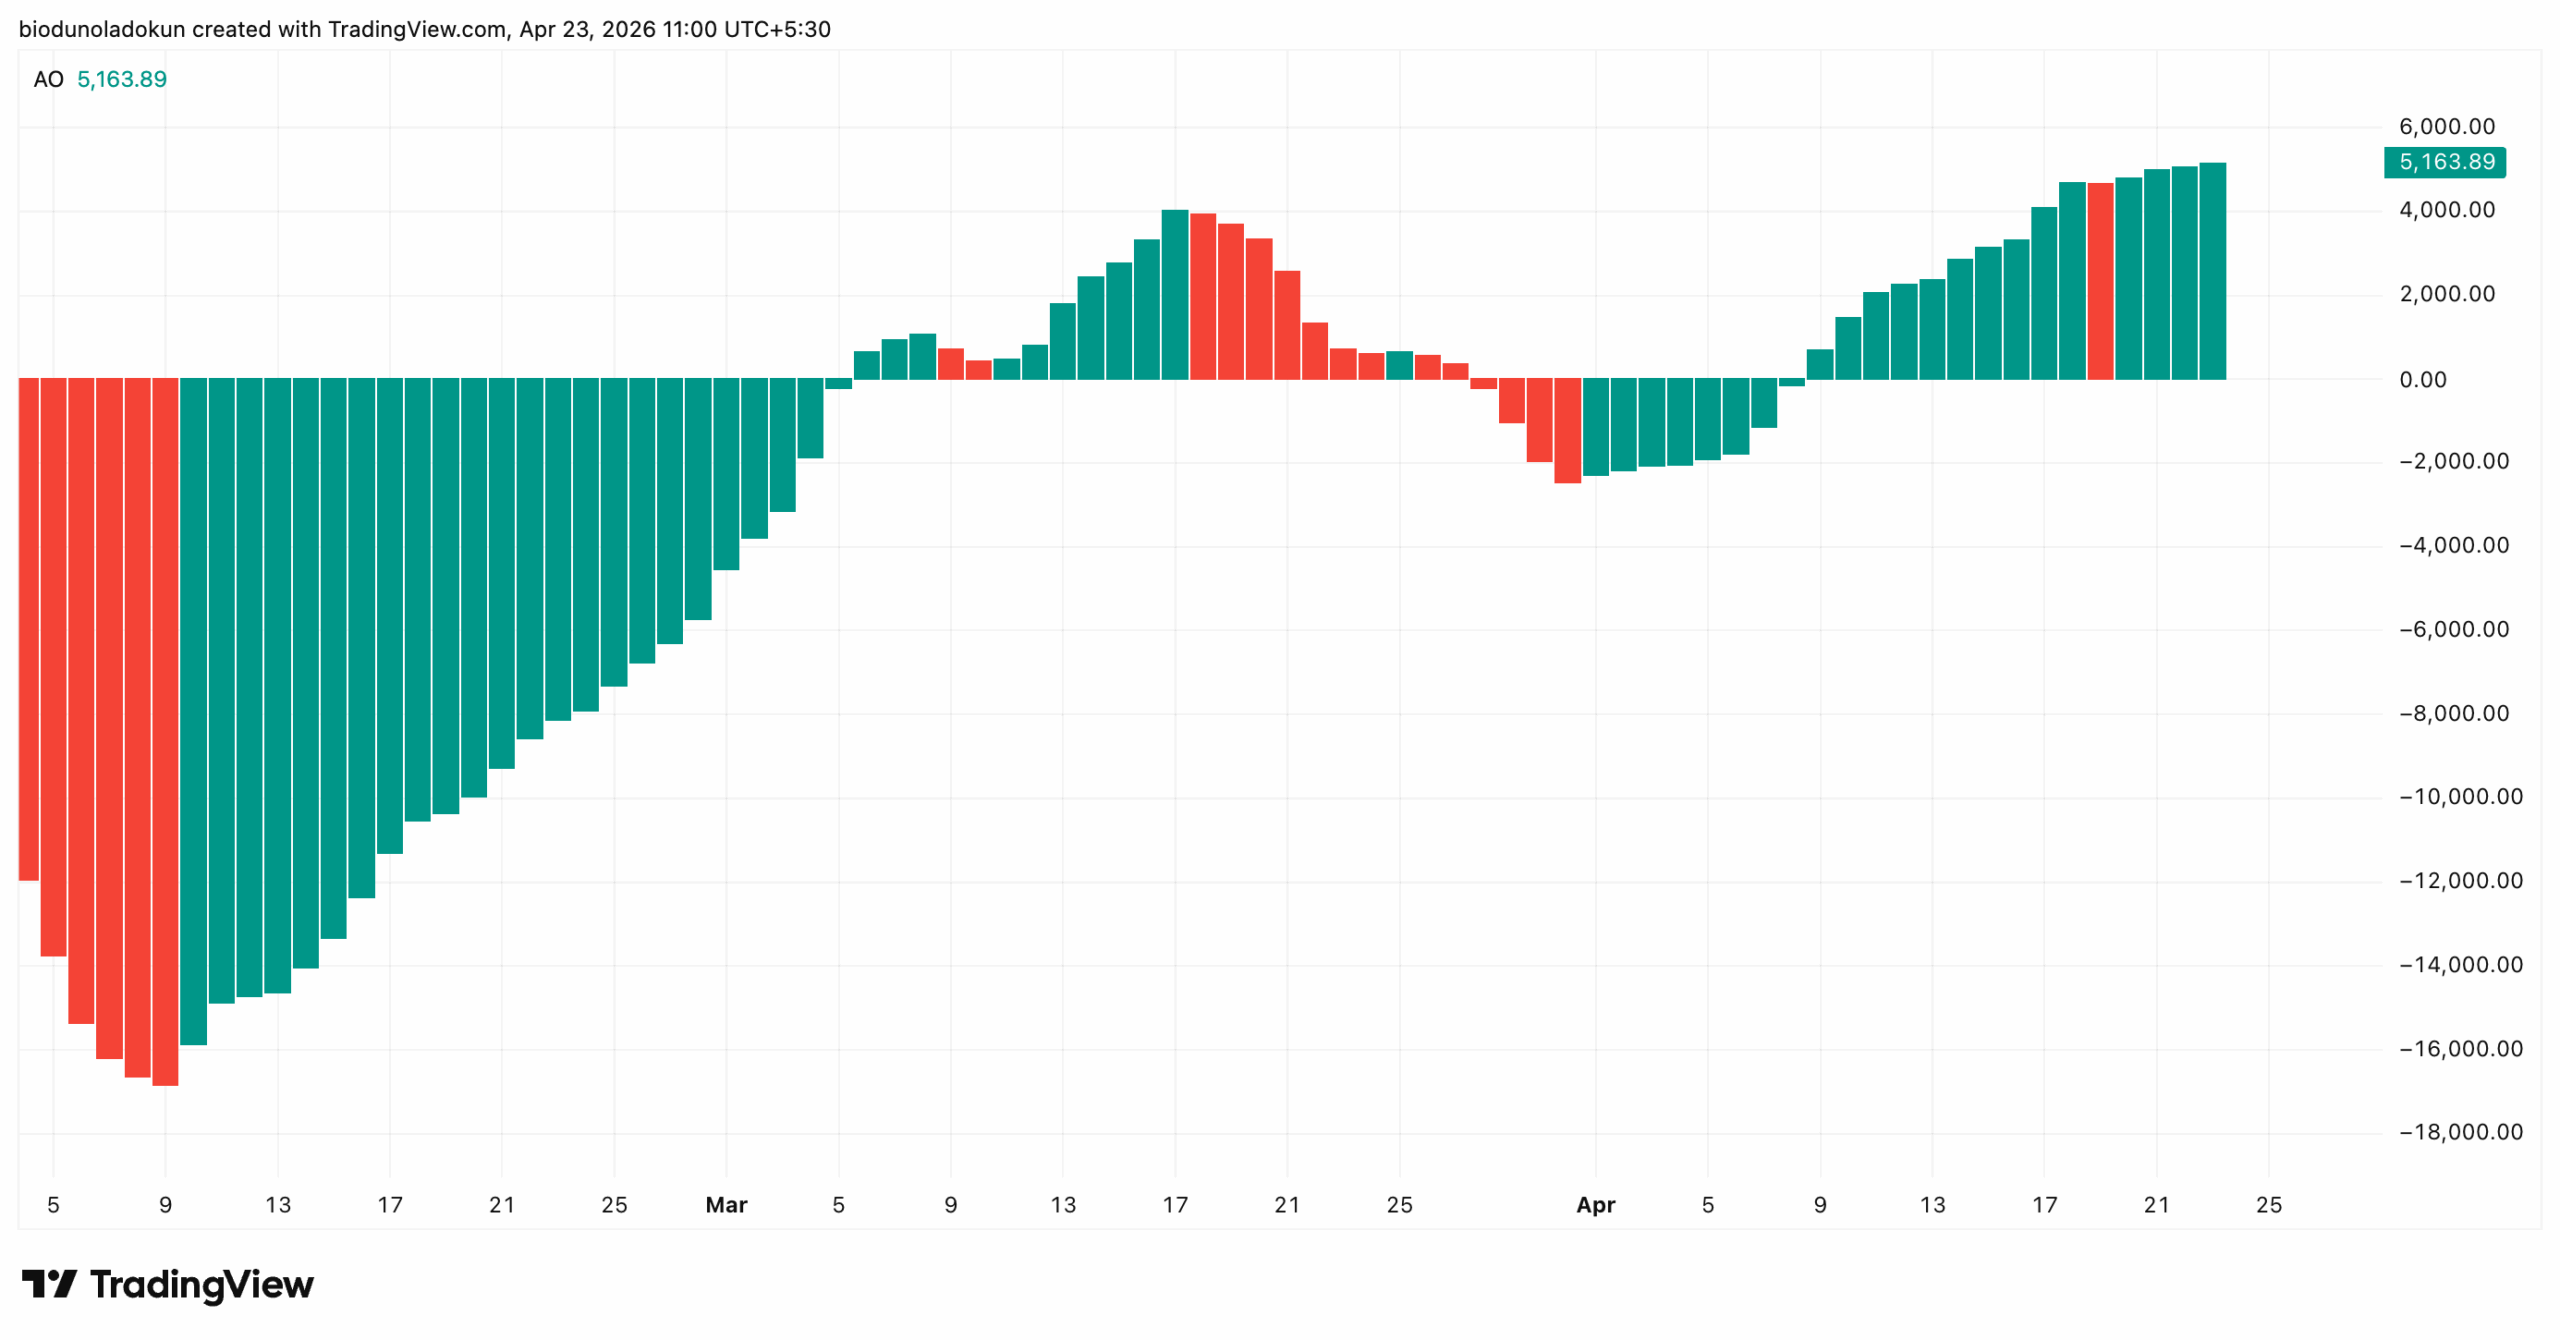
Moreover, the coin’s Awesome Oscillator (AO) supports this positive outlook. The momentum indicator has returned a near-uninterrupted run of green histogram bars since April 9, with each successive bar growing in size.
This is a signal of climbing bullish momentum and deepening spot demand.
BTC Price Prediction
A sustained run of institutional buys, CME futures OI expansion, and deepening spot demand could trigger a BTC breakout above the next major resistance at $79,283.
A daily close above this level would open the door to the $80,000 psychological level. If demand remains, BTC could extend toward $84,773, a high last reached four months ago.
However, if profit-taking resumes, the bullish projection will be invalidated. In that scenario, the king coin’s value could slip toward support at $75,304.
A failure to hold that floor would expose BTC to a deeper pullback toward $72,766, and a possible retest of the $65,071 range low if selling pressure intensifies.
Disclaimer:
The information provided in this article is for informational purposes only. It is not intended to be, nor should it be construed as, financial advice. We do not make any warranties regarding the completeness, reliability, or accuracy of this information. All investments involve risk, and past performance does not guarantee future results. We recommend consulting a financial advisor before making any investment decisions.
Abiodun Oladokun is a Research Analyst at CCN, where he covers cryptocurrency markets with a focus on on-chain analysis, technical assessments, and emerging trends across decentralized finance (DeFi), real-world assets (RWA), artificial intelligence (AI), decentralized physical infrastructure networks (DePIN), Layer 2s, and meme coins.
Prior to CCN, he served as a Senior On-Chain Analyst at BeInCrypto, producing market reports spanning diverse crypto sectors.
Before that, he conducted technical analysis and market assessments of various altcoins at AMBCrypto, where he also contributed long-form quarterly research papers on DeFi, NFTs, DAOs, and scaling architectures, leveraging on-chain platforms including Messari, Santiment, DefiLlama, and Dune Analytics.
He began his crypto career as a research analyst at SixthSense DAO, developing blockchain forensic tools to trace the history of stolen assets.
Abiodun is a lawyer called to the Nigerian Bar and the founder of Ilé Ijó, a Lagos-based electronic dance music collective.