Bitcoin remains in an uptrend, but momentum is weakening as the price struggles to hold above $78,000.
Low volatility and rising open interest suggest a major move is building, with a breakout or sharp pullback.
A break above resistance could push BTC higher, while failure may lead to a drop toward $70,000 or lower.
Bitcoin’s (BTC) rally hasn’t broken, but it is starting to slow.
At the time of writing, the structure still leans bullish, with higher lows holding. But momentum has clearly softened.
The recent rejection near the key $80,000 level now stands out as a critical signal.
That leaves the market at an inflection point, where the next move will likely depend on how the price reacts around these key levels.
Bitcoin Rally Pauses Before Next Breakout
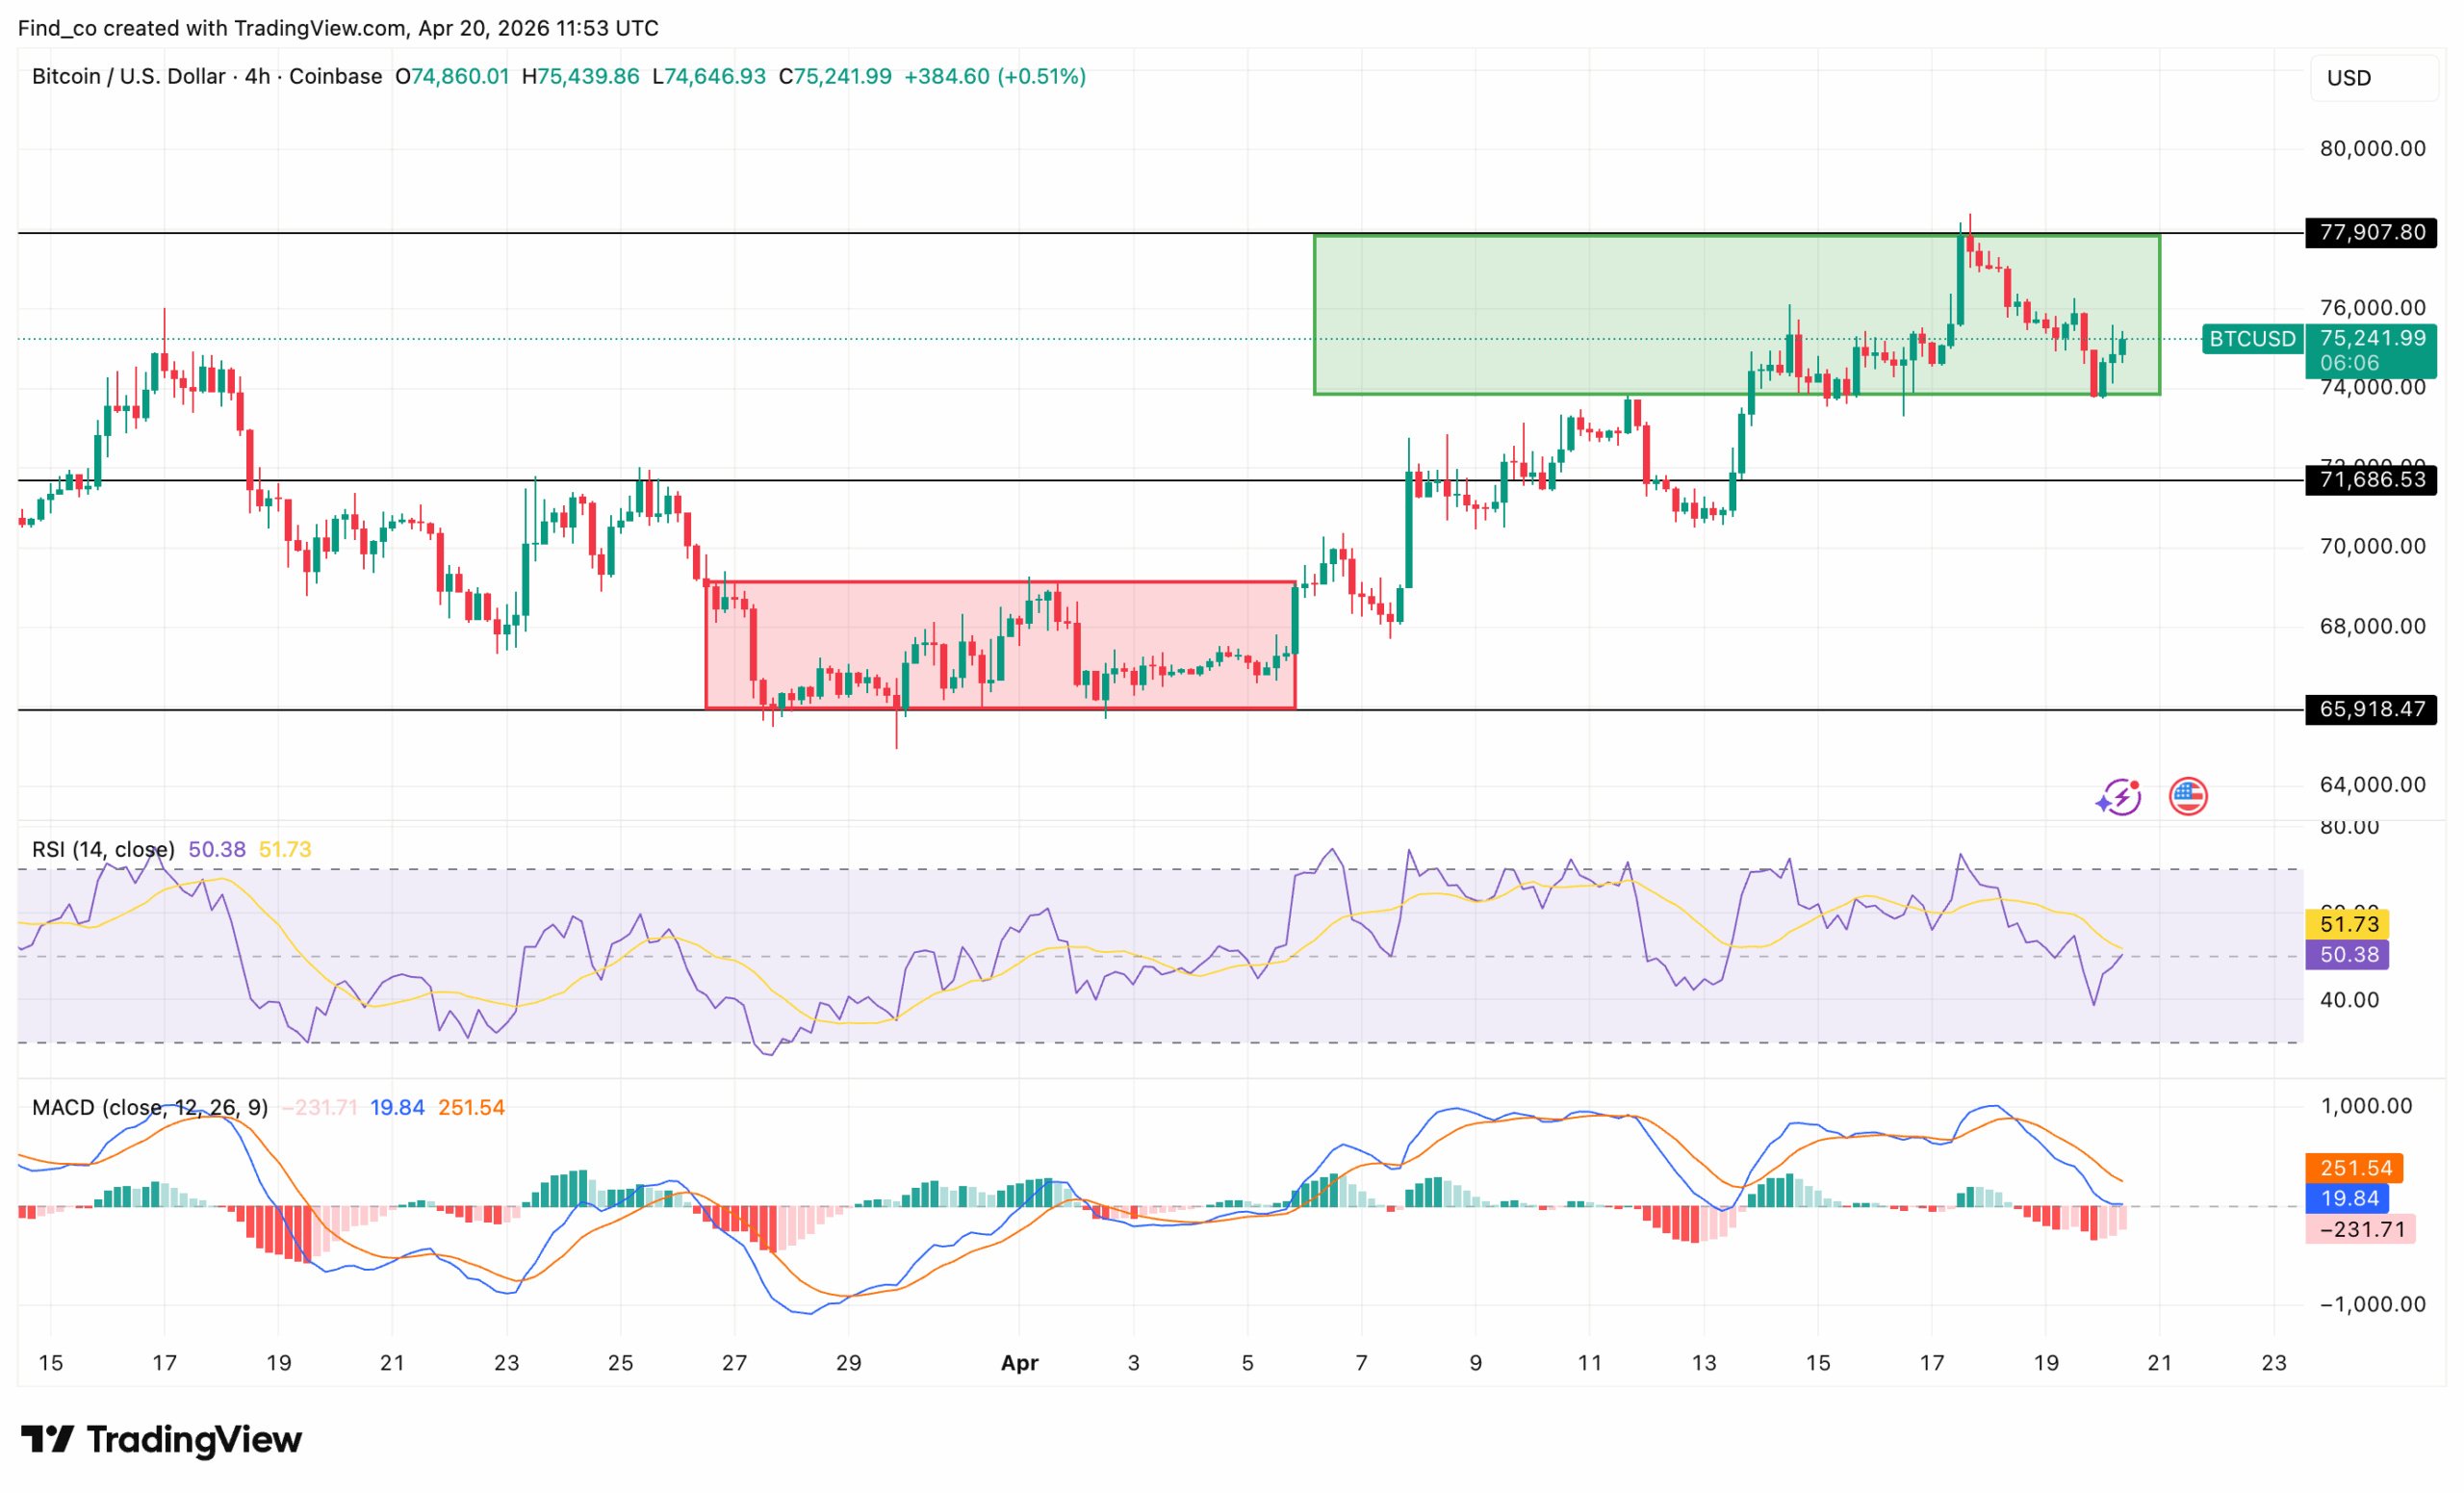
BTC is showing resilience. After a strong upward move, the price is now consolidating around the $75,000 zone. Buyers are still active.
More importantly, it continues to print higher lows, reinforcing the broader uptrend
However, upside momentum has slowed. BTC’s price recently tested the $78,000 region but failed to sustain the breakout, as that region is currently acting as resistance.
Get These Top Crypto Casino Offers Now!
Sponsored
Disclosure
We sometimes use affiliate links in our content, when clicking on those we might receive a commission at no extra cost to you. By using this website you agree to our terms and conditions and privacy policy.
Still, there is no strong bearish confirmation. Instead, this looks like consolidation within an uptrend rather than a reversal.
If buyers regain strength and push BTC’s price above $78,000, the next leg higher could unfold.
What Analysts Are Saying
In the meantime, analysts have warned that the Bitcoin quiet phase may not last.
New data from CryptoQuant analyst BorisD suggests a major price move is building, with the market hovering near key levels around $80,000.
Further, he describes the current market as a “calm before the storm.”
Based on the chart, volatility has dropped, reaching levels not seen since 2023. Historically, such periods of low activity tend to precede large price swings.
In fact, a similar setup once led to a 300% rally.
“The $78,000–$80,000 zone is the key battlefield. Heavy positioning and liquidity sit here, meaning a breakout requires real momentum. Otherwise, this area could act as a local top,” The analyst noted.
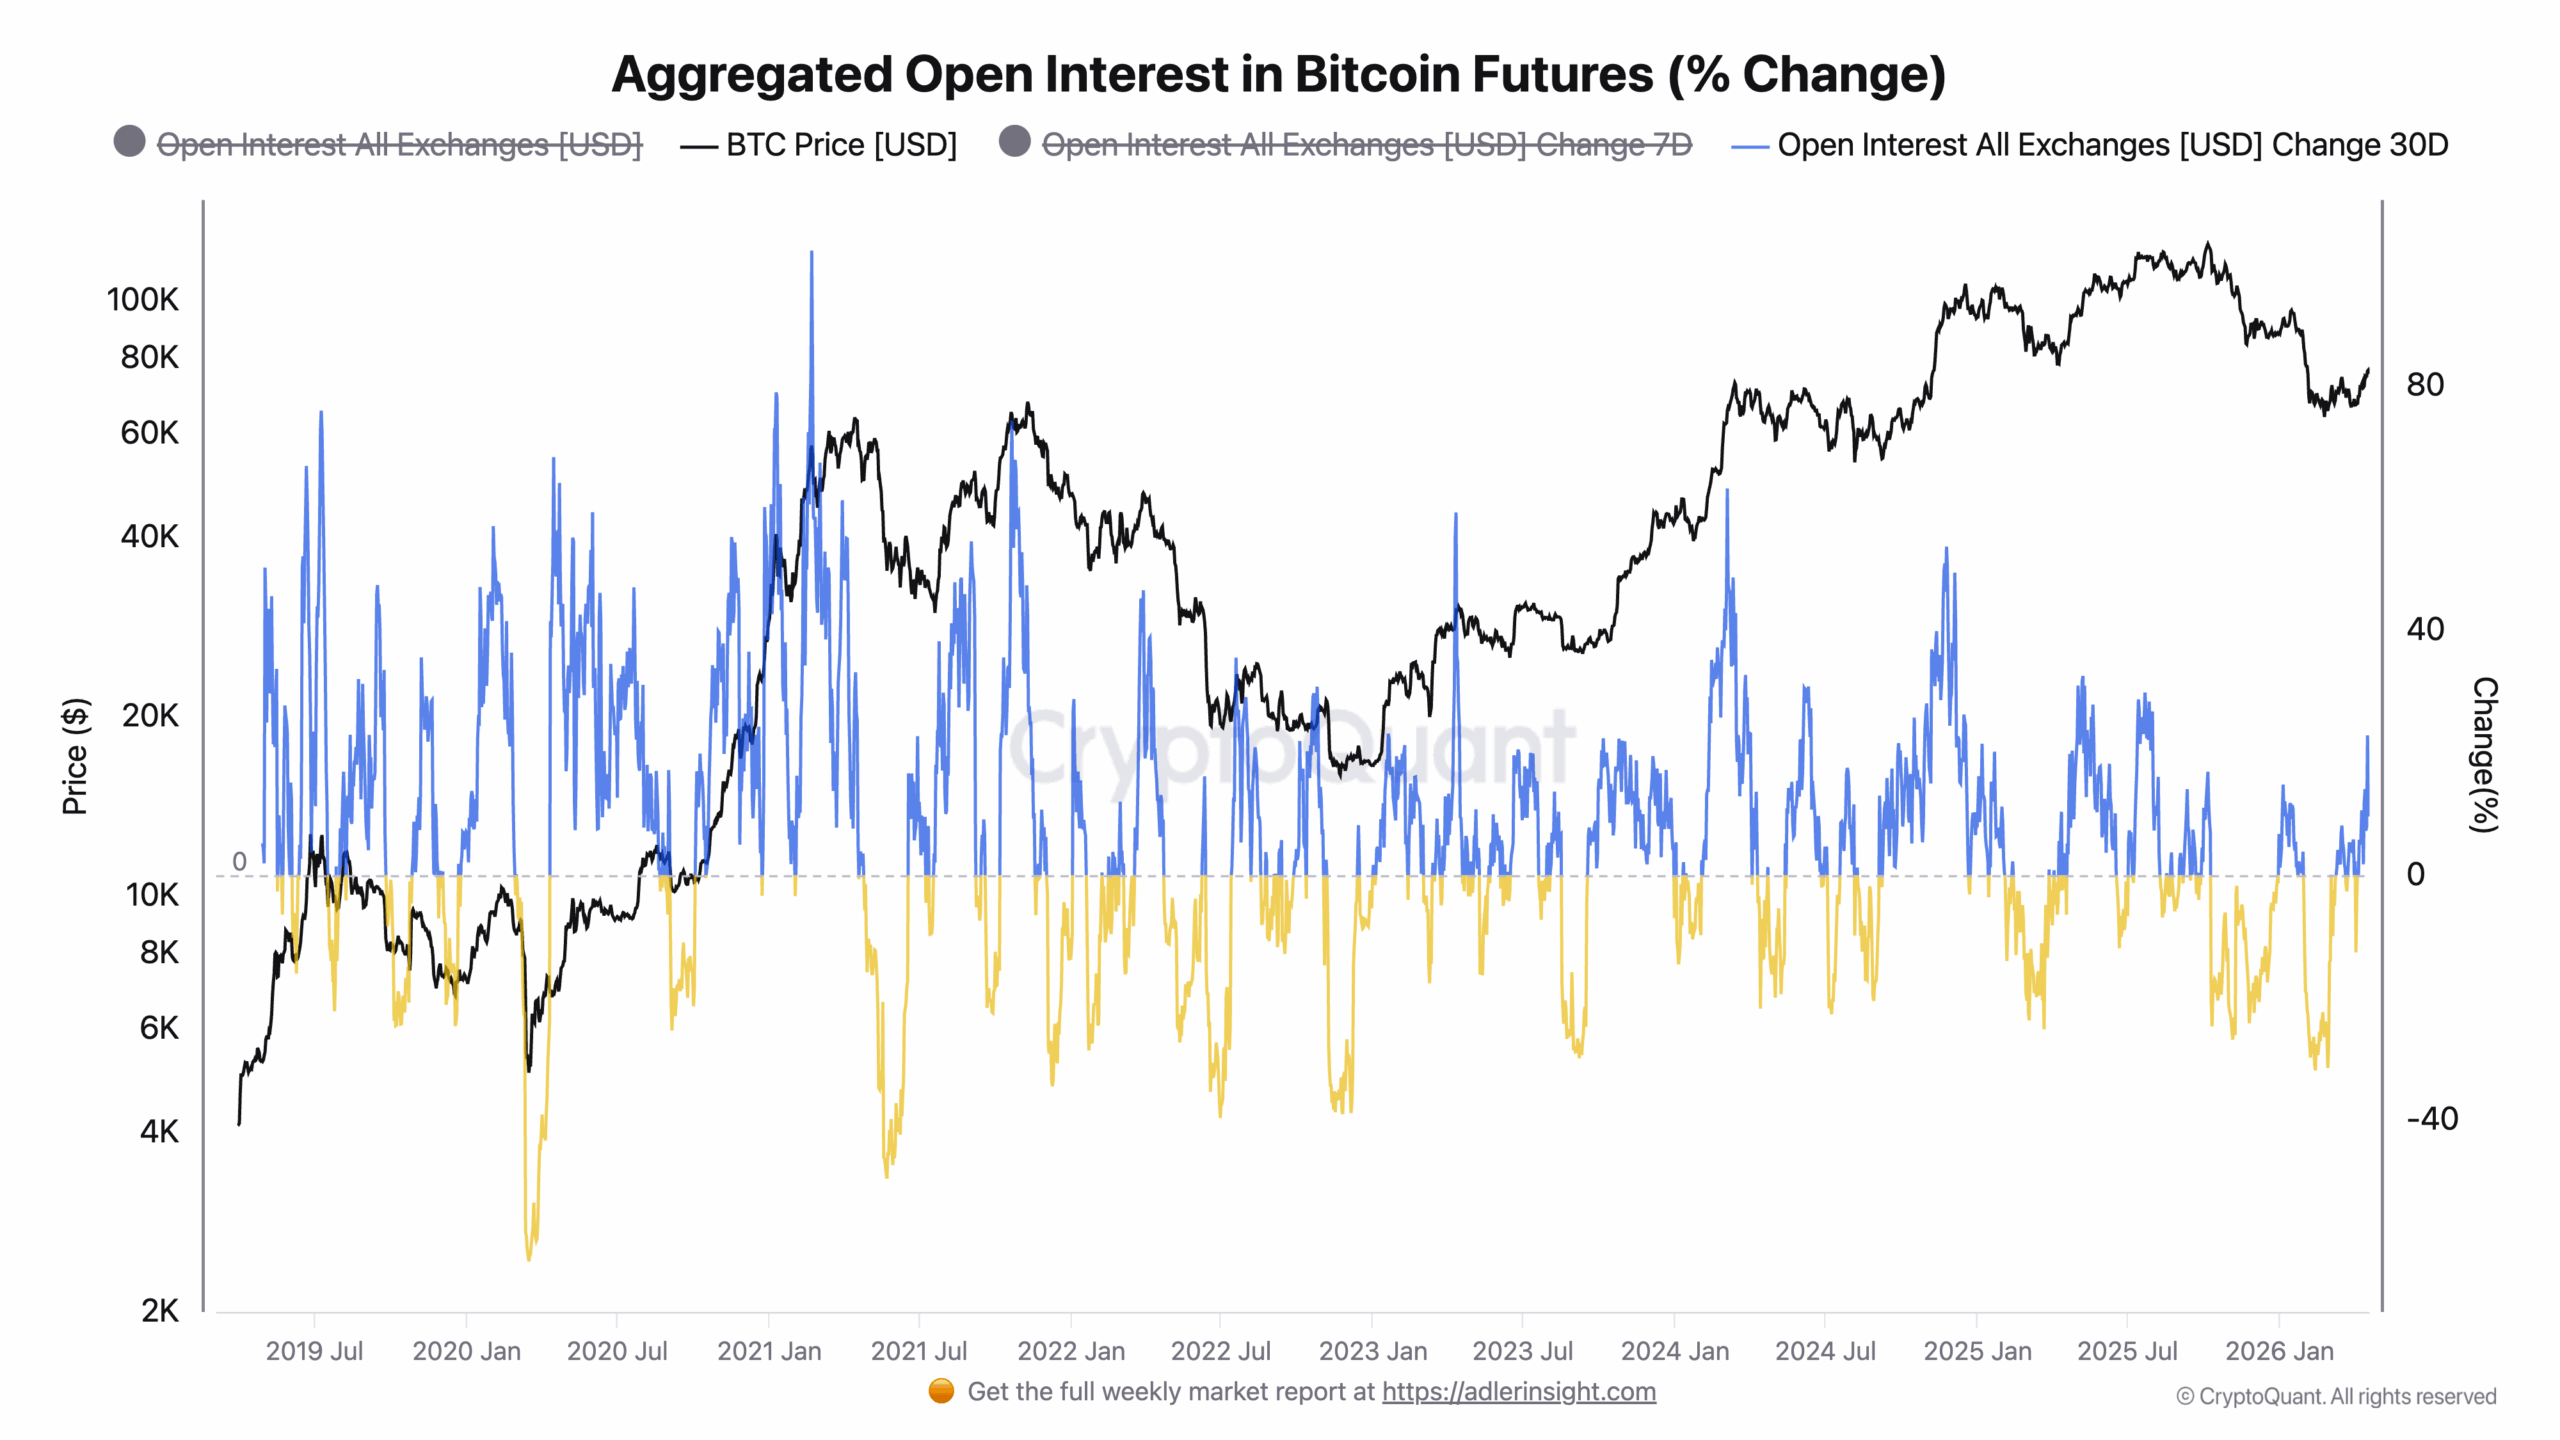
That matters because open interest is not just a sentiment gauge. It is a measure of leverage and crowding.
When aggregate open interest rises, more capital and more risk enter the derivatives market.
As the CryptoQuant analyst explains in its Bitcoin derivatives documentation, rising open interest usually indicates greater liquidity, higher volatility, and increased attention in futures trading.
Aggregated Open Interest in Bitcoin Futures | Credit: CryptoQuant
Therefore, if Bitcoin’s price resumes breaking higher, that build-up can fuel a faster, larger move.
Volatility Provides More Context
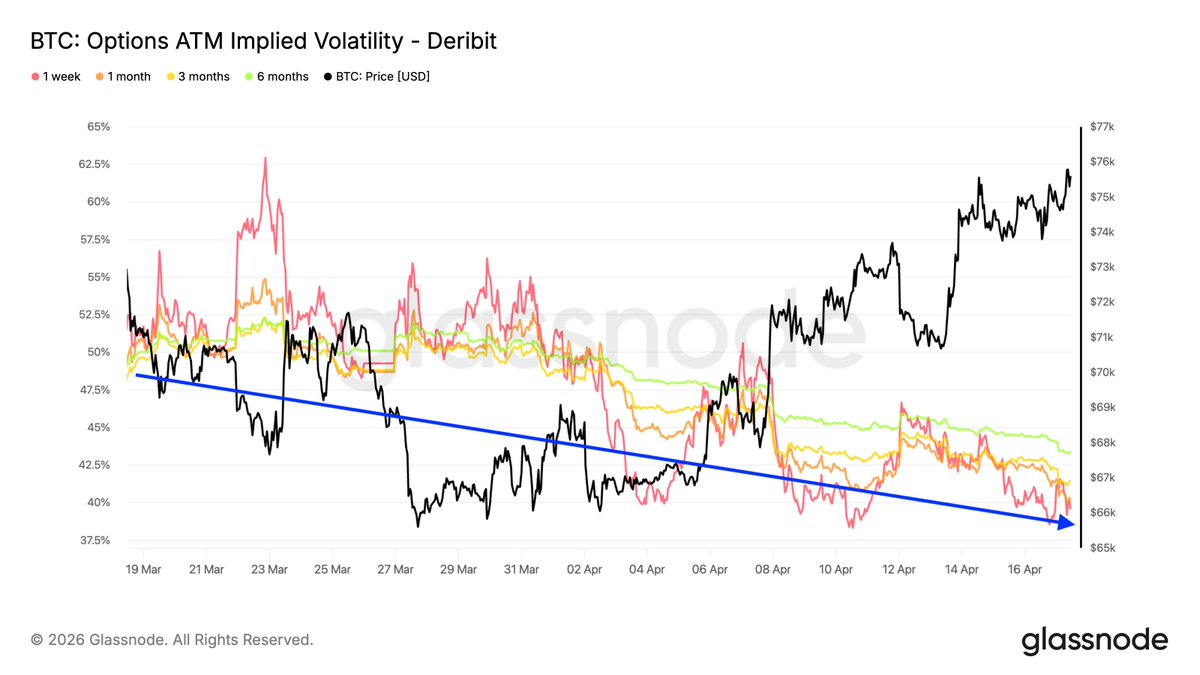
Besides that, BTC has been pushing higher while Implied Volatility (IV) has been compressing, signaling a controlled, low-panic rally rather than an overheated move.
The drop in short-term IV shows traders weren’t expecting downside, allowing Bitcoin’s price to grind up toward $76,000.
However, this compression also means the market has been underpricing large moves.
But if IV starts expanding again, that shift in expectations could trigger a faster move, either accelerating a breakout above $76,000 or forcing a sharp pullback toward the $ 68,000 region.
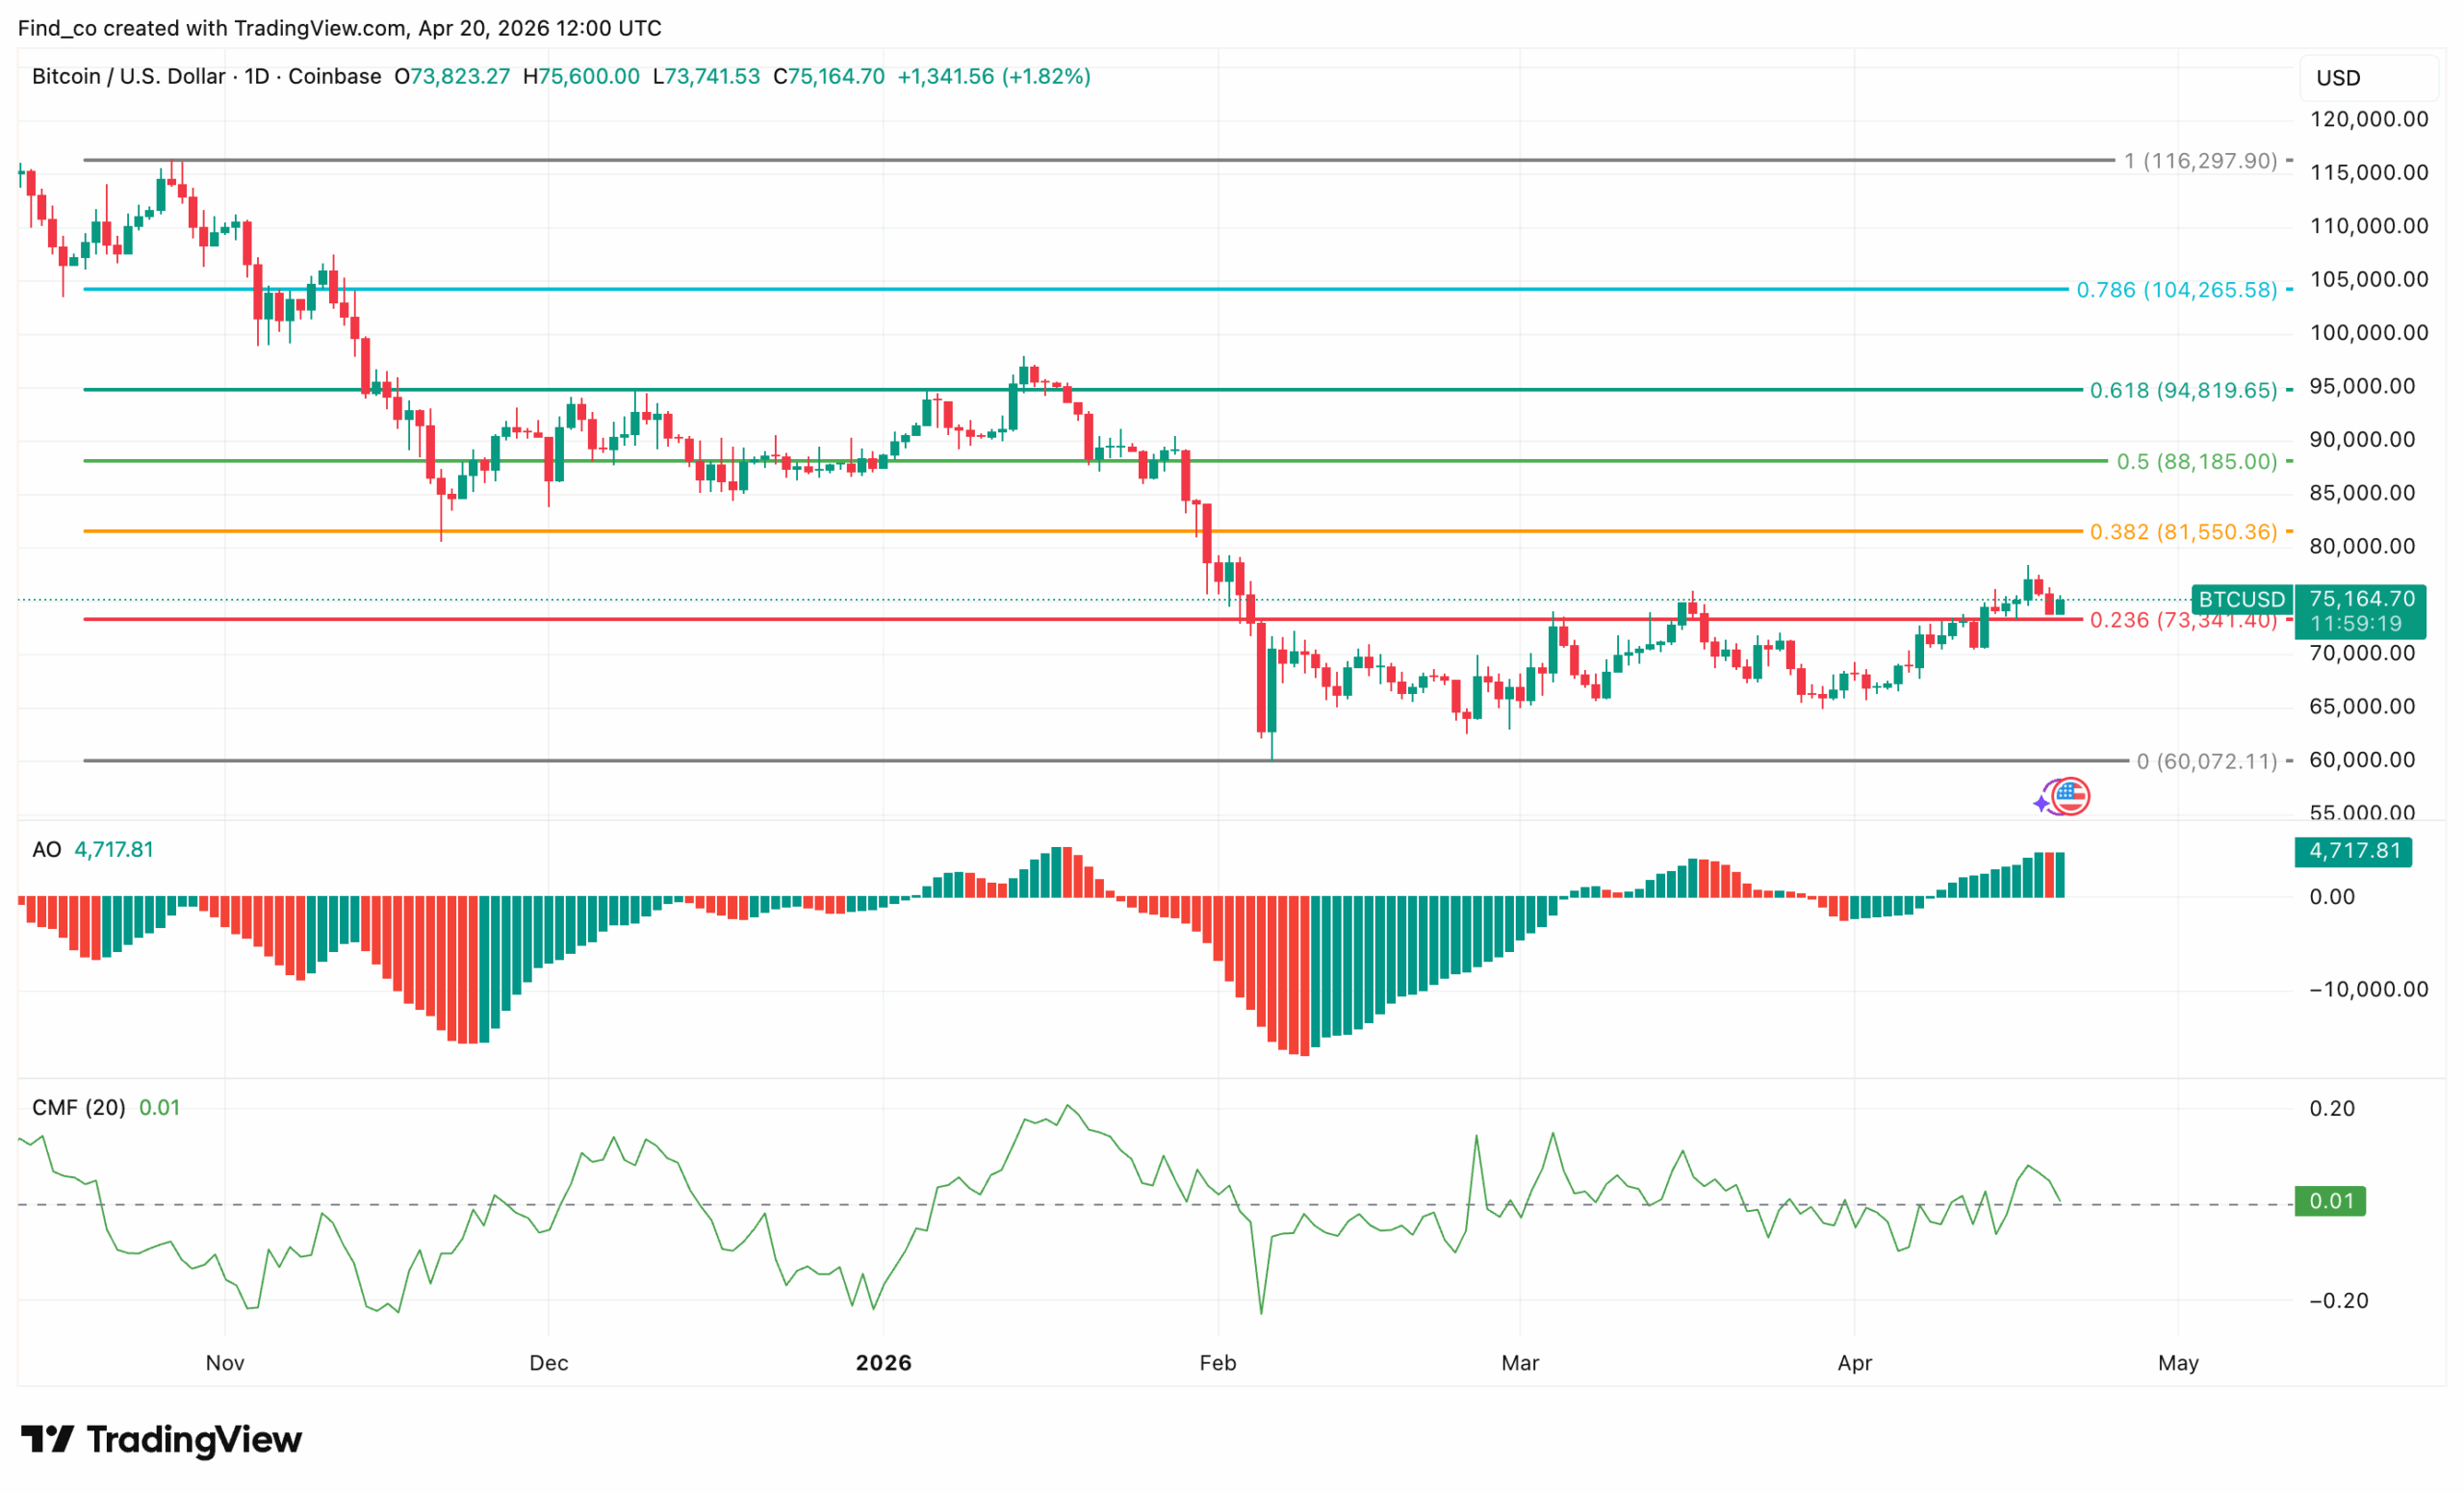
BTC Price Analysis: Coin Stabilizes
Technically, BTC is attempting to stabilize after a sharp multi-week decline, with the price now reclaiming ground near $75,000.
The daily structure, however, still leans bearish, as lower highs continue to define the broader trend.
Price recently bounced from the $59,700 support, marking a strong reaction zone and preventing further downside extension.
Notably, momentum is beginning to shift. The Awesome Oscillator (AO) has flipped positive, signaling growing bullish pressure.
At the same time, the Chaikin Money Flow (CMF) hovers slightly above zero, suggesting mild capital inflows are returning. However, conviction remains limited.
Crucially, Bitcoin is now pressing against the $76,000 resistance, which aligns with a previous breakdown level.
Disclaimer:
The information provided in this article is for informational purposes only. It is not intended to be, nor should it be construed as, financial advice. We do not make any warranties regarding the completeness, reliability, or accuracy of this information. All investments involve risk, and past performance does not guarantee future results. We recommend consulting a financial advisor before making any investment decisions.
Victor Olanrewaju is a crypto analyst and reporter at CCN with deep roots in on-chain research and technical analysis. His crypto journey began in 2017, but it was the 2020 Uniswap airdrop that sparked a full-time pivot into the space.
With a foundation in copywriting, Victor honed his craft creating high-converting content for leading crypto brokers — most notably an XRP price prediction that ranked #1 on Google during the 2021 bull run.
He later joined AMBCrypto in 2022, where he combined storytelling with technical and on-chain analysis to cover key market narratives.
In 2024, he expanded his expertise at BeInCrypto, collaborating with analysts and using tools like Glassnode, Santiment, and IntoTheBlock to break down Bitcoin and altcoin trends.
At CCN, Victor covers the top cryptocurrencies, memecoins, macro shifts, blending real-time insights with deep-dive metrics.
He holds a Bachelor’s degree in Physics from the University of Ibadan, equipping him to simplify complex data for a wide audience. Follow his work or connect on LinkedIn or X.