Bitcoin at Capitulation? 11 Signals Flash ‘Best Buying Opportunity’ Since 2022
Share
Key Takeaways
Bitcoin reclaimed $80,000 for the first time since January 31, hitting an intraday high of $80,625 despite the US launching Project Freedom on Monday. This is a sign that risk appetite is holding firm even as the Iran conflict re-escalates.
Derivatives flow supports the breakout, with Binance recording $1.98 billion in taker buys while Coinbase’s premium highs and $1.97 billion ETF inflows point to strong US demand.
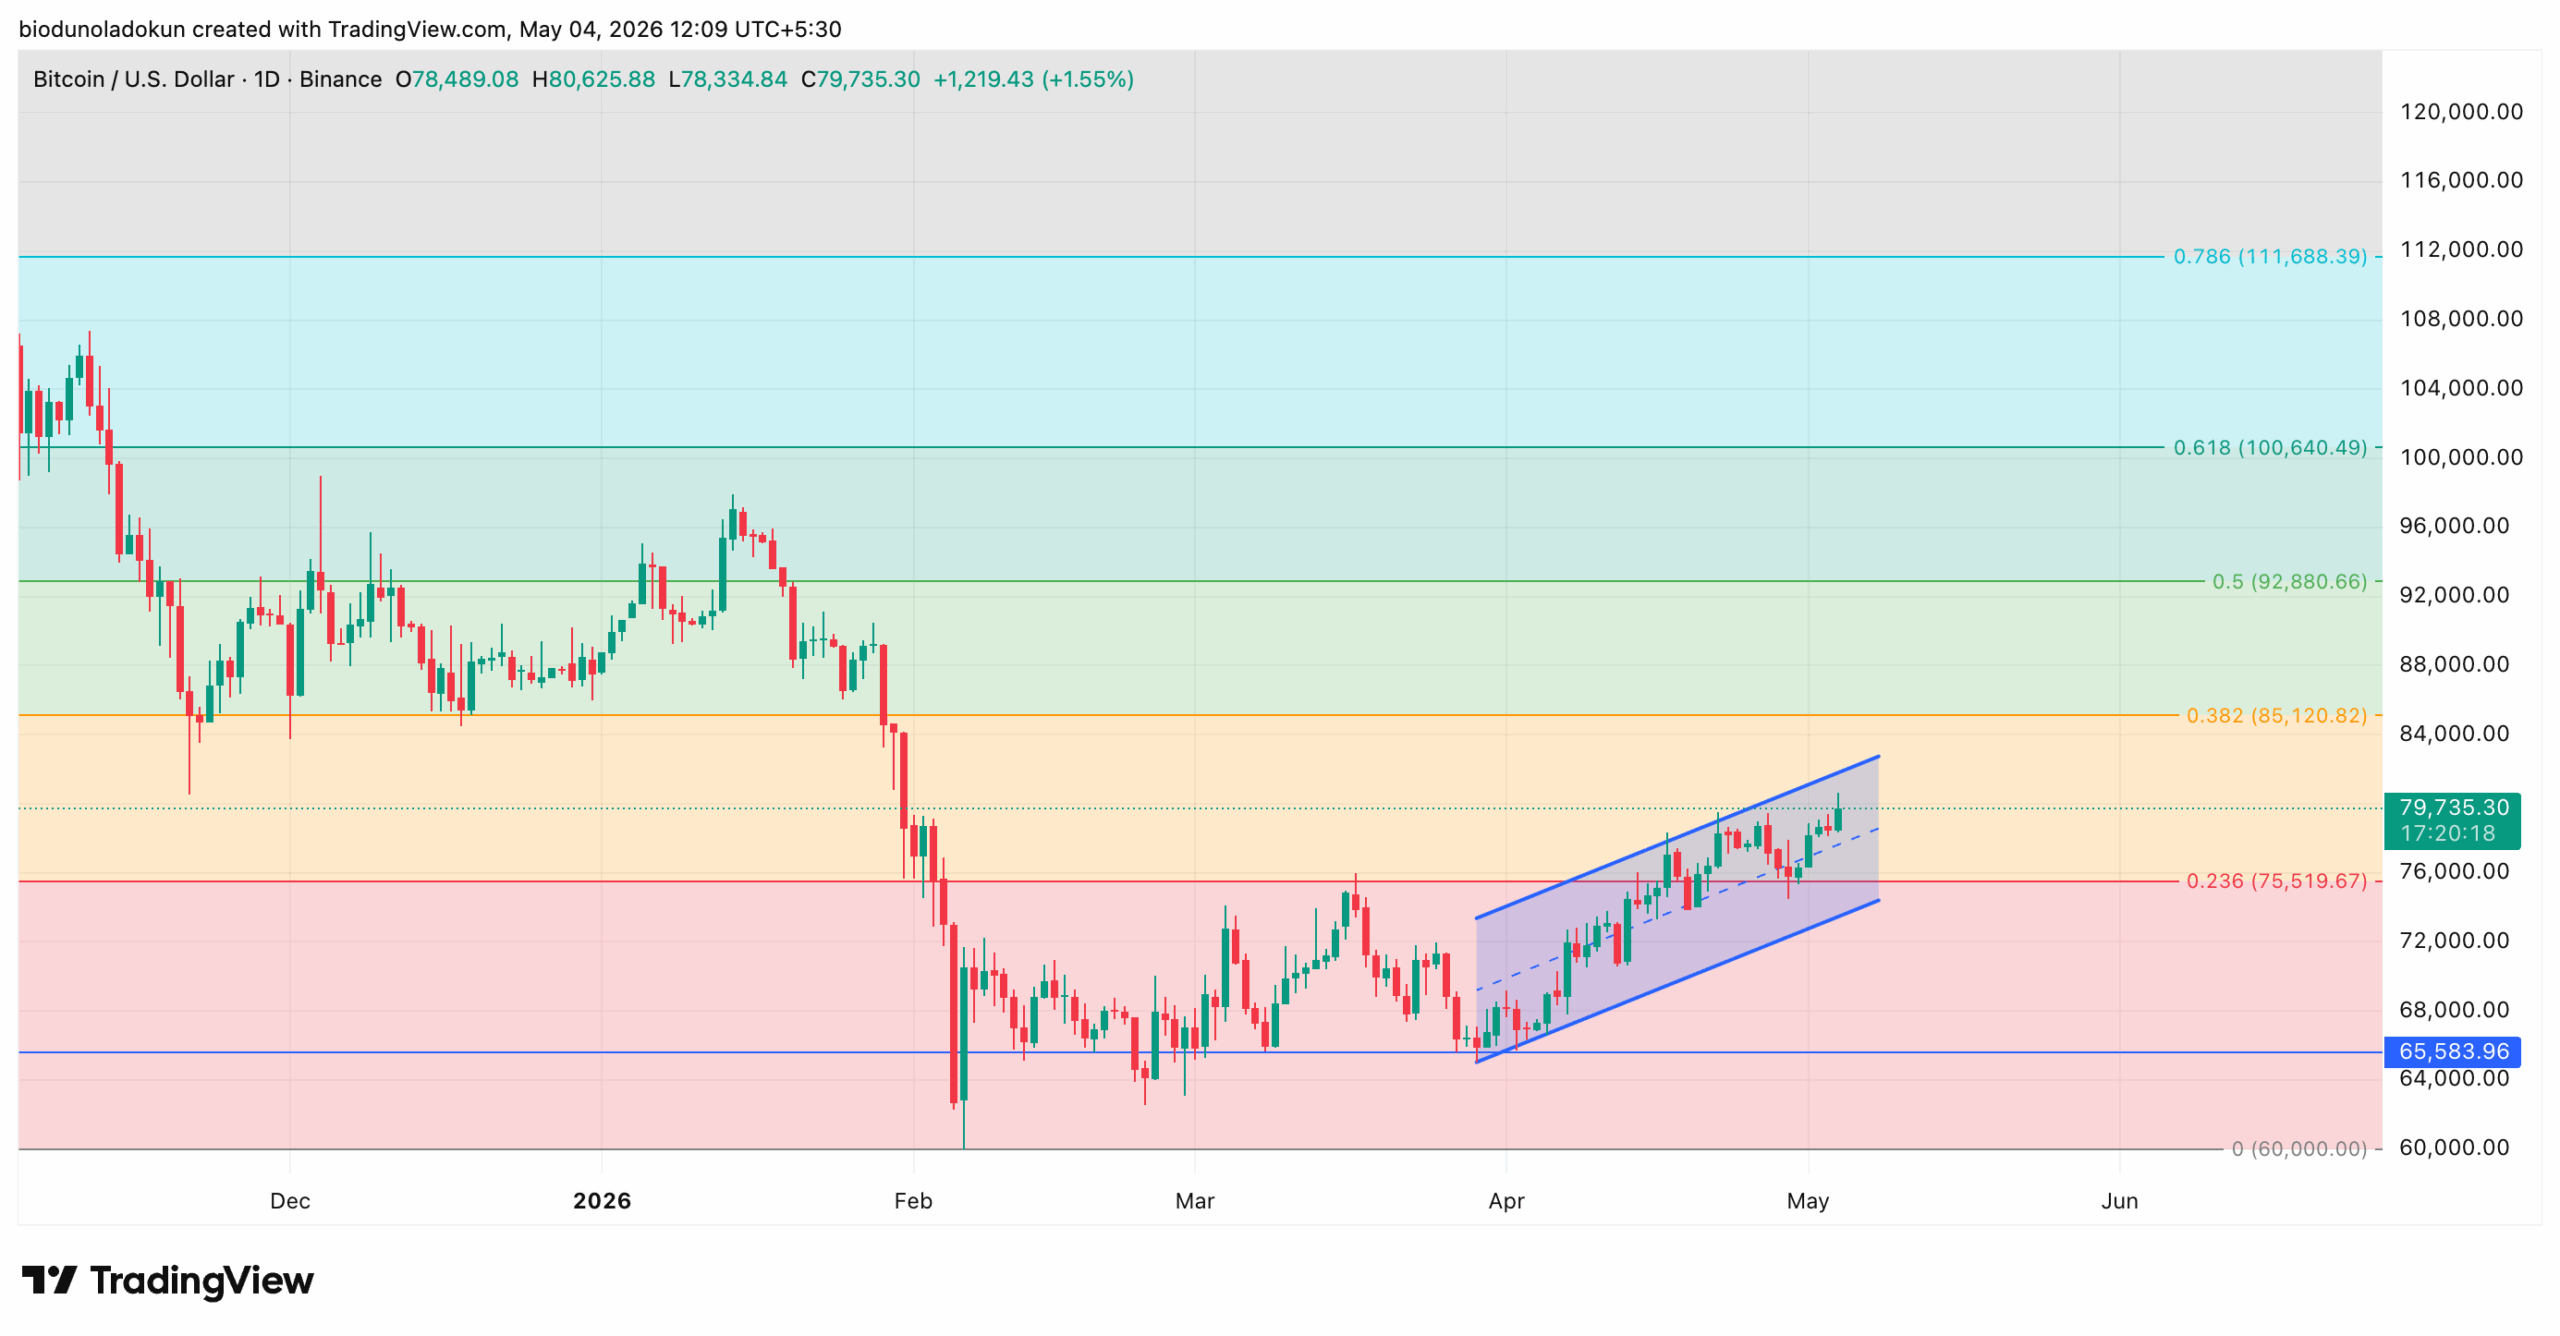
BTC trades inside an ascending channel with the next upside target at $85,120; a daily close below $75,519 would invalidate the bullish thesis and expose the $70,000 zone.
Bitcoin (BTC) has opened the trading week above $80,000 for the first time since the end of January.
Up 2% over the past day, the asset printed an intraday high of $80,625 during Monday’s early morning Asia session, its highest level since Jan. 31.
This comes amid renewed tensions between the US. and Iran after the United States launched Project Freedom on Monday — a Navy-led mission to escort stranded commercial ships out of the Strait of Hormuz, which has been blockaded since April 13.
With a sharp improvement in risk sentiment across global markets today, on-chain data suggest the rally still has more room to run.
Sponsored
Disclosure
We sometimes use affiliate links in our content, when clicking on those we might receive a commission at no extra cost to you. By using this website you agree to our terms and conditions and privacy policy.
The surge above $80,000 has driven a sharp shift in positioning among BTC derivatives traders.
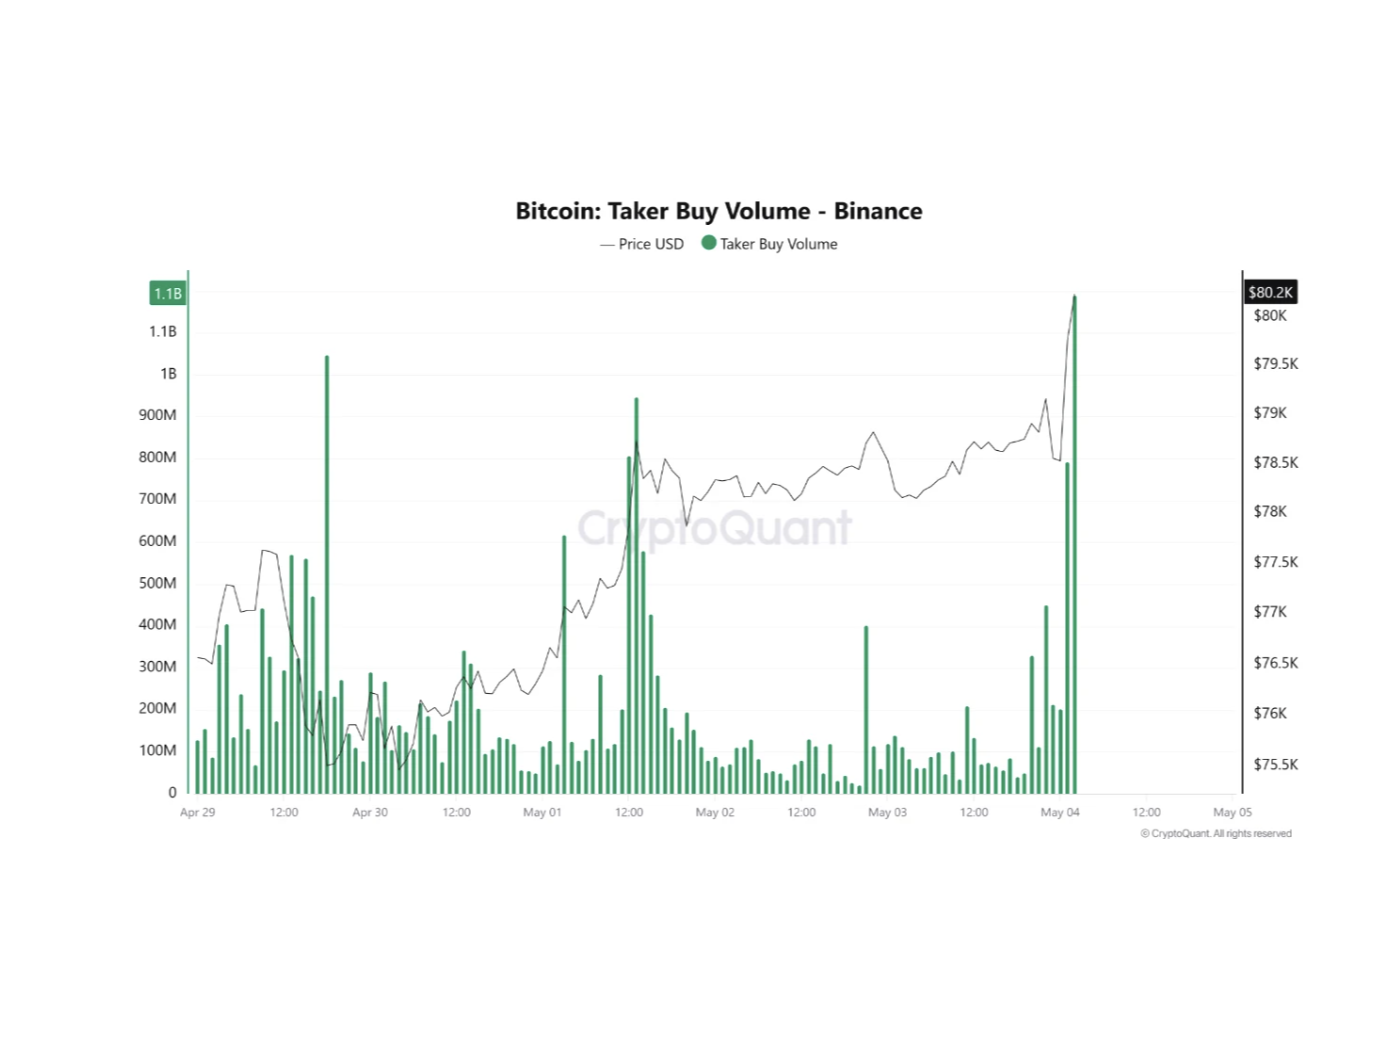
In a new report, CryptoQuant analyst Amr Taha noted a rise in taker buy activity on Binance that coincided almost exactly with the break above $80,000.
According to Taha:
“Bitcoin recorded two consecutive large hourly buy-volume spikes of approximately $1.19 billion and $792 million, bringing the combined two-hour taker buy volume to around $1.98 billion.”
The Taker Buy Volume metric measures the total volume of buy orders filled by takers within a period.
When it spikes, it means buyers are stepping in aggressively at market price, a sign of strong demand.
“When this type of volume appears near a major breakout level, it often shows that traders are not waiting for a pullback; instead, they are chasing confirmation as the price moves higher,” the analyst noted.
While noting that BTC’s strong taker-buy surge can support continued bullish momentum, it could be “vulnerable to a short-term pullback” if its price fails to hold above $80,000
US Investors are Leading the Bid
On-chain data has shown a clear uptick in US-investor participation, another bullish signal hinting at a sustained rally through $85,000.
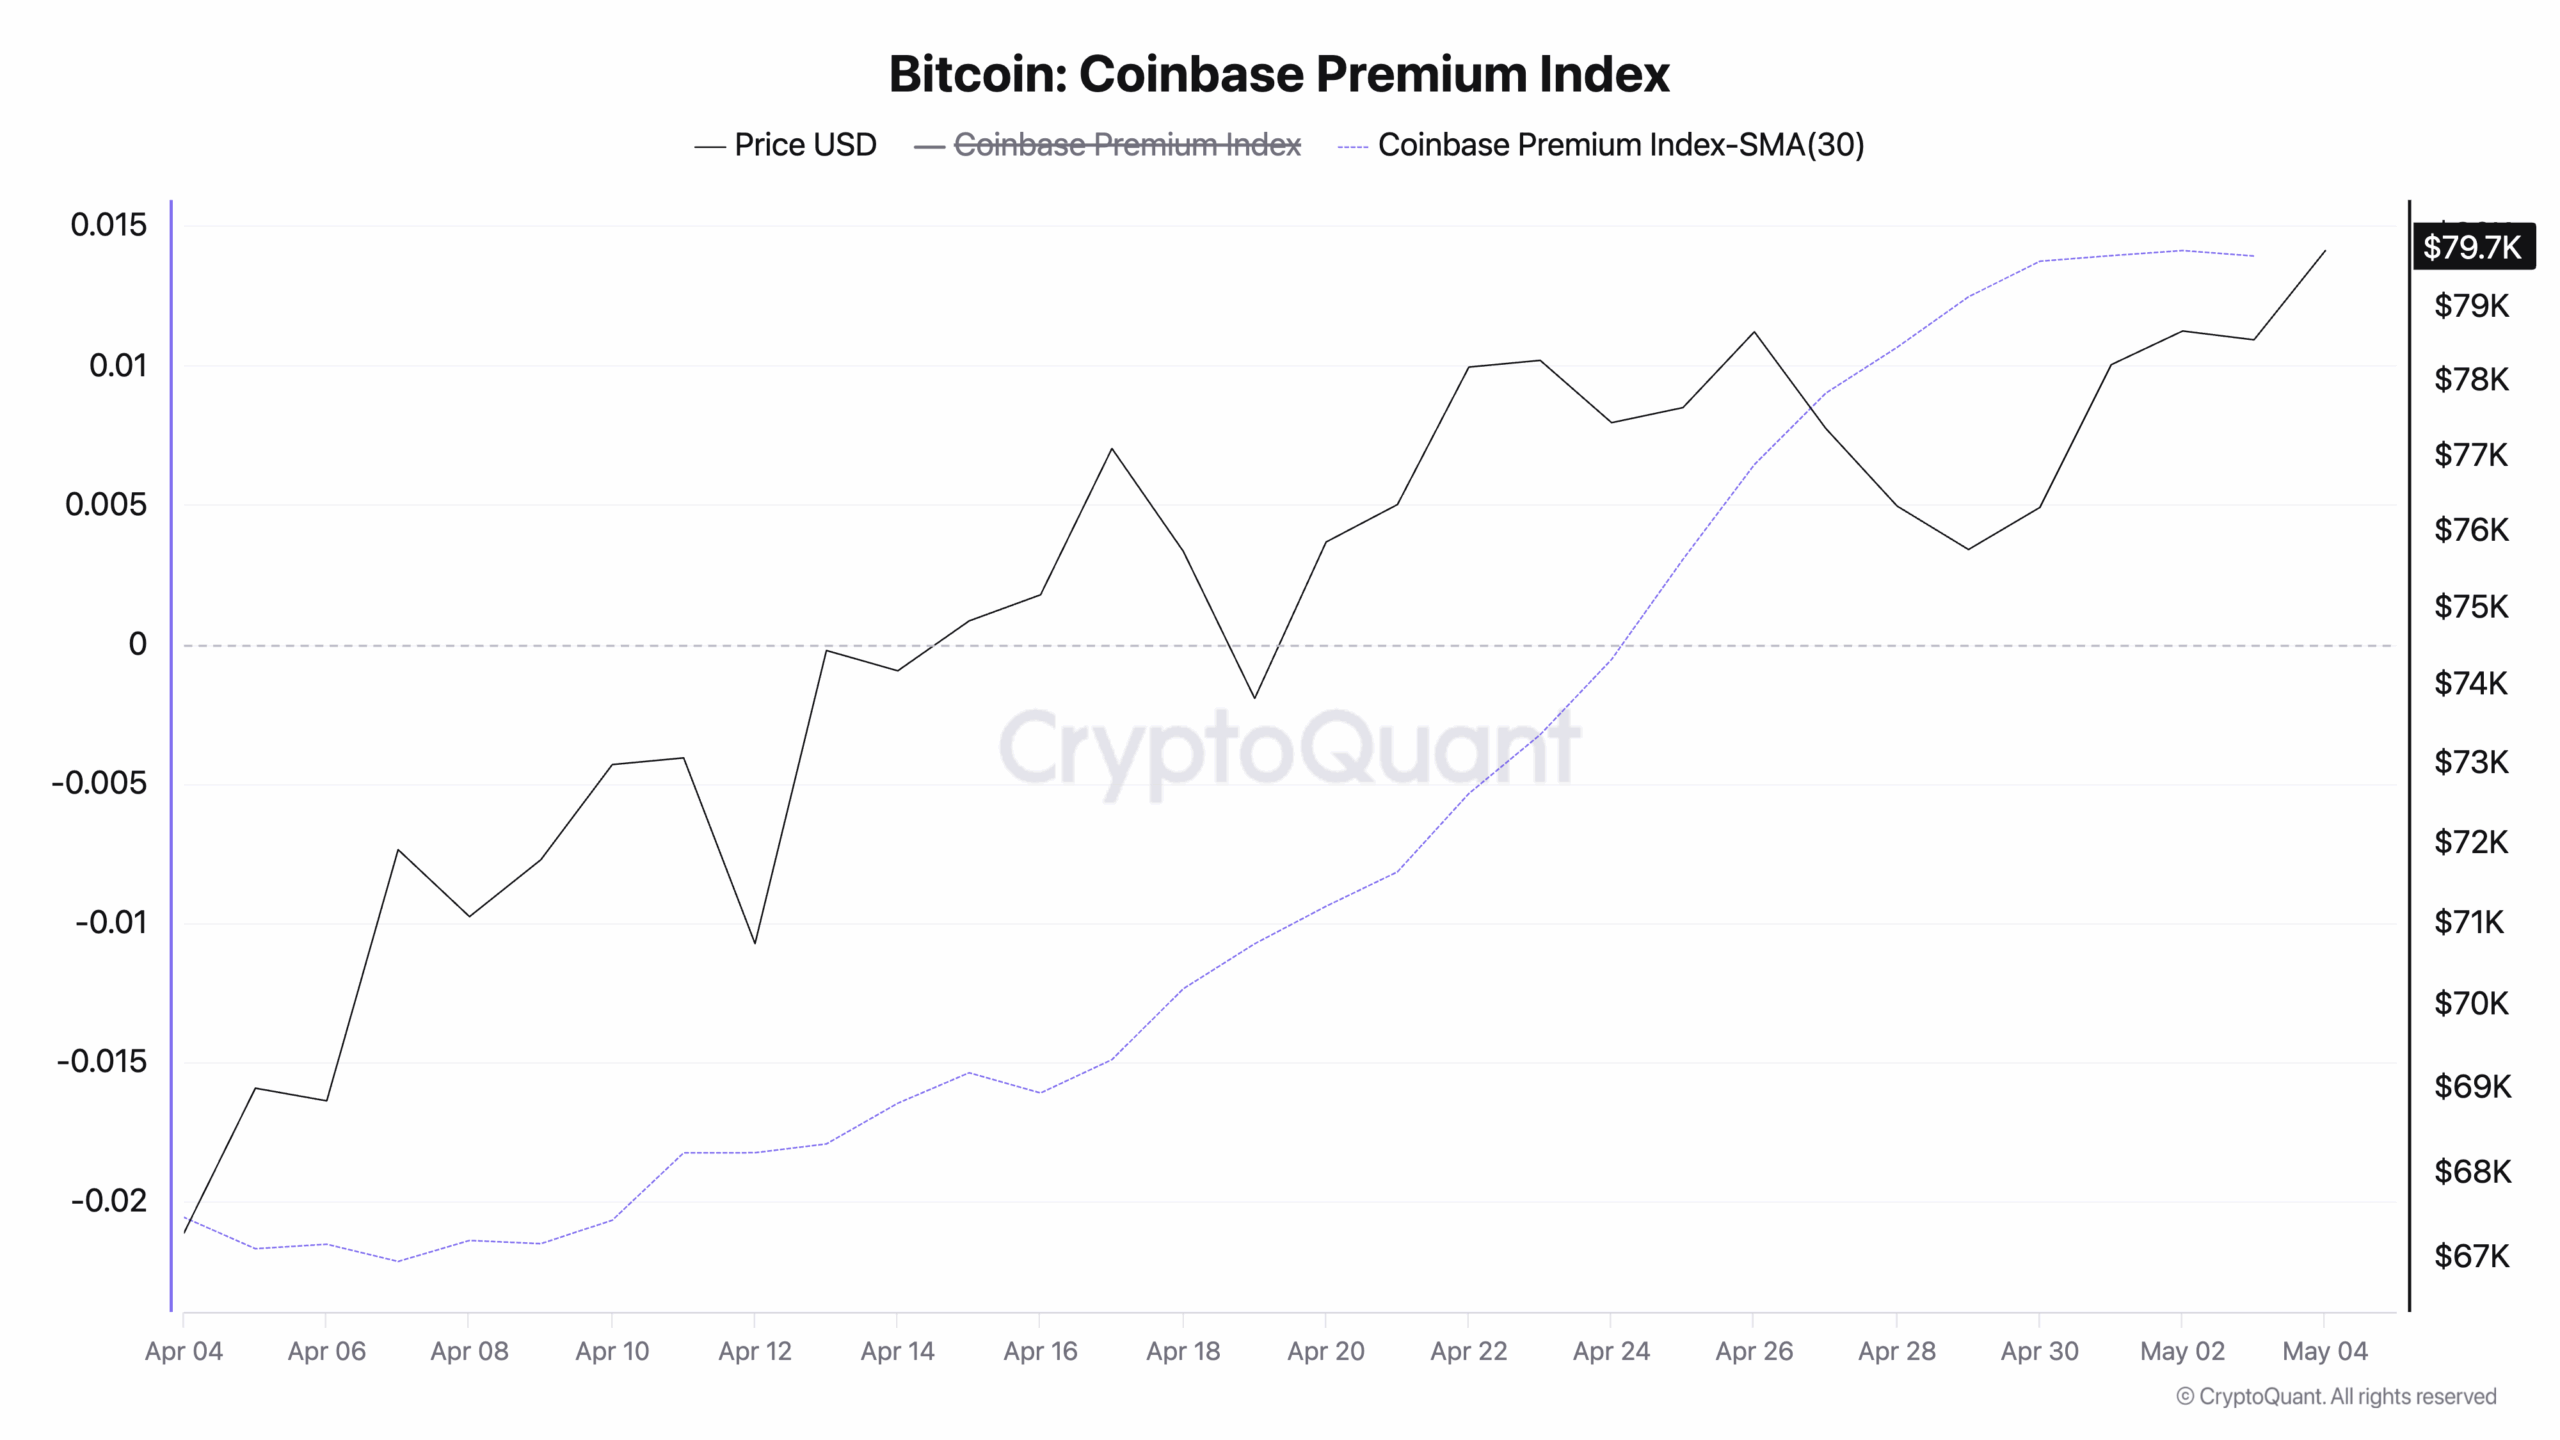
CCN’s assessment of BTC’s Coinbase Premium Index (CPI) — using a 30-day simple moving average — shows the metric at a 30-day high of 0.0139 at press time, confirming strong demand from US buyers.
Bitcoin Coinbase Premium Index | Credit: CryptoQuant
The CPI metric measures the difference between BTC prices on Coinbase and Binance and is a good indicator of US investor sentiment.
When the CPI falls—or, worse, turns negative—it signals that demand on Coinbase is lagging global markets due to profit-taking or waning interest among US buyers.
On the other hand, as is currently the case with BTC, when the CPI rises, it trades at a premium on Coinbase compared to international exchanges.
This reflects stronger buying pressure from US-based investors, a pattern known to drive up BTC price.
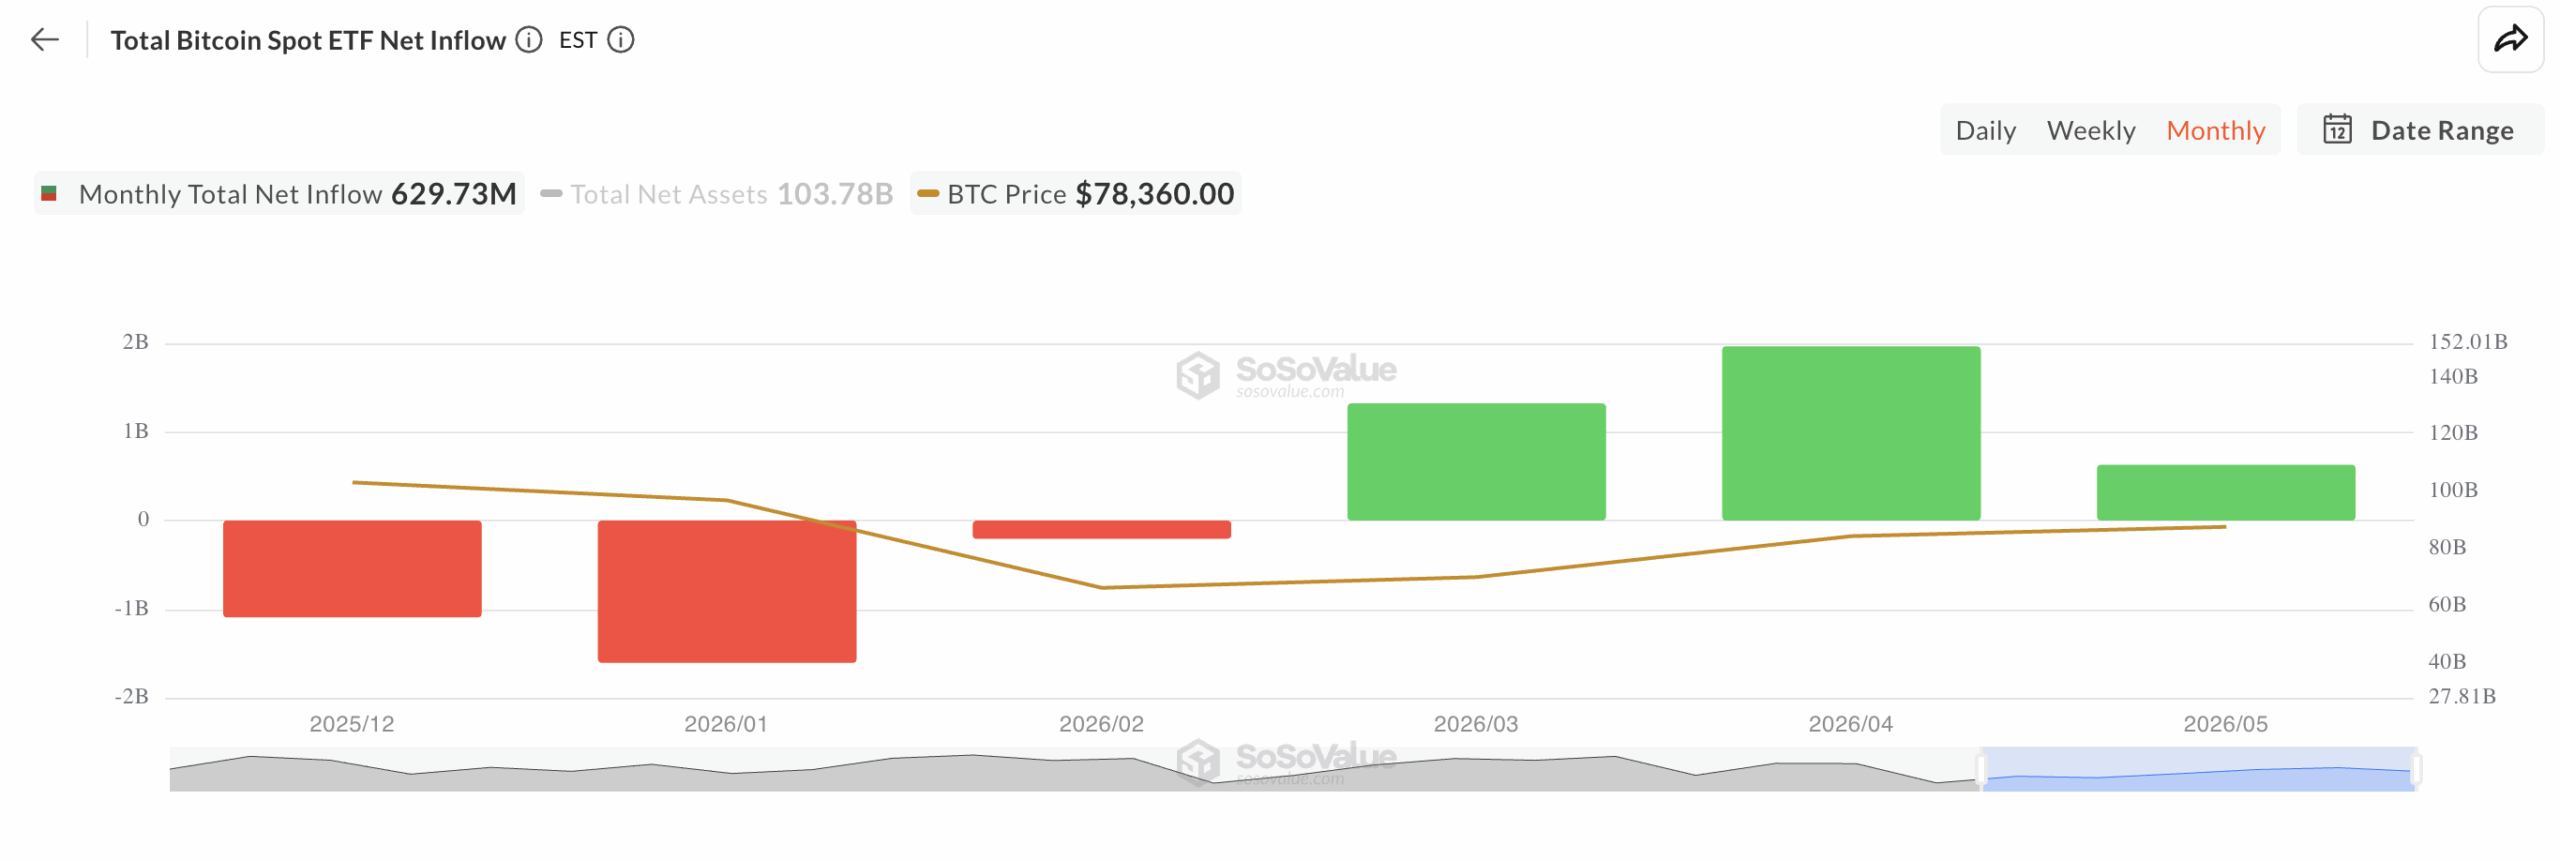
Moreover, the recent spike in spot BTC ETF inflows also confirms bullish sentiment among American investors.
Per SoSoValue, these funds pulled in $1.97 billion in April, the strongest monthly net inflow since the start of the year, confirming that institutional demand is back and accelerating.
Total Bitcoin Spot ETF Net Inflow | Credit: SosoValue
Taken together with the climbing CPI, these inflows show a broad US bid behind the rally, with both retail and institutional capital growing at the same time and pushing prices up.
As of this writing, total net assets across US spot Bitcoin ETFs sit at $103.7 billion.
Daily Chart Structure Holds Bullish
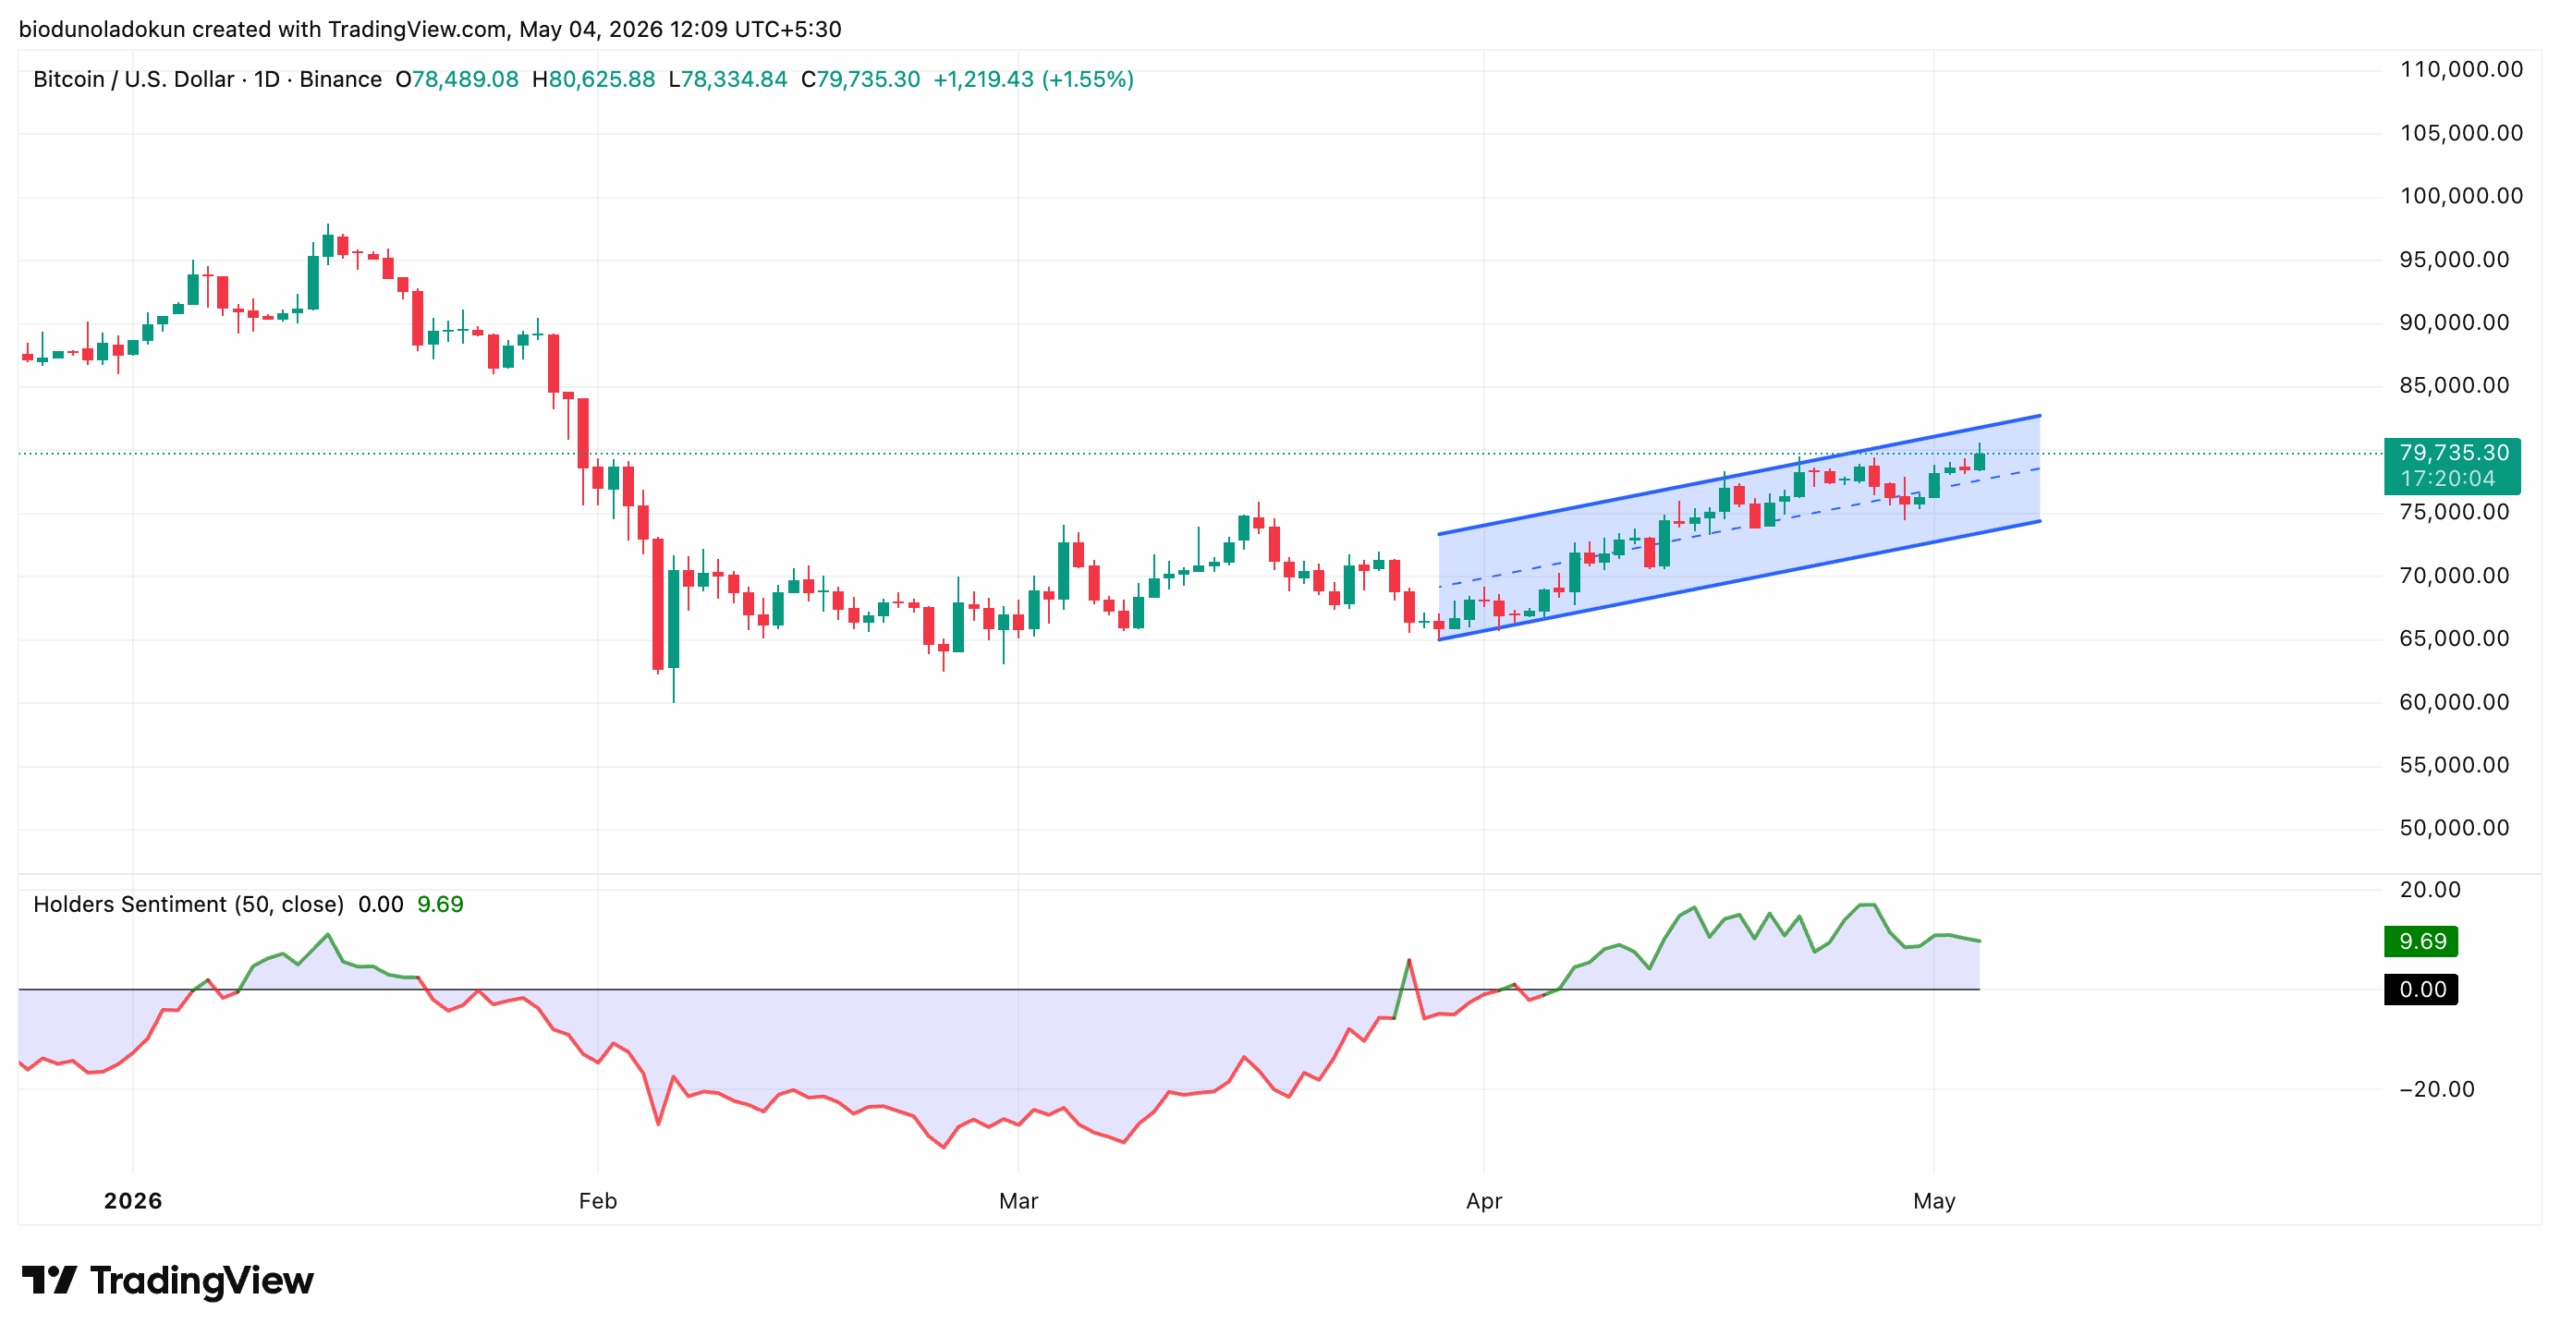
On the daily chart, BTC has traded within an ascending parallel channel since March 29, climbing as the ceasefire talks between the US and Iran in April improved sentiment and pushed the asset’s value higher.
When an asset’s price trades within this channel, it means buyers are stepping in at progressively higher levels while sellers are also accepting higher prices to exit, a sign that demand is outpacing supply on every pullback.
This is mirrored by BTC’s Holder Sentiment.
Readings from the daily chart show that after printing deep negative readings through February and March, the indicator has flipped firmly into positive territory and held there since early April.
The Holder Sentiment indicator tracks how much an asset’s price has changed over time, offering a read on the sentiment of open positions and holders.
When it climbs like this, it signals that the average holder is optimistic about the asset. This typically attracts additional capital inflows, which could sustain BTC’s rally above $80,000.
Path to $85,000 Open?
At press time, BTC trades at $79,735. If demand remains high, the asset could push through the upper trend line of the ascending parallel channel, which forms resistance at $82,737, and attempt to close above it.
If this materializes, BTC could expand its gains toward $85,120.
However, if demand falls and BTC breaks below the channel’s lower trendline and $75,519, the bullish thesis is invalidated.
In that scenario, Bitcoin is exposed to a deeper retest of the $70,000 zone.
Disclaimer:
The information provided in this article is for informational purposes only. It is not intended to be, nor should it be construed as, financial advice. We do not make any warranties regarding the completeness, reliability, or accuracy of this information. All investments involve risk, and past performance does not guarantee future results. We recommend consulting a financial advisor before making any investment decisions.
Abiodun Oladokun is a Research Analyst at CCN, where he covers cryptocurrency markets with a focus on on-chain analysis, technical assessments, and emerging trends across decentralized finance (DeFi), real-world assets (RWA), artificial intelligence (AI), decentralized physical infrastructure networks (DePIN), Layer 2s, and meme coins.
Prior to CCN, he served as a Senior On-Chain Analyst at BeInCrypto, producing market reports spanning diverse crypto sectors.
Before that, he conducted technical analysis and market assessments of various altcoins at AMBCrypto, where he also contributed long-form quarterly research papers on DeFi, NFTs, DAOs, and scaling architectures, leveraging on-chain platforms including Messari, Santiment, DefiLlama, and Dune Analytics.
He began his crypto career as a research analyst at SixthSense DAO, developing blockchain forensic tools to trace the history of stolen assets.
Abiodun is a lawyer called to the Nigerian Bar and the founder of Ilé Ijó, a Lagos-based electronic dance music collective.