Solana price nears $80 as retail demand strengthens despite weak ETF inflows. Here's why the $81.50 resistance could set SOL's next move. | Credit: CCN.com
Share
Key Takeaways
Solana remains weak below the $88 resistance, with low demand and stalled momentum.
Reclaiming $95 looks unlikely in the short term unless buying pressure and ETF inflows return.
Failure to hold current levels could push Solana’s price toward $80 or $76 support
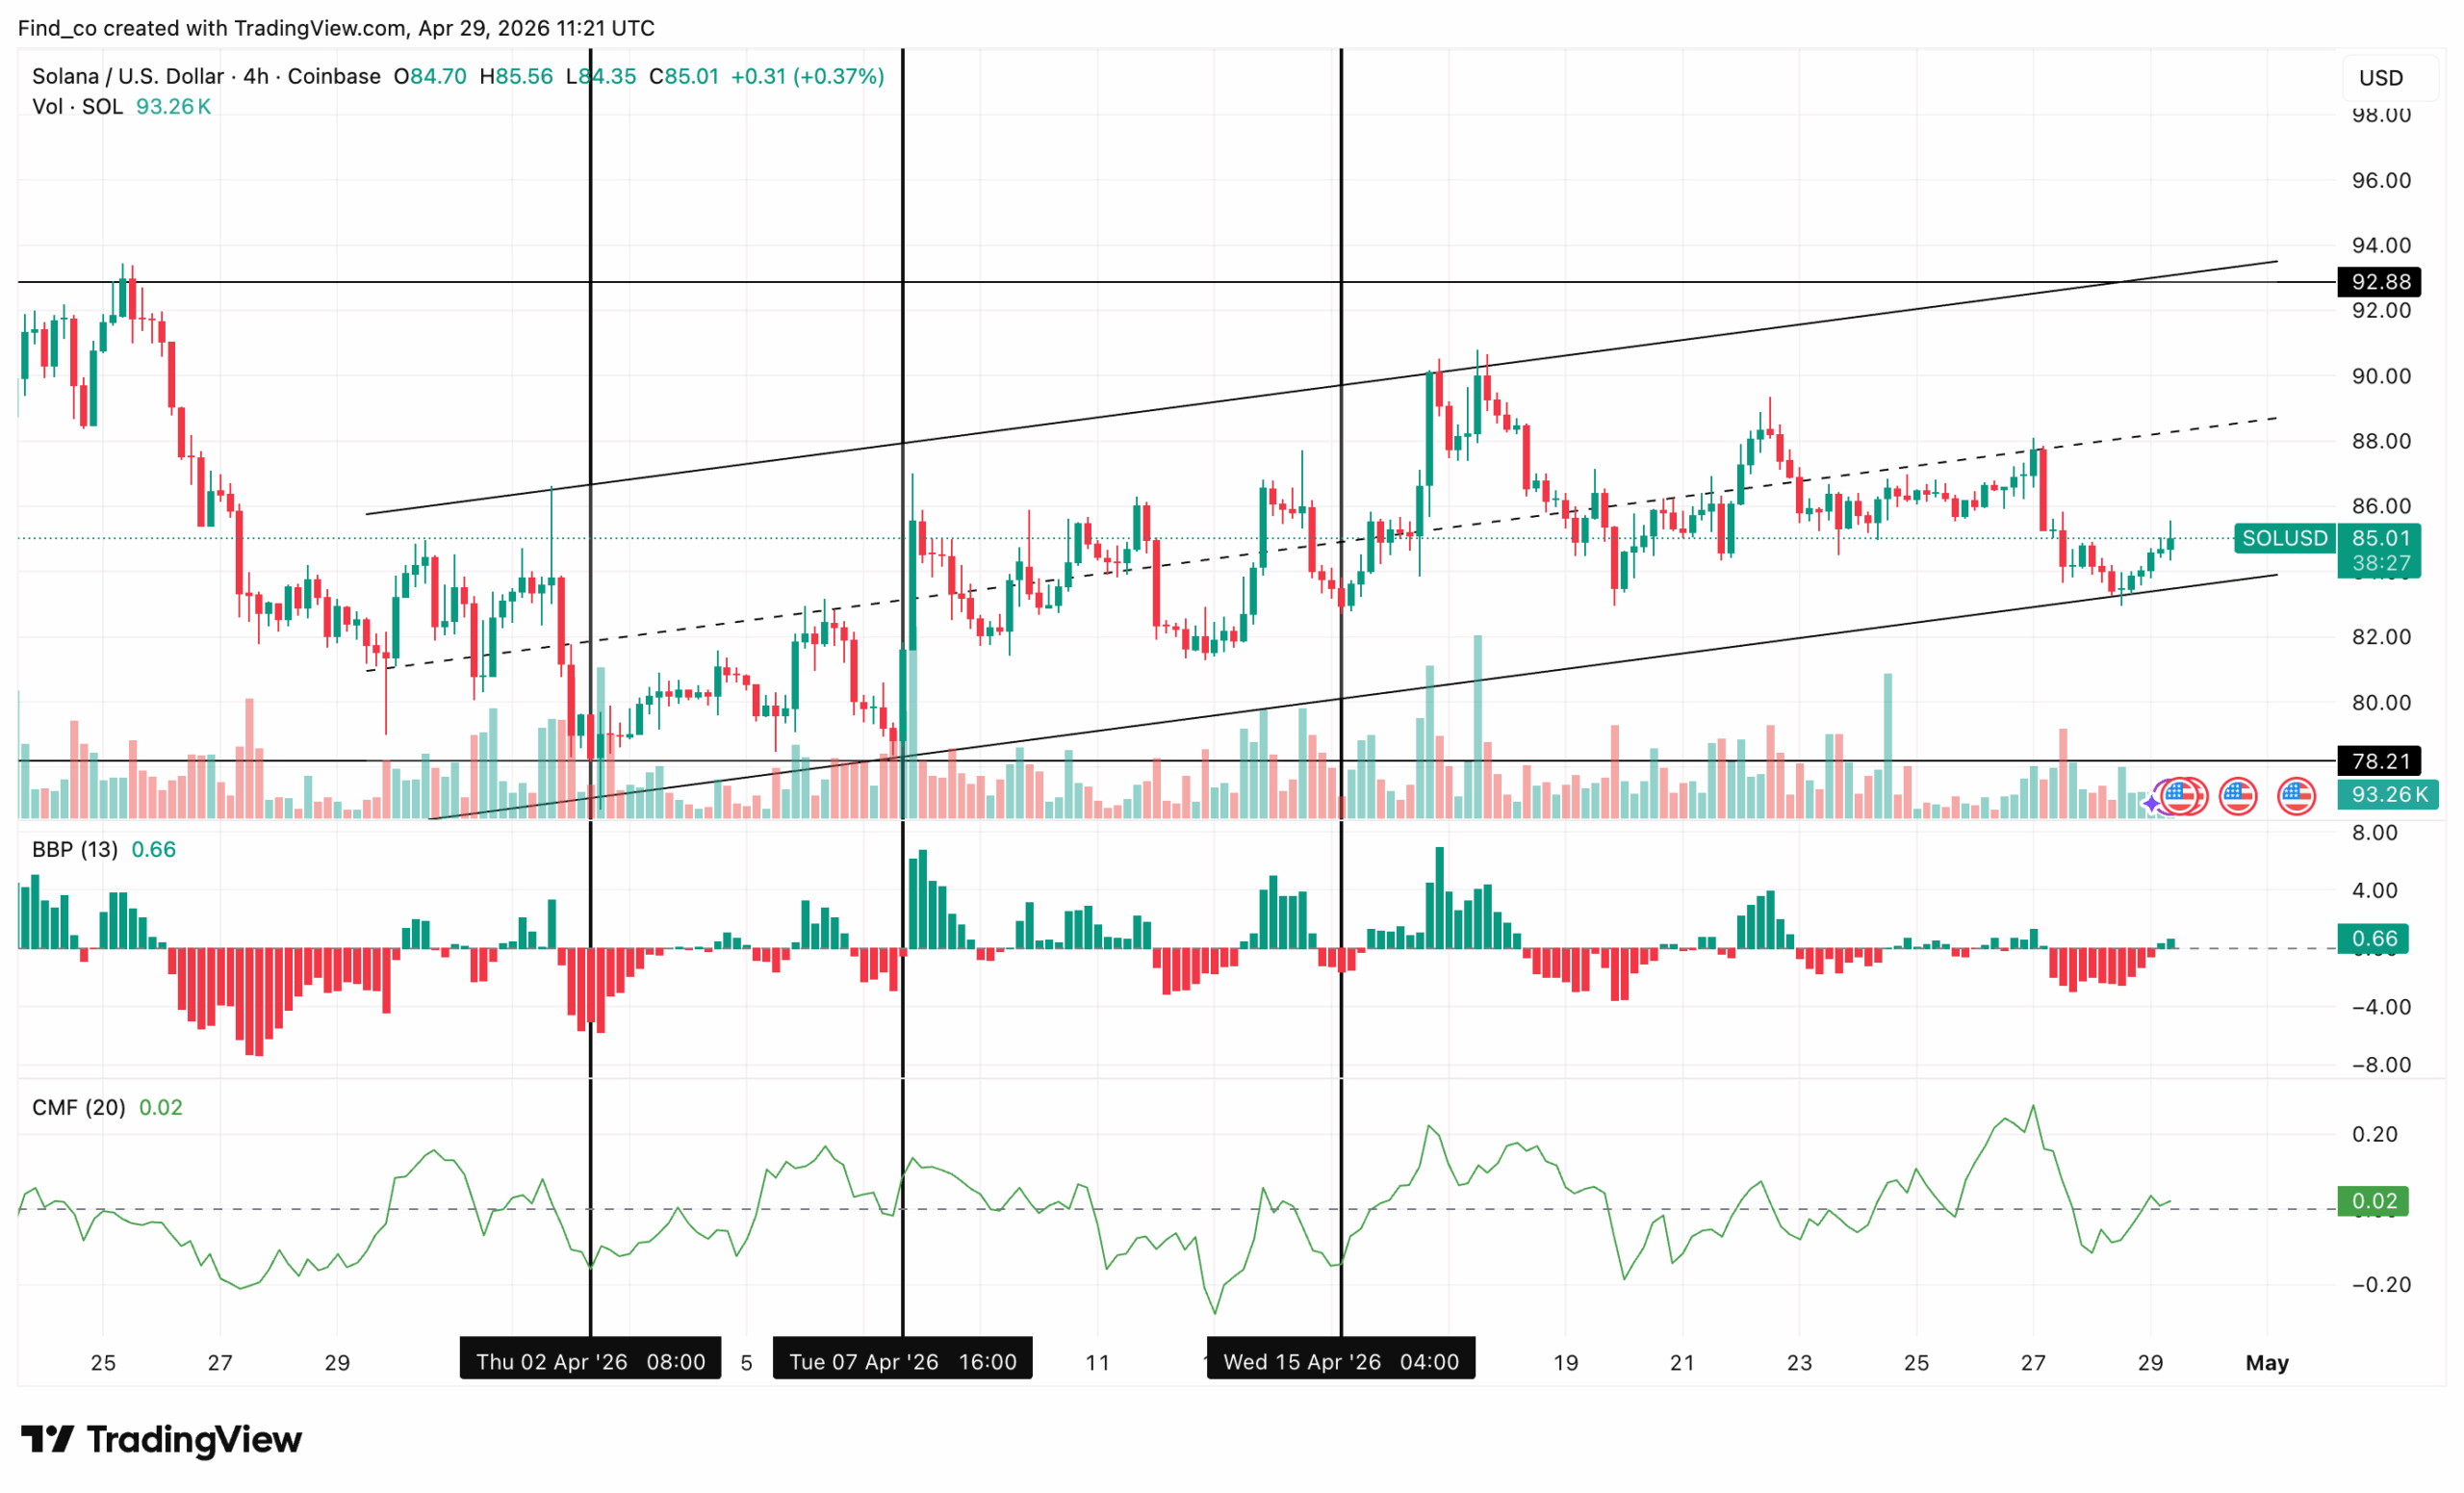
Solana (SOL) is struggling to reclaim the $95 level as weak demand continues to weigh on its price.
The altcoin remains under pressure despite brief recovery attempts, with cooling market participation limiting upside momentum.
If buying interest doesn’t return, Solana could face further difficulty staging a sustained recovery.
Recent rebounds have been weak, and repeated rejections near local resistance suggest buyers remain hesitant.
As a result, upside momentum continues to stall below key supply zones.
Sponsored
Disclosure
We sometimes use affiliate links in our content, when clicking on those we might receive a commission at no extra cost to you. By using this website you agree to our terms and conditions and privacy policy.
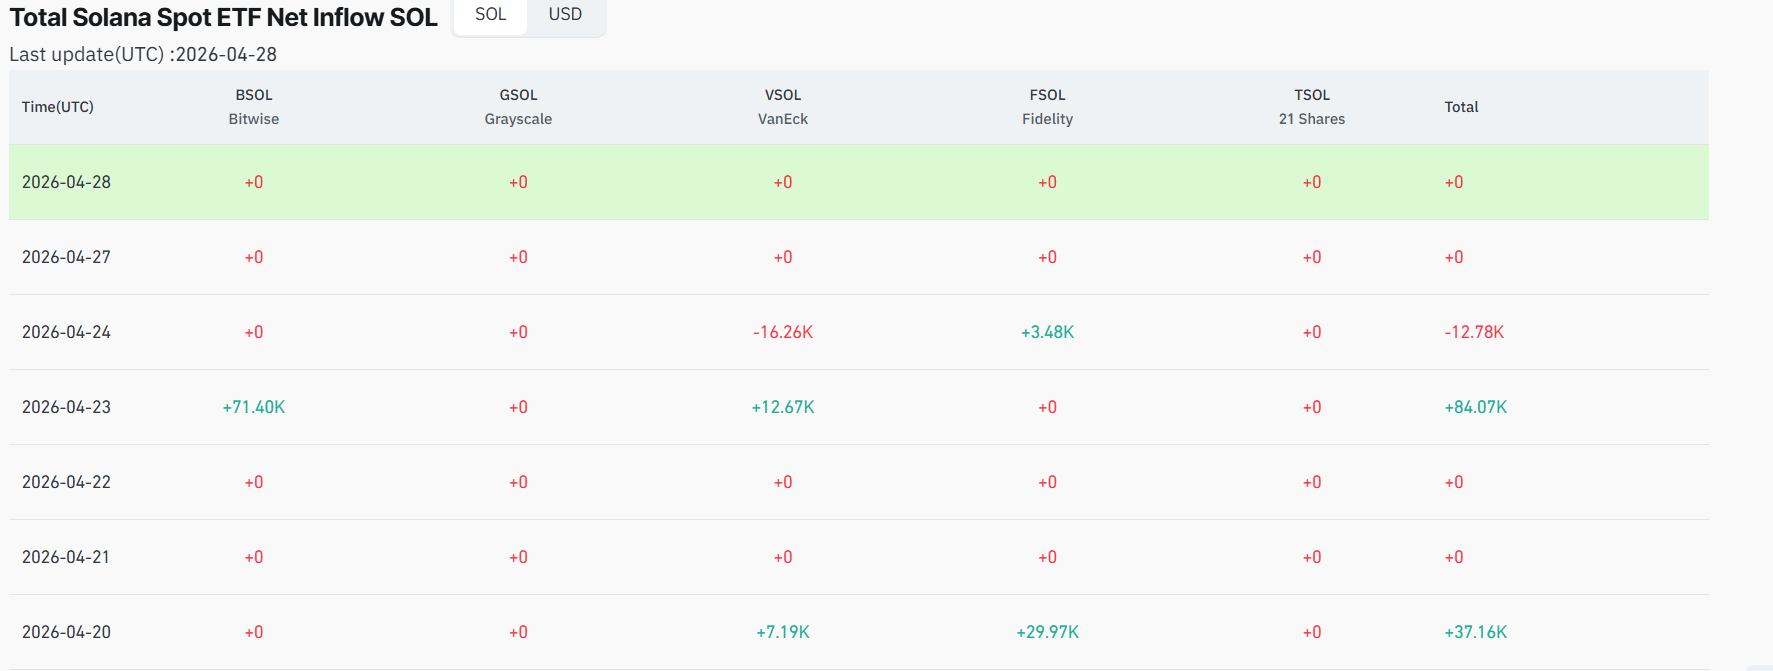
Until inflows return more consistently, SOL is likely to remain range-bound with limited ability to break higher.
Solana Price Forecast: Range Tightens
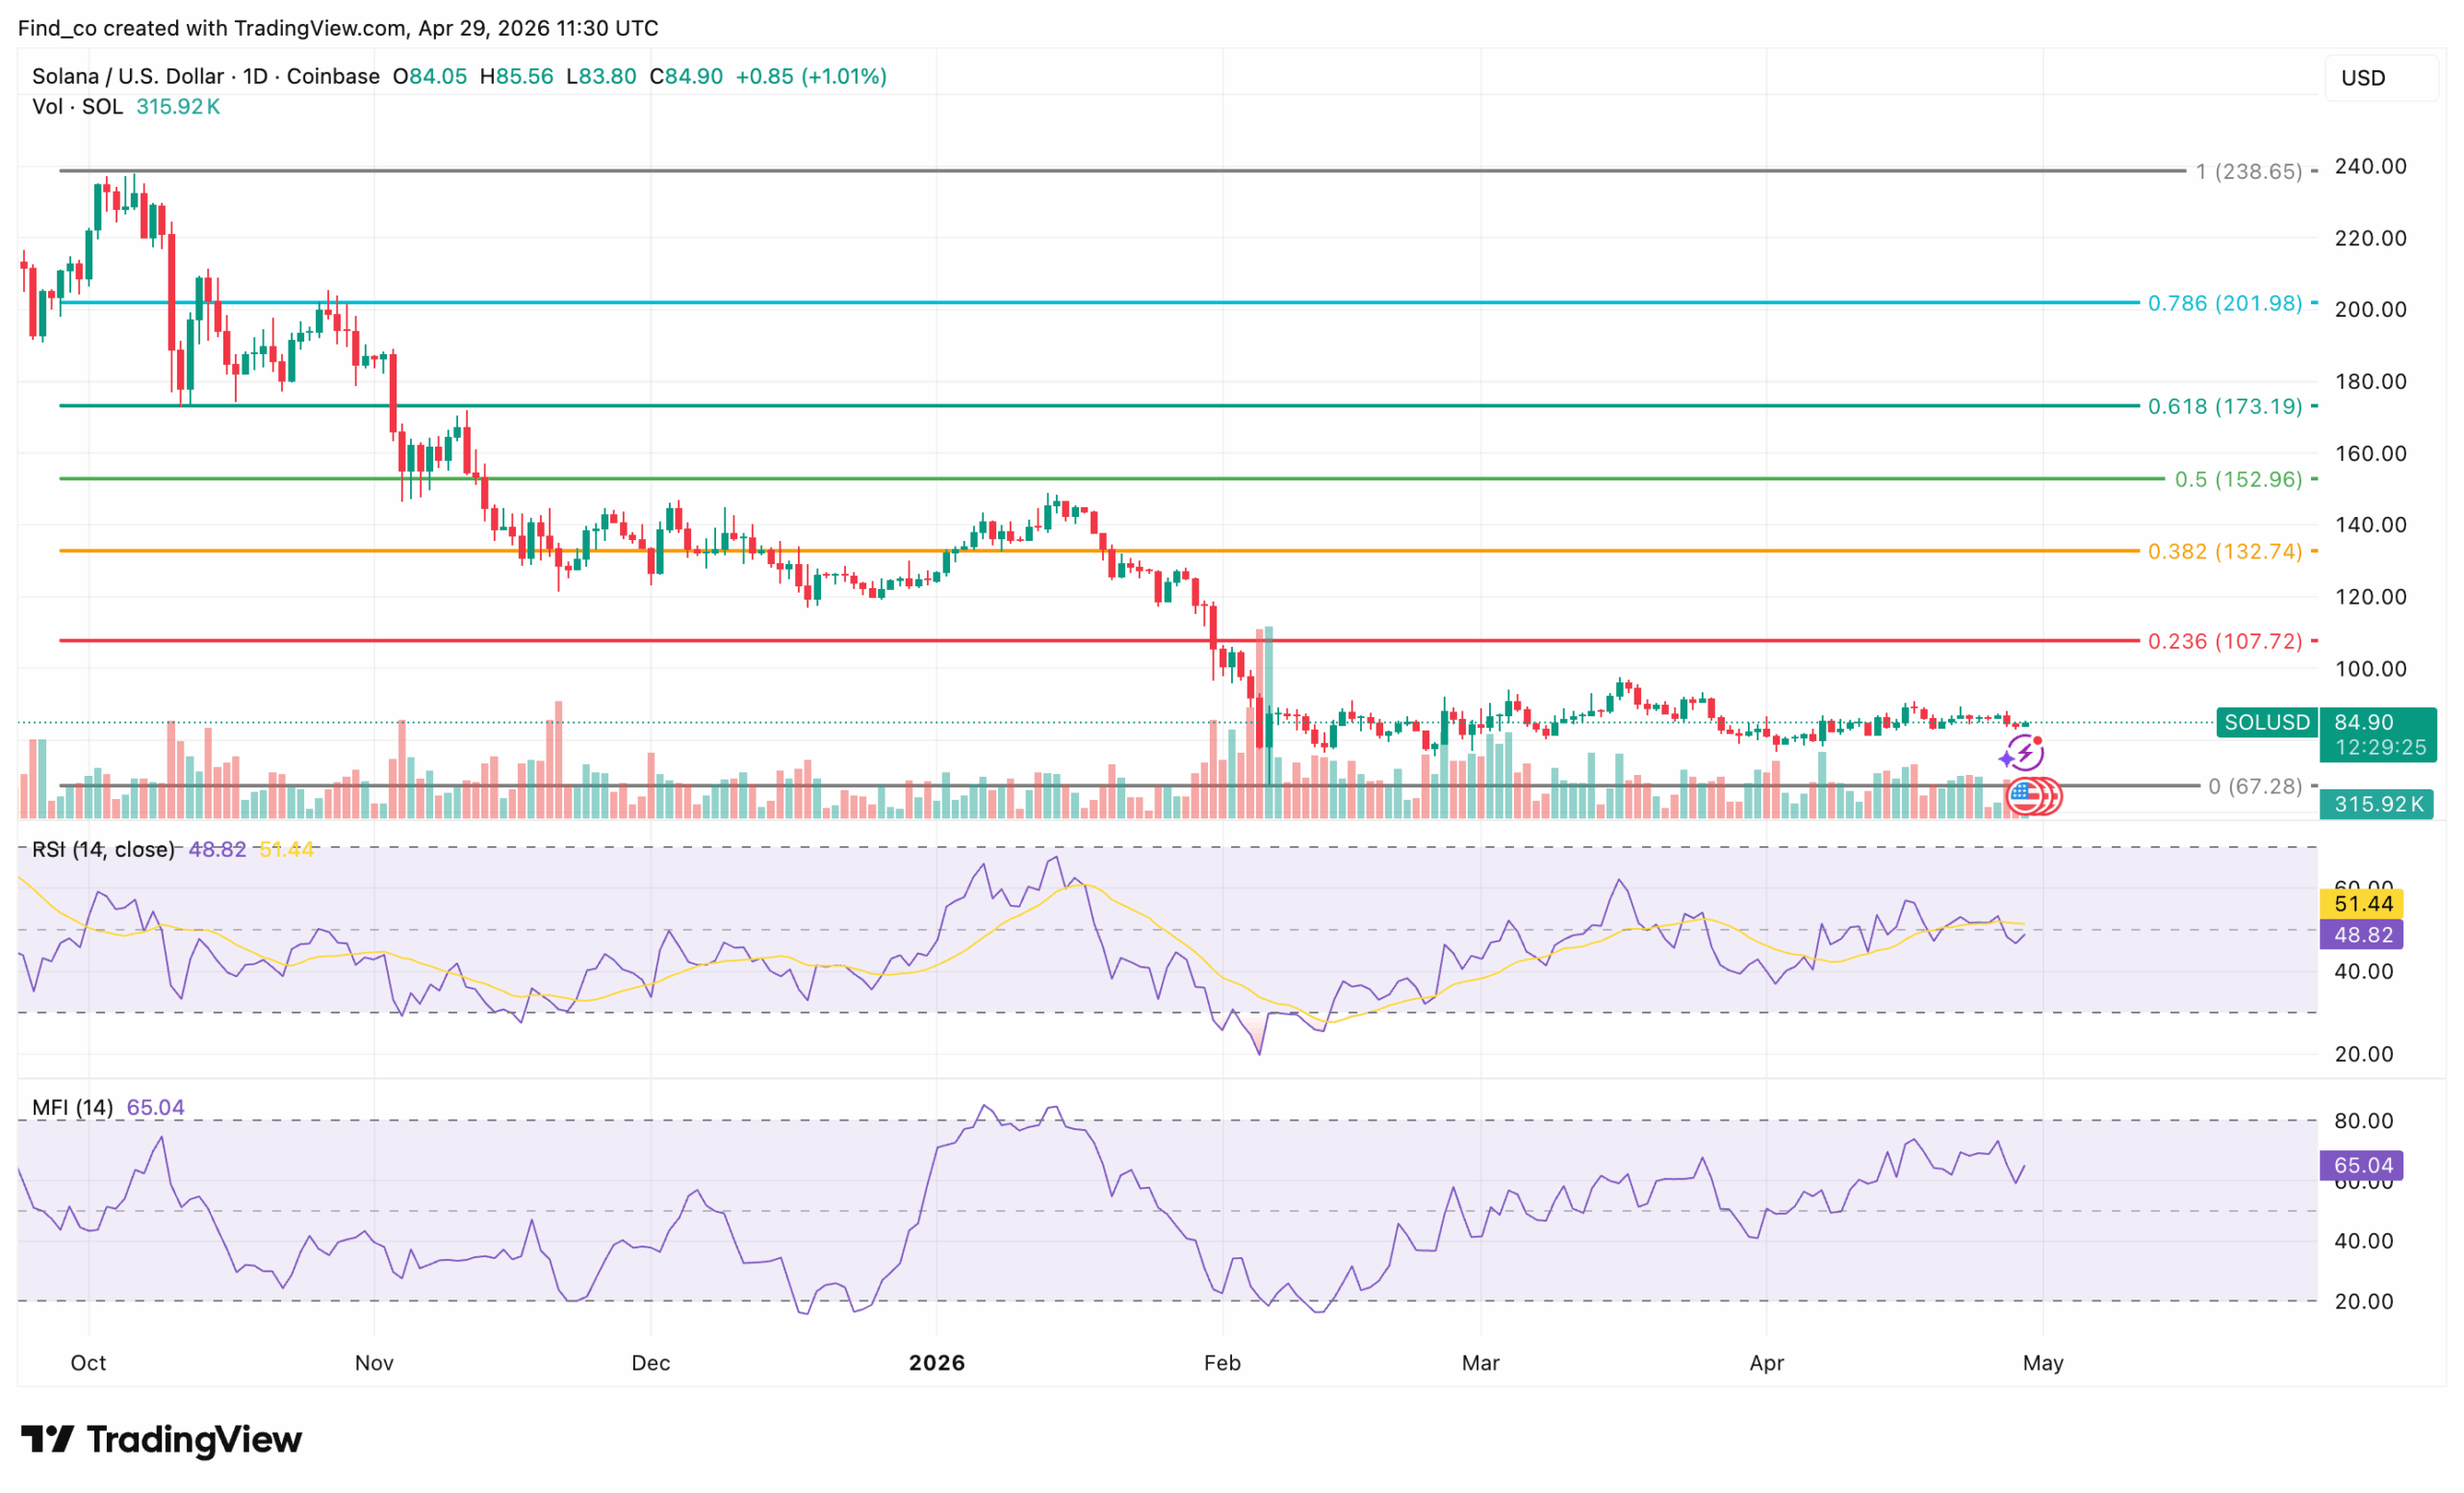
On the daily chart, SOL is stabilizing near $84 after months of sustained downside pressure.
The token remains capped below a descending trendline that has limited rallies since late 2025, showing that sellers still control the higher-timeframe trend.
That said, momentum is gradually improving as SOL continues to hold the mid-$80 zone.
The sharp selloff in February, which pushed the price down to the $67.55 support level, triggered a rebound.
Since then, SOL has been consolidating in a tight range.
This type of price action often signals accumulation after a period of heavy distribution.
Momentum indicators reflect this shift.
The Relative Strength Index (RSI), currently near 48, signals neutral conditions but is trending higher, hinting at improving demand.
Similarly, the Money Flow Index (MFI) around 65 suggests steady capital inflows.
Even so, bulls still need a decisive break above the $95 level to confirm a stronger recovery phase.
Disclaimer:
The information provided in this article is for informational purposes only. It is not intended to be, nor should it be construed as, financial advice. We do not make any warranties regarding the completeness, reliability, or accuracy of this information. All investments involve risk, and past performance does not guarantee future results. We recommend consulting a financial advisor before making any investment decisions.
Victor Olanrewaju is a crypto analyst and reporter at CCN with deep roots in on-chain research and technical analysis. His crypto journey began in 2017, but it was the 2020 Uniswap airdrop that sparked a full-time pivot into the space.
With a foundation in copywriting, Victor honed his craft creating high-converting content for leading crypto brokers — most notably an XRP price prediction that ranked #1 on Google during the 2021 bull run.
He later joined AMBCrypto in 2022, where he combined storytelling with technical and on-chain analysis to cover key market narratives.
In 2024, he expanded his expertise at BeInCrypto, collaborating with analysts and using tools like Glassnode, Santiment, and IntoTheBlock to break down Bitcoin and altcoin trends.
At CCN, Victor covers the top cryptocurrencies, memecoins, macro shifts, blending real-time insights with deep-dive metrics.
He holds a Bachelor’s degree in Physics from the University of Ibadan, equipping him to simplify complex data for a wide audience. Follow his work or connect on LinkedIn or X.