Home / Analysis / Crypto / Technical Analysis / Bitcoin (BTC) Could Force $4B Liquidation If Price Falls Below $67K CME Gap as US Plans to Block Strait of Hormuz
BTC hovers near critical support as macro risks rise | Credit: Hameem Sarwar
Share
Key Takeaways
Bitcoin has dropped below $73,000 amid rising geopolitical tensions and weakening bullish momentum.
A large cluster of long liquidations below $67,000 creates downside risk, though clearing it could fuel a rebound.
Unless BTC reclaims key resistance around $75,000, the price may consolidate or fall further toward $60,000.
Unlike its price action last week, Bitcoin (BTC) has dropped below $73,000.
This development occurred as the U.S. and Iran failed to reach an agreement on peace talks over the weekend.
At the time of writing, Bitcoin’s price is hovering near $70,000. But the underlying market structure suggests growing fragility — particularly around the $67,000 CME gap.
In this analysis, CCN breaks down the current Bitcoin technical setup and what could happen if the price slides to the level mentioned above.
That green curve climbing toward $4 billion suggests a huge cluster of longs will get forced out if Bitcoin’s price keeps falling, specifically below $67,000.
At the same time, below the price, long liquidation liquidity has already been cleared. That red curve collapsing into the current price zone tells you downside fuel is mostly gone.
So structurally, the path of least resistance is still higher.
If the price continues to rise, it will enter that dense short liquidity region. That triggers cascading liquidations, which can accelerate the move.
However, once Bitcoin’s price moves through a large portion of that $4.62 billion liquidity, the dynamic changes.
Interestingly, if that happens, it would mean that BTC has fallen below the current CME gap.
For context, a CME gap refers to a price gap that appears between the closing price of an asset on the Chicago Mercantile Exchange (CME) and its reopening price after the market has been closed
The gap does not have to be filled. In point of fact, it usually does, but it does not have to.
No Peace Deal, No Rally
As mentioned earlier, peace talks between the U.S and Iran ended without a deal, removing a key bullish catalyst that had recently supported risk assets, including Bitcoin.
Markets reacted quickly.
Bitcoin’s price, which had been trading near $73,000 amid optimism over negotiations, slipped toward $70,000 following the breakdown in talks.
Over the past several weeks, Bitcoin price action has been tightly linked to geopolitical headlines.
However, the latest catalyst is also geopolitical.
Tensions between the U.S. and Iran are escalating again, with renewed threats centered around control of the Strait of Hormuz, one of the world’s most important energy chokepoints.
Following the move, oil prices have surged toward $110 per barrel amid fears of supply disruptions. Should the U.S. force the closure, BTC price could slide much lower than $70,000.
BTC Price Analysis: $60,000 Coming?
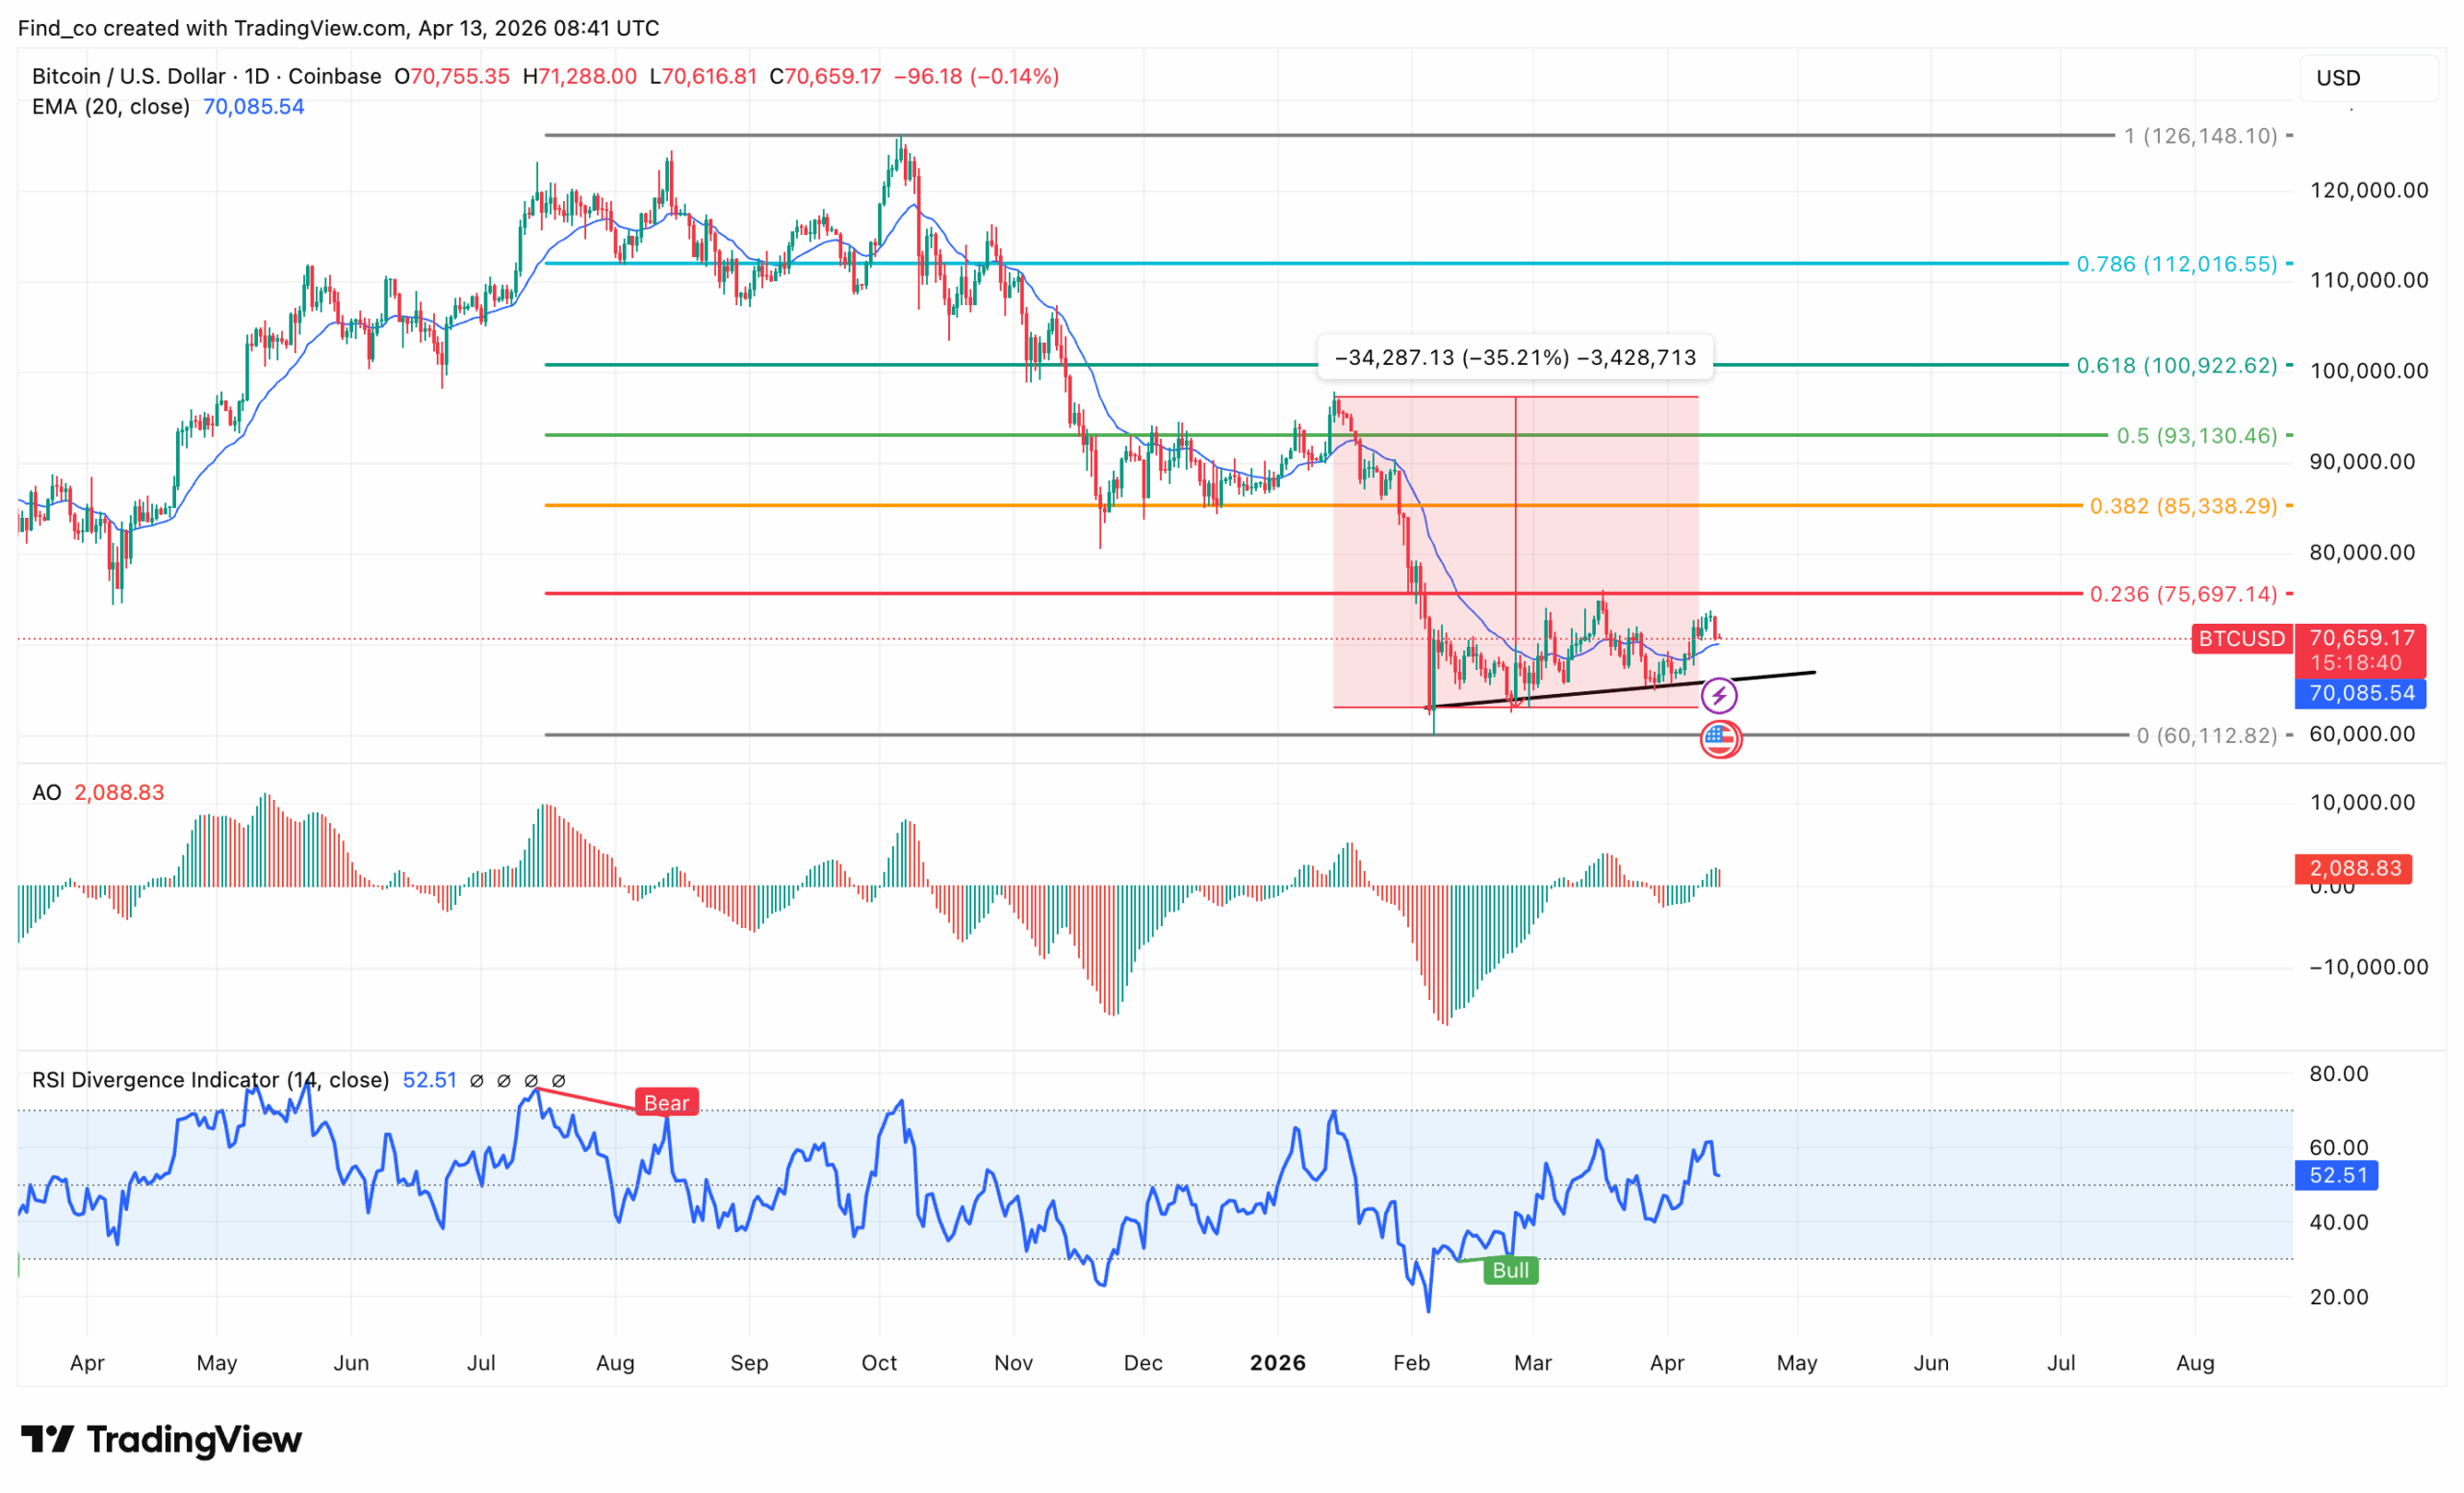
From a technical perspective, BTC is transitioning from a corrective phase into a potential base, but it hasn’t yet confirmed strength.
At the time of writing, Bitcoin’s price is holding above the $60,000 low and grinding higher with a slight uptrend forming.
At the same time, it’s reclaiming the 20 EMA ($70,076), which is the short-term pivot. In addition, the Awesome Oscillator (AO) is turning positive, and RSI is mid-range, so conditions are stabilizing rather than overheated.
However, Bitcoin’s technical structure is still weak on a higher timeframe. Price remains below the 0.236 ($75,697), which is the first real resistance from the larger breakdown.
Until that level is reclaimed, this is still technically a lower-high environment.
Upside targets are layered. First is $76,000. If that breaks and holds, the next move opens toward 85,000 at the 0.382 Fibonacci level.
But by the look of things, a breakout in that direction is unlikely. If this setup remains the same, Bitcoin’s price might continue consolidating or slide to $60,112 in a highly bearish scenario.
Disclaimer:
The information provided in this article is for informational purposes only. It is not intended to be, nor should it be construed as, financial advice. We do not make any warranties regarding the completeness, reliability, or accuracy of this information. All investments involve risk, and past performance does not guarantee future results. We recommend consulting a financial advisor before making any investment decisions.
Victor Olanrewaju is a crypto analyst and reporter at CCN with deep roots in on-chain research and technical analysis. His crypto journey began in 2017, but it was the 2020 Uniswap airdrop that sparked a full-time pivot into the space.
With a foundation in copywriting, Victor honed his craft creating high-converting content for leading crypto brokers — most notably an XRP price prediction that ranked #1 on Google during the 2021 bull run.
He later joined AMBCrypto in 2022, where he combined storytelling with technical and on-chain analysis to cover key market narratives.
In 2024, he expanded his expertise at BeInCrypto, collaborating with analysts and using tools like Glassnode, Santiment, and IntoTheBlock to break down Bitcoin and altcoin trends.
At CCN, Victor covers the top cryptocurrencies, memecoins, macro shifts, blending real-time insights with deep-dive metrics.
He holds a Bachelor’s degree in Physics from the University of Ibadan, equipping him to simplify complex data for a wide audience. Follow his work or connect on LinkedIn or X.