Home / Analysis / Crypto / Technical Analysis / Bitcoin Price Prediction: Why $78K and $85K Are the Most Important BTC Levels Ahead of April CPI Outcome
Here is how BTC might perform once CPI is out | Credit: Hameem Sarwar
Share
Key Takeaways
Bitcoin’s price continues to swing sideways ahead of the upcoming U.S. CPI report, with the $78,600 acting as support.
On-chain indicators show weakening market momentum, but analysts believe Bitcoin could still avoid a deeper bear market.
Technically, BTC remains above key support, though rising uncertainty around inflation data could trigger price swings.
Bitcoin (BTC) traders are preparing for another potentially volatile week as markets await the upcoming April Consumer Price Index (CPI) report, one of the most closely watched macroeconomic events for risk assets.
The inflation data release, set for May 12, arrives at a critical moment for Bitcoin, with the price continuing to hold above major technical support.
This has happened despite increasing signs that larger market participants may begin de-risking ahead of the event.
Historically, Bitcoin’s price has reacted positively following the last two CPI releases, helping fuel bullish momentum.
However, it could be different this time — here is why.
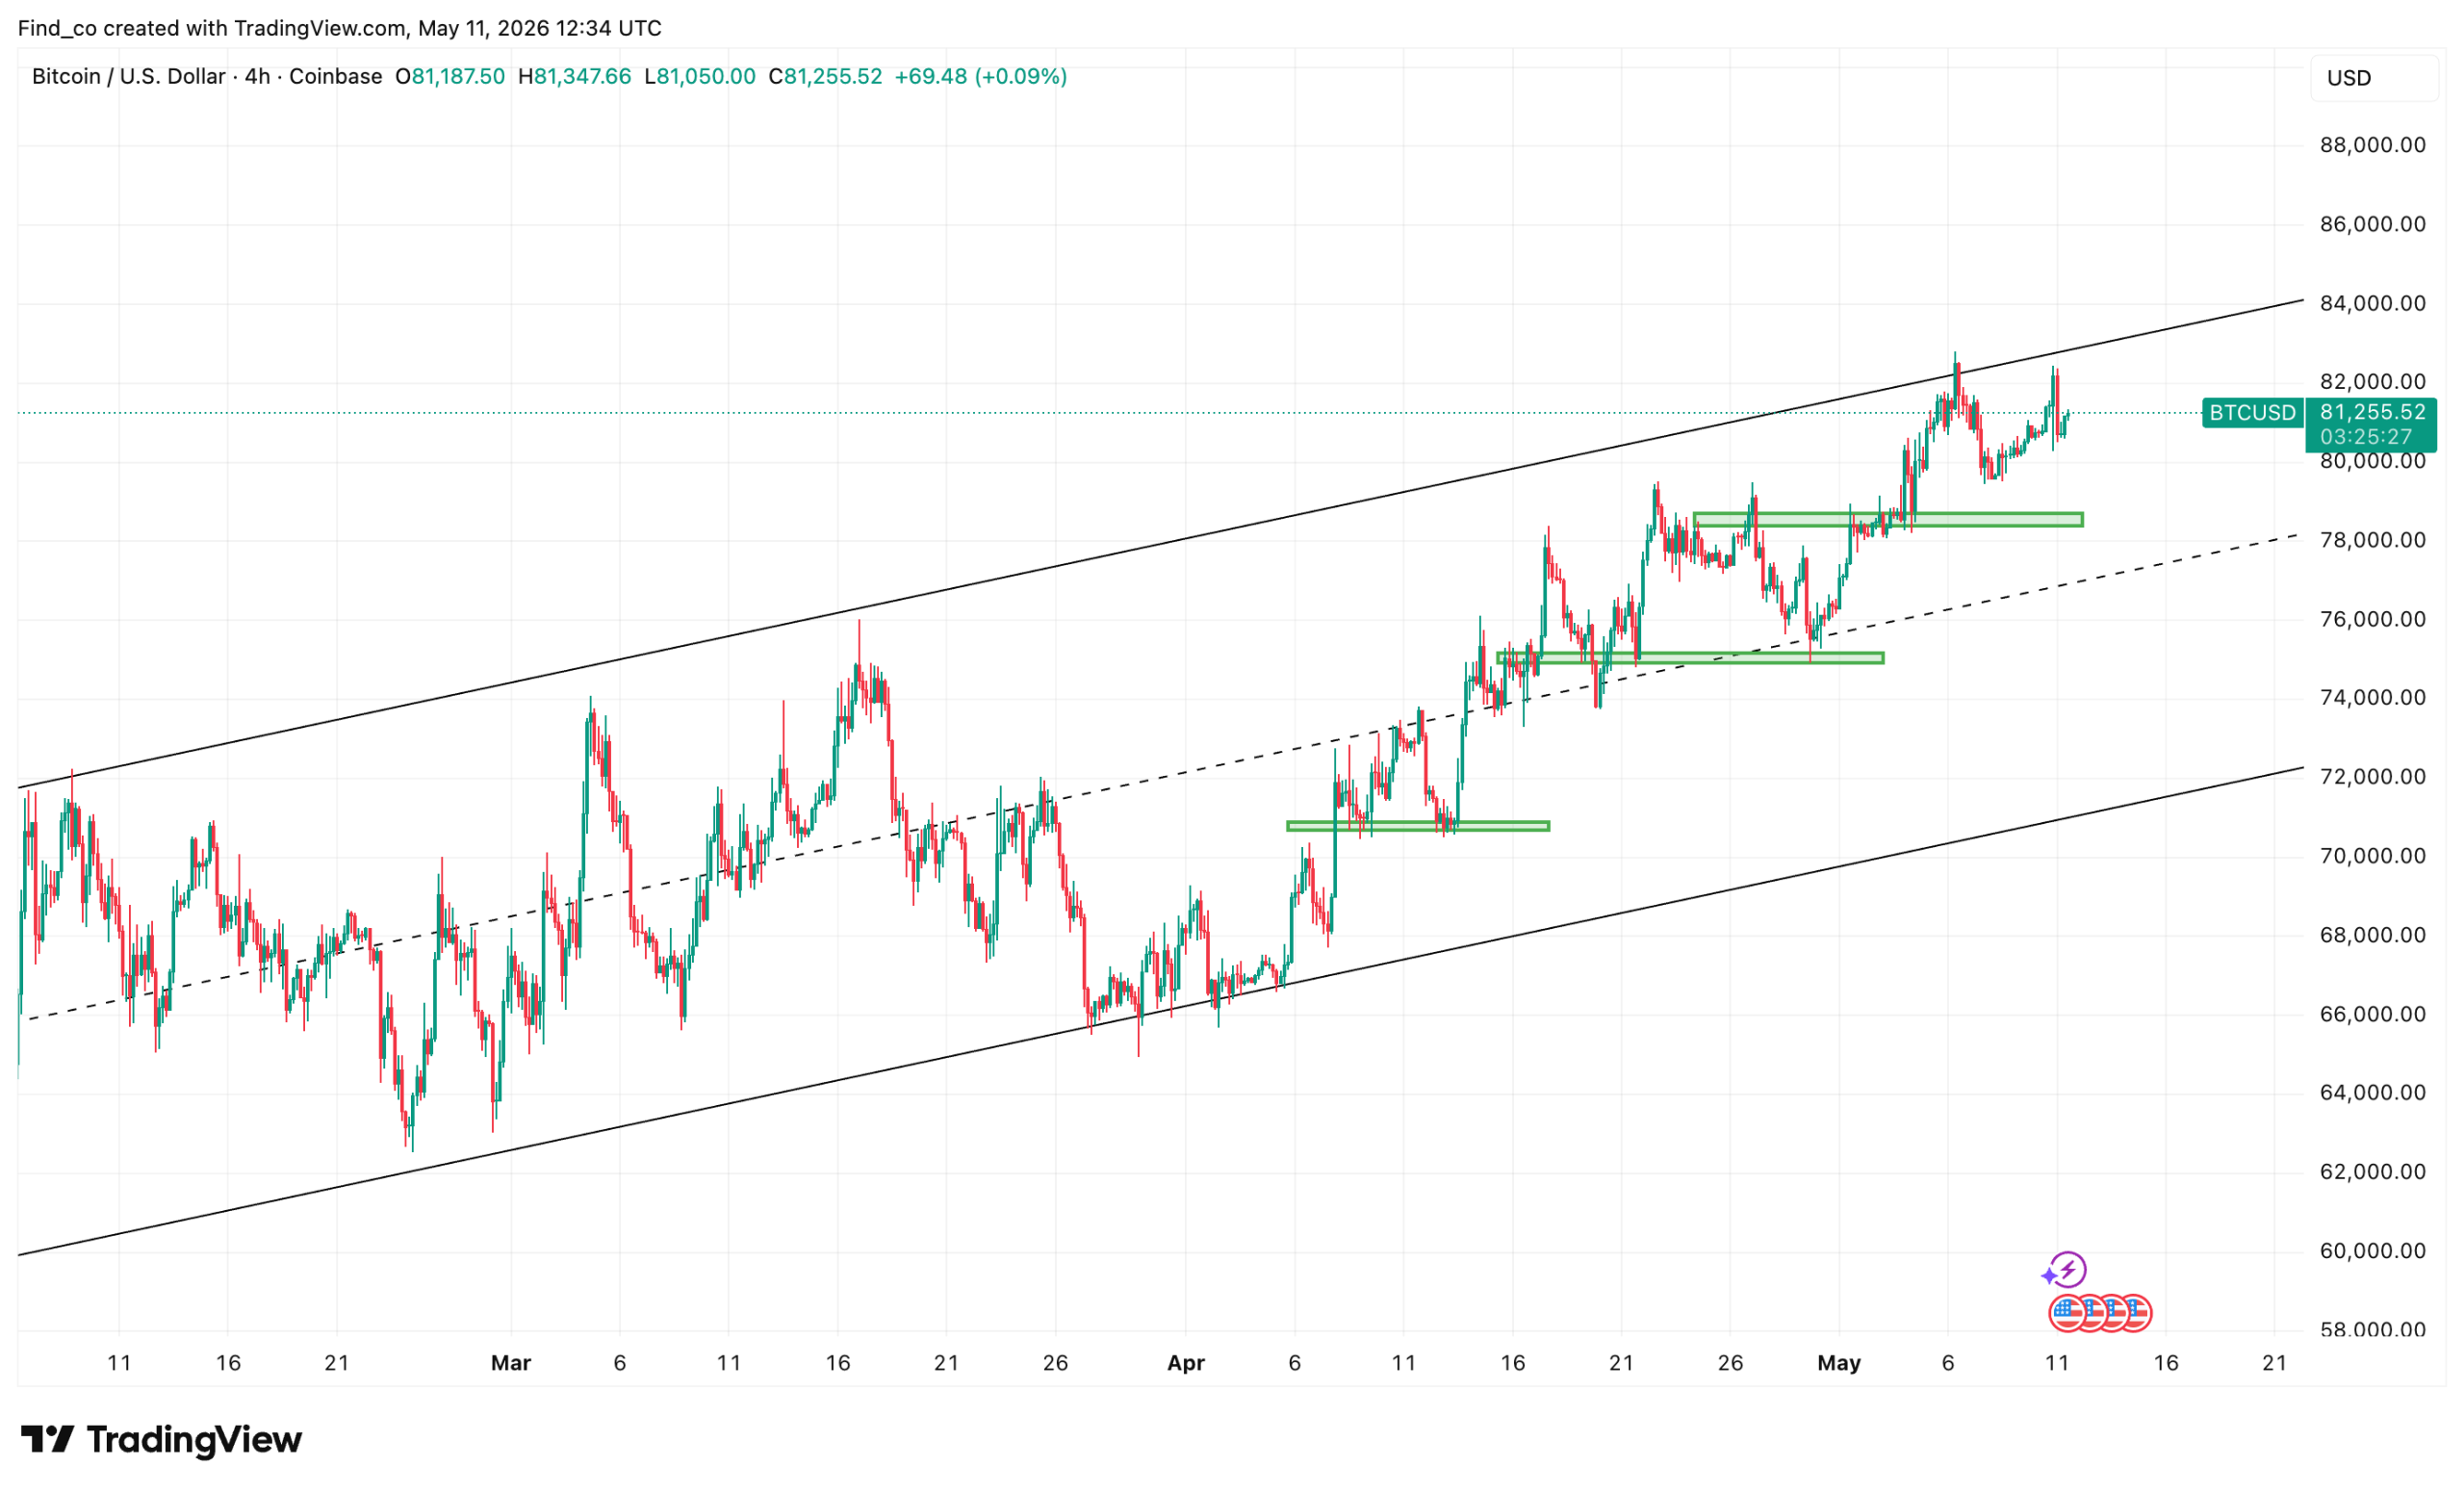
Bitcoin Holds Critical Range
The most important level currently being monitored is the $78,600 weekly open. Analysts believe this zone represents a critical pivot for short-term market structure.
These moves are common ahead of high-impact macro events such as CPI releases, particularly when market positioning becomes crowded.
CPI Could Make or Break BTC Movement
According to the U.S. Bureau of Labor Statistics (BLS) report released on April 10, the CPI for All Urban Consumers (CPI-U) increased 3.3% over the 12 months ending March 2026.
That figure was notably higher than the 2.4% annual inflation rate reported in February 2026. This reinforced concerns that inflationary pressures may still be persisting across the U.S. economy.
The hotter-than-expected inflation reading has become a major topic of discussion across both traditional financial markets and crypto trading communities.
If Bitcoin’s price experiences a sweep below support before quickly reclaiming higher levels, some analysts believe it could signal renewed bullish momentum after the CPI release.
On the other hand, sustained weakness below support could increase the probability of broader downside continuation.
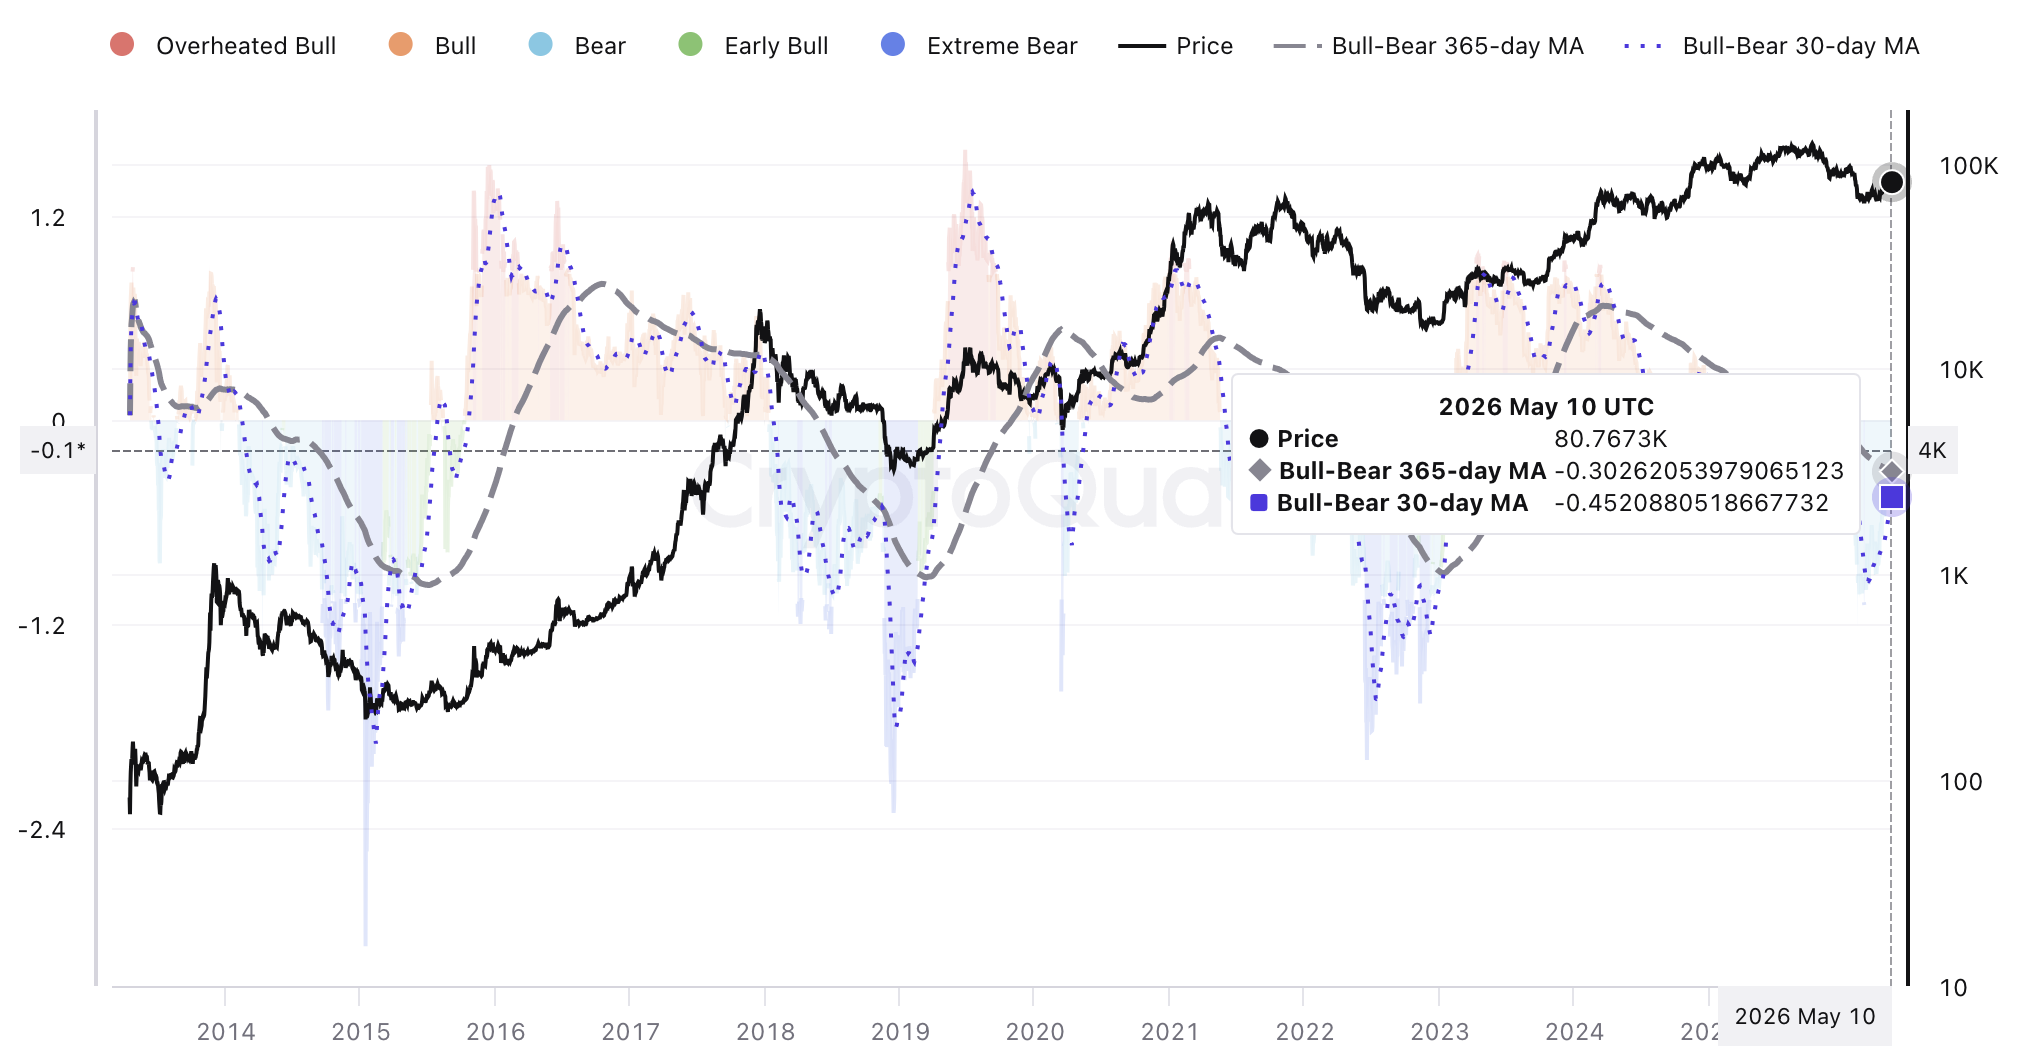
No More Bitcoin Bear Market?
From an on-chain perspective, CryptoQuant data shows that Bitcoin’s bull-bear market cycle indicator is currently sitting in bearish territory.
Notably, both the 30-day and 365-day moving averages are below the neutral line.
Historically, similar conditions have appeared during major correction or consolidation phases rather than full trend continuation periods.
What makes this interesting is that the BTC price itself remains relatively elevated near the $80,000 region despite sentiment and cycle positioning weakening beneath it.
This divergence can imply that the market is losing internal momentum, even while Bitcoin’s price holds up externally.
Furthermore, the 30-day MA’s downturn suggests that short-term sentiment and momentum have deteriorated.
On the other hand, the slower 365-day MA turning negative signals broader cycle weakness beginning to build.
In past cycles, this type of setup preceded either prolonged sideways action, followed by a stronger recovery phase.
So, if history is anything to go by, Bitcoin’s price will likely evade another crash. Instead, it could slowly grind higher once it tests $85,000.
Meanwhile, crypto analyst Michaël van de Poppe shares a similar sentiment.
“There’s still a small CME gap beneath us, so it’s not surprising that we’re seeing some corrections in the markets for #Bitcoin. Other than that, the trend remains upward. The 21-MA is below the current price; there’s still a lot of momentum, and there’s no breakdown of the higher-high, higher-low structure. There’s no reason to believe that we’re stalling soon,” van de Poppe noted.
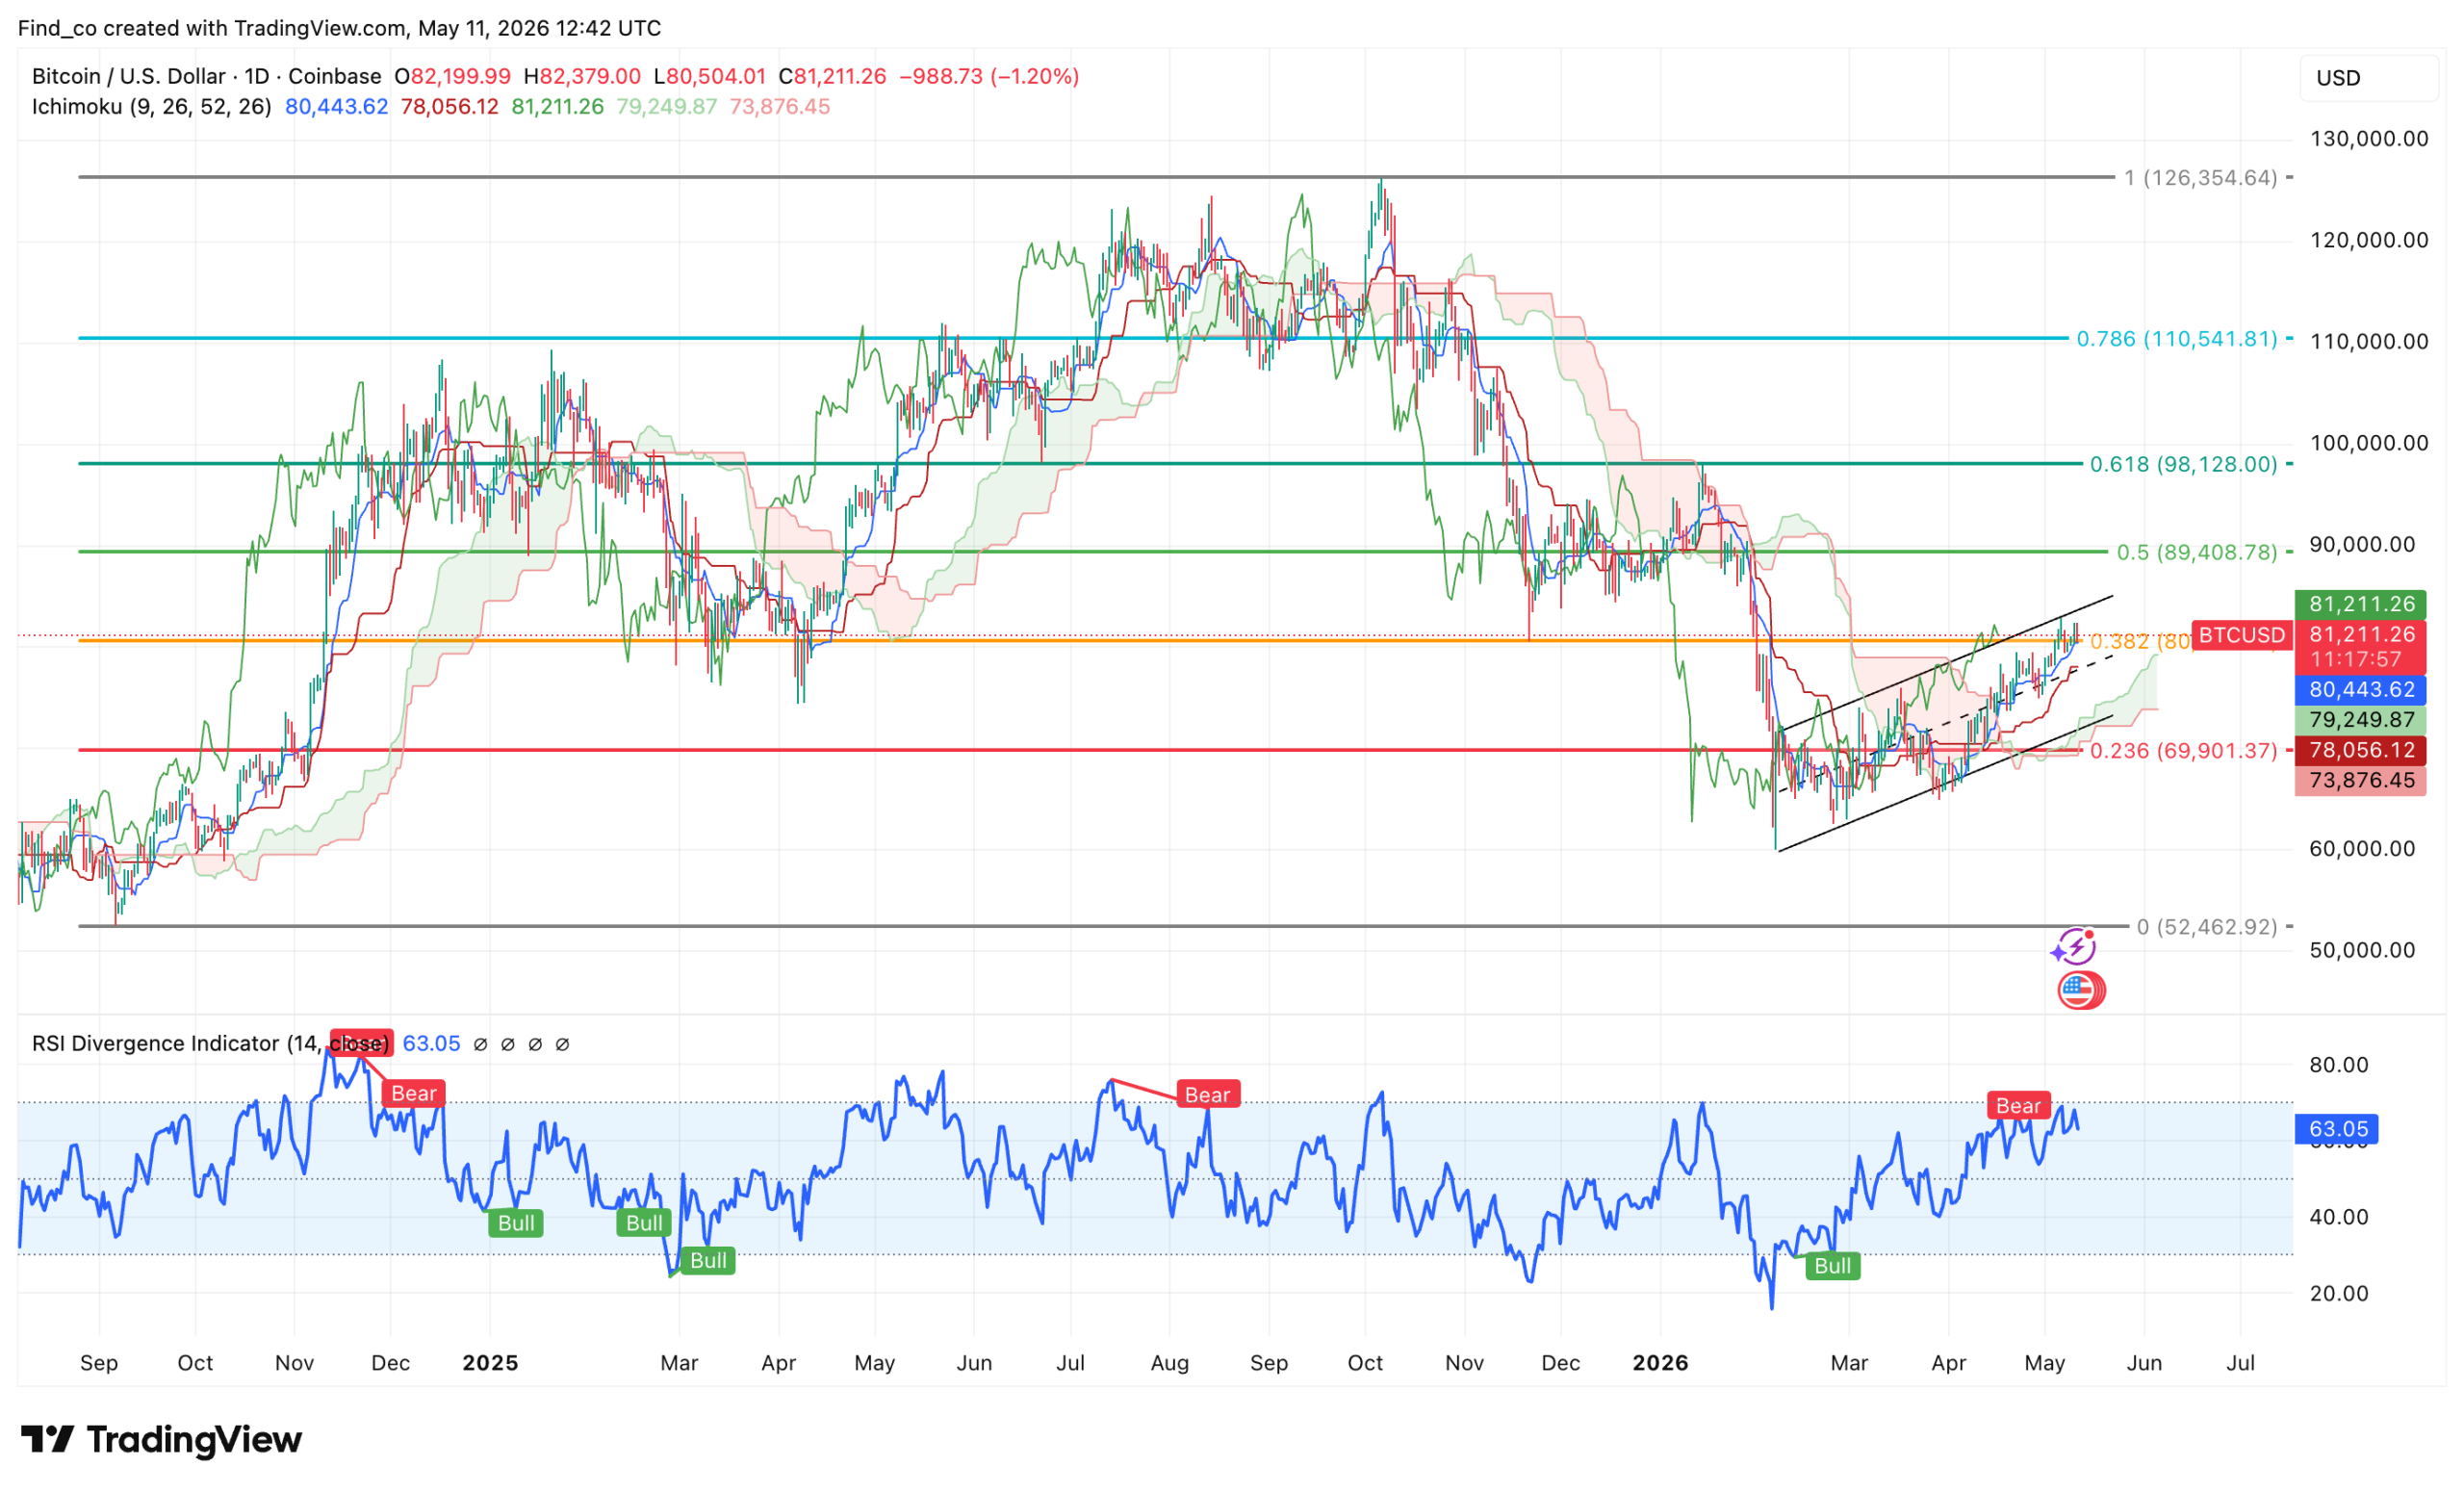
What Lies Ahead for BTC Price?
On the daily chart, BTC is attempting to break out of a rising channel while trading above the Ichimoku cloud, which keeps the broader structure bullish for now.
At press time, the price is reclaiming the 0.382 Fibonacci level around $80,400. However, the cloud support near $79,000 is acting as a key short-term demand zone.
The Ichimoku setup is constructive overall, with Bitcoin’s price above the cloud and the conversion/base lines curling upward, suggesting momentum is still favoring buyers.
However, the RSI is approaching overheated territory and showing a bearish divergence, which could signal weakening momentum.
If BTC confirms a breakout above the wedge and holds above $81,000, the next major target sits around the 0.5 Fib near $89,408.
A rejection here could trigger a pullback toward the cloud support around $69,901, near the 0.236 Fib.
Despite the technical setup, it is important to assess how the CPI outcome could affect BTC.
Although inflation has cooled compared to previous years, markets remain highly sensitive to any data that could alter expectations for Federal Reserve policy, interest rates, and broader liquidity conditions.
Bitcoin, like many risk assets, has increasingly traded alongside macroeconomic narratives over the past several years.
Disclaimer:
The information provided in this article is for informational purposes only. It is not intended to be, nor should it be construed as, financial advice. We do not make any warranties regarding the completeness, reliability, or accuracy of this information. All investments involve risk, and past performance does not guarantee future results. We recommend consulting a financial advisor before making any investment decisions.
Victor Olanrewaju is a crypto analyst and reporter at CCN with deep roots in on-chain research and technical analysis. His crypto journey began in 2017, but it was the 2020 Uniswap airdrop that sparked a full-time pivot into the space.
With a foundation in copywriting, Victor honed his craft creating high-converting content for leading crypto brokers — most notably an XRP price prediction that ranked #1 on Google during the 2021 bull run.
He later joined AMBCrypto in 2022, where he combined storytelling with technical and on-chain analysis to cover key market narratives.
In 2024, he expanded his expertise at BeInCrypto, collaborating with analysts and using tools like Glassnode, Santiment, and IntoTheBlock to break down Bitcoin and altcoin trends.
At CCN, Victor covers the top cryptocurrencies, memecoins, macro shifts, blending real-time insights with deep-dive metrics.
He holds a Bachelor’s degree in Physics from the University of Ibadan, equipping him to simplify complex data for a wide audience. Follow his work or connect on LinkedIn or X.