Toncoin is down 21% from its $2.97 peak as profit-taking and bearish signals point to a deeper pullback. Credit: CCN
Share
Key Takeaways
TON has shed 21% from its $2.90 May 7 peak as on-chain profit-taking and fading social sentiment unwind the rally sparked by Pavel Durov’s announcement.
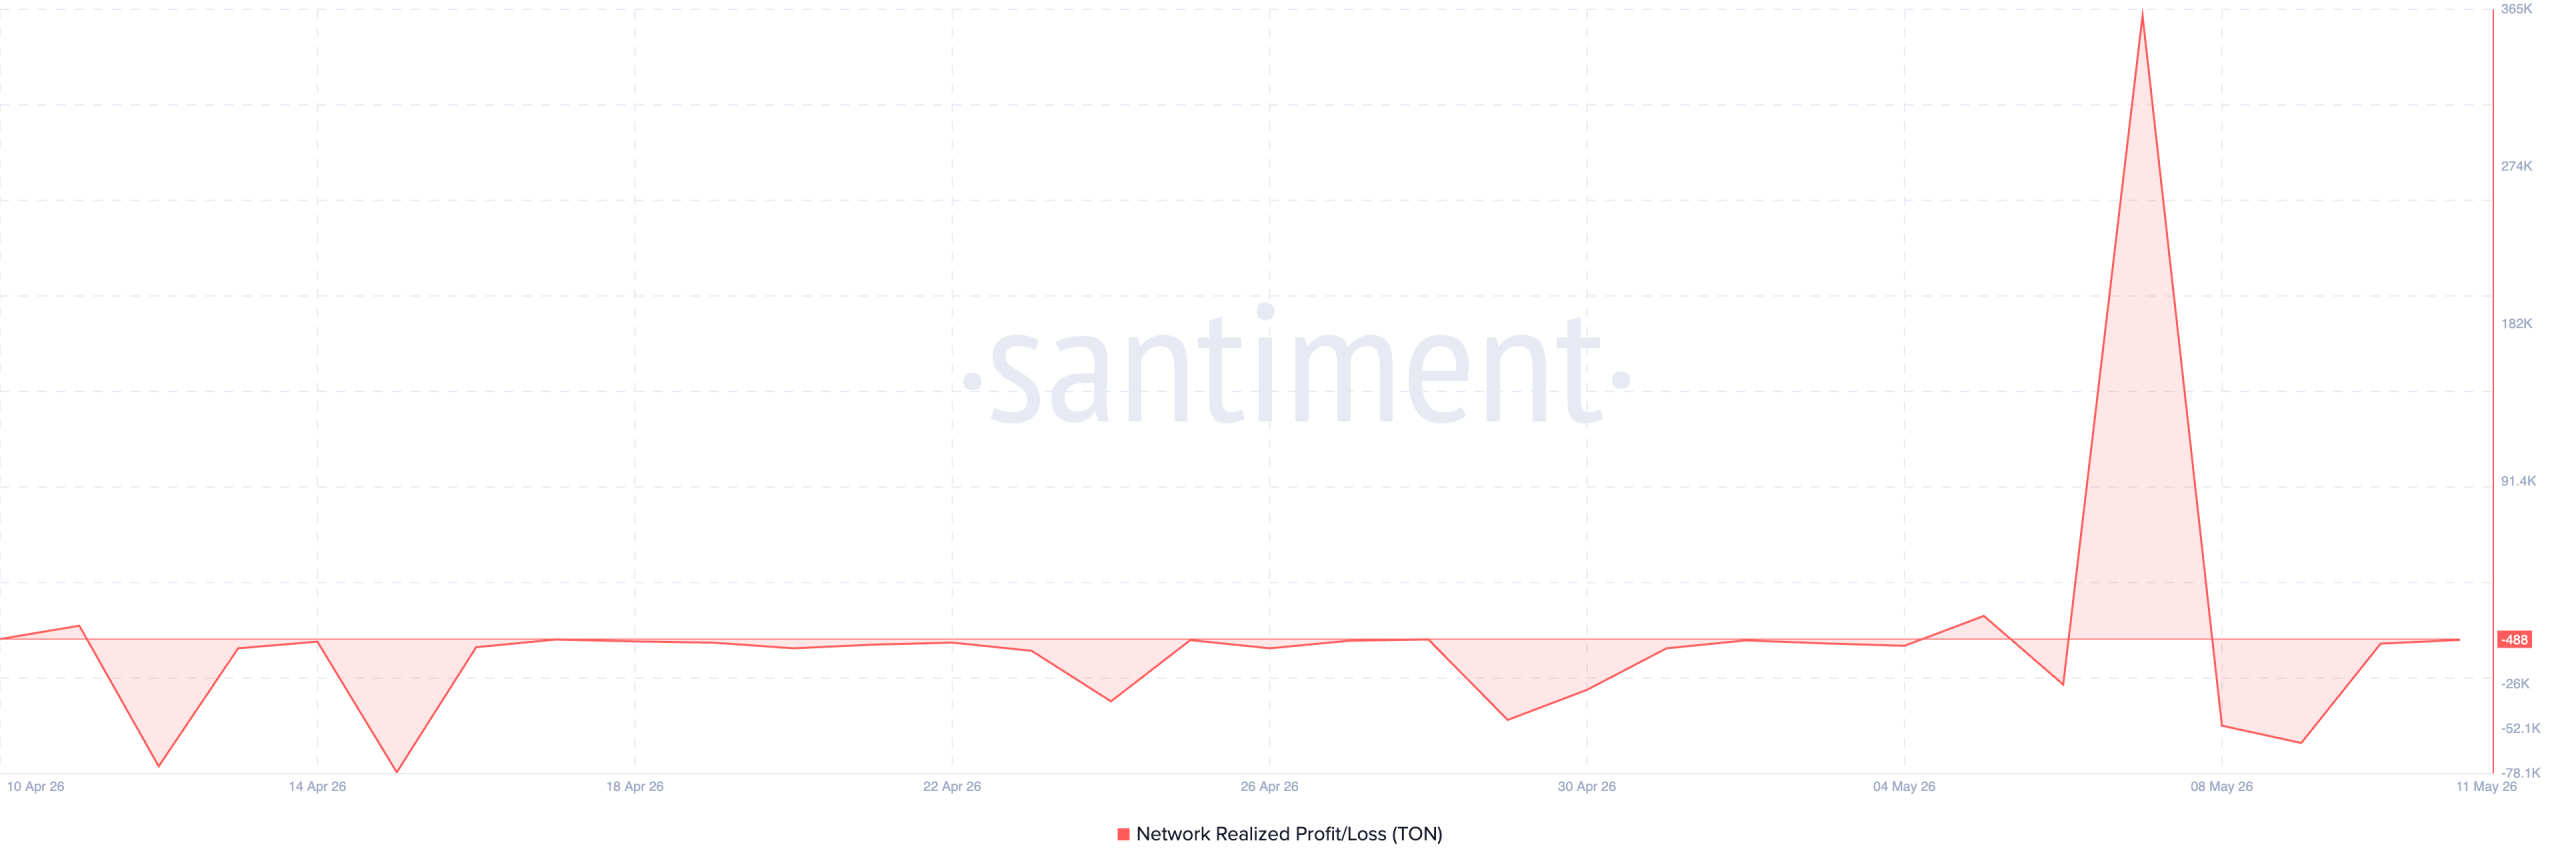
Network Profit/Loss hit a two-year high on May 7, signaling long-term holders used the Durov-driven surge as exit liquidity.
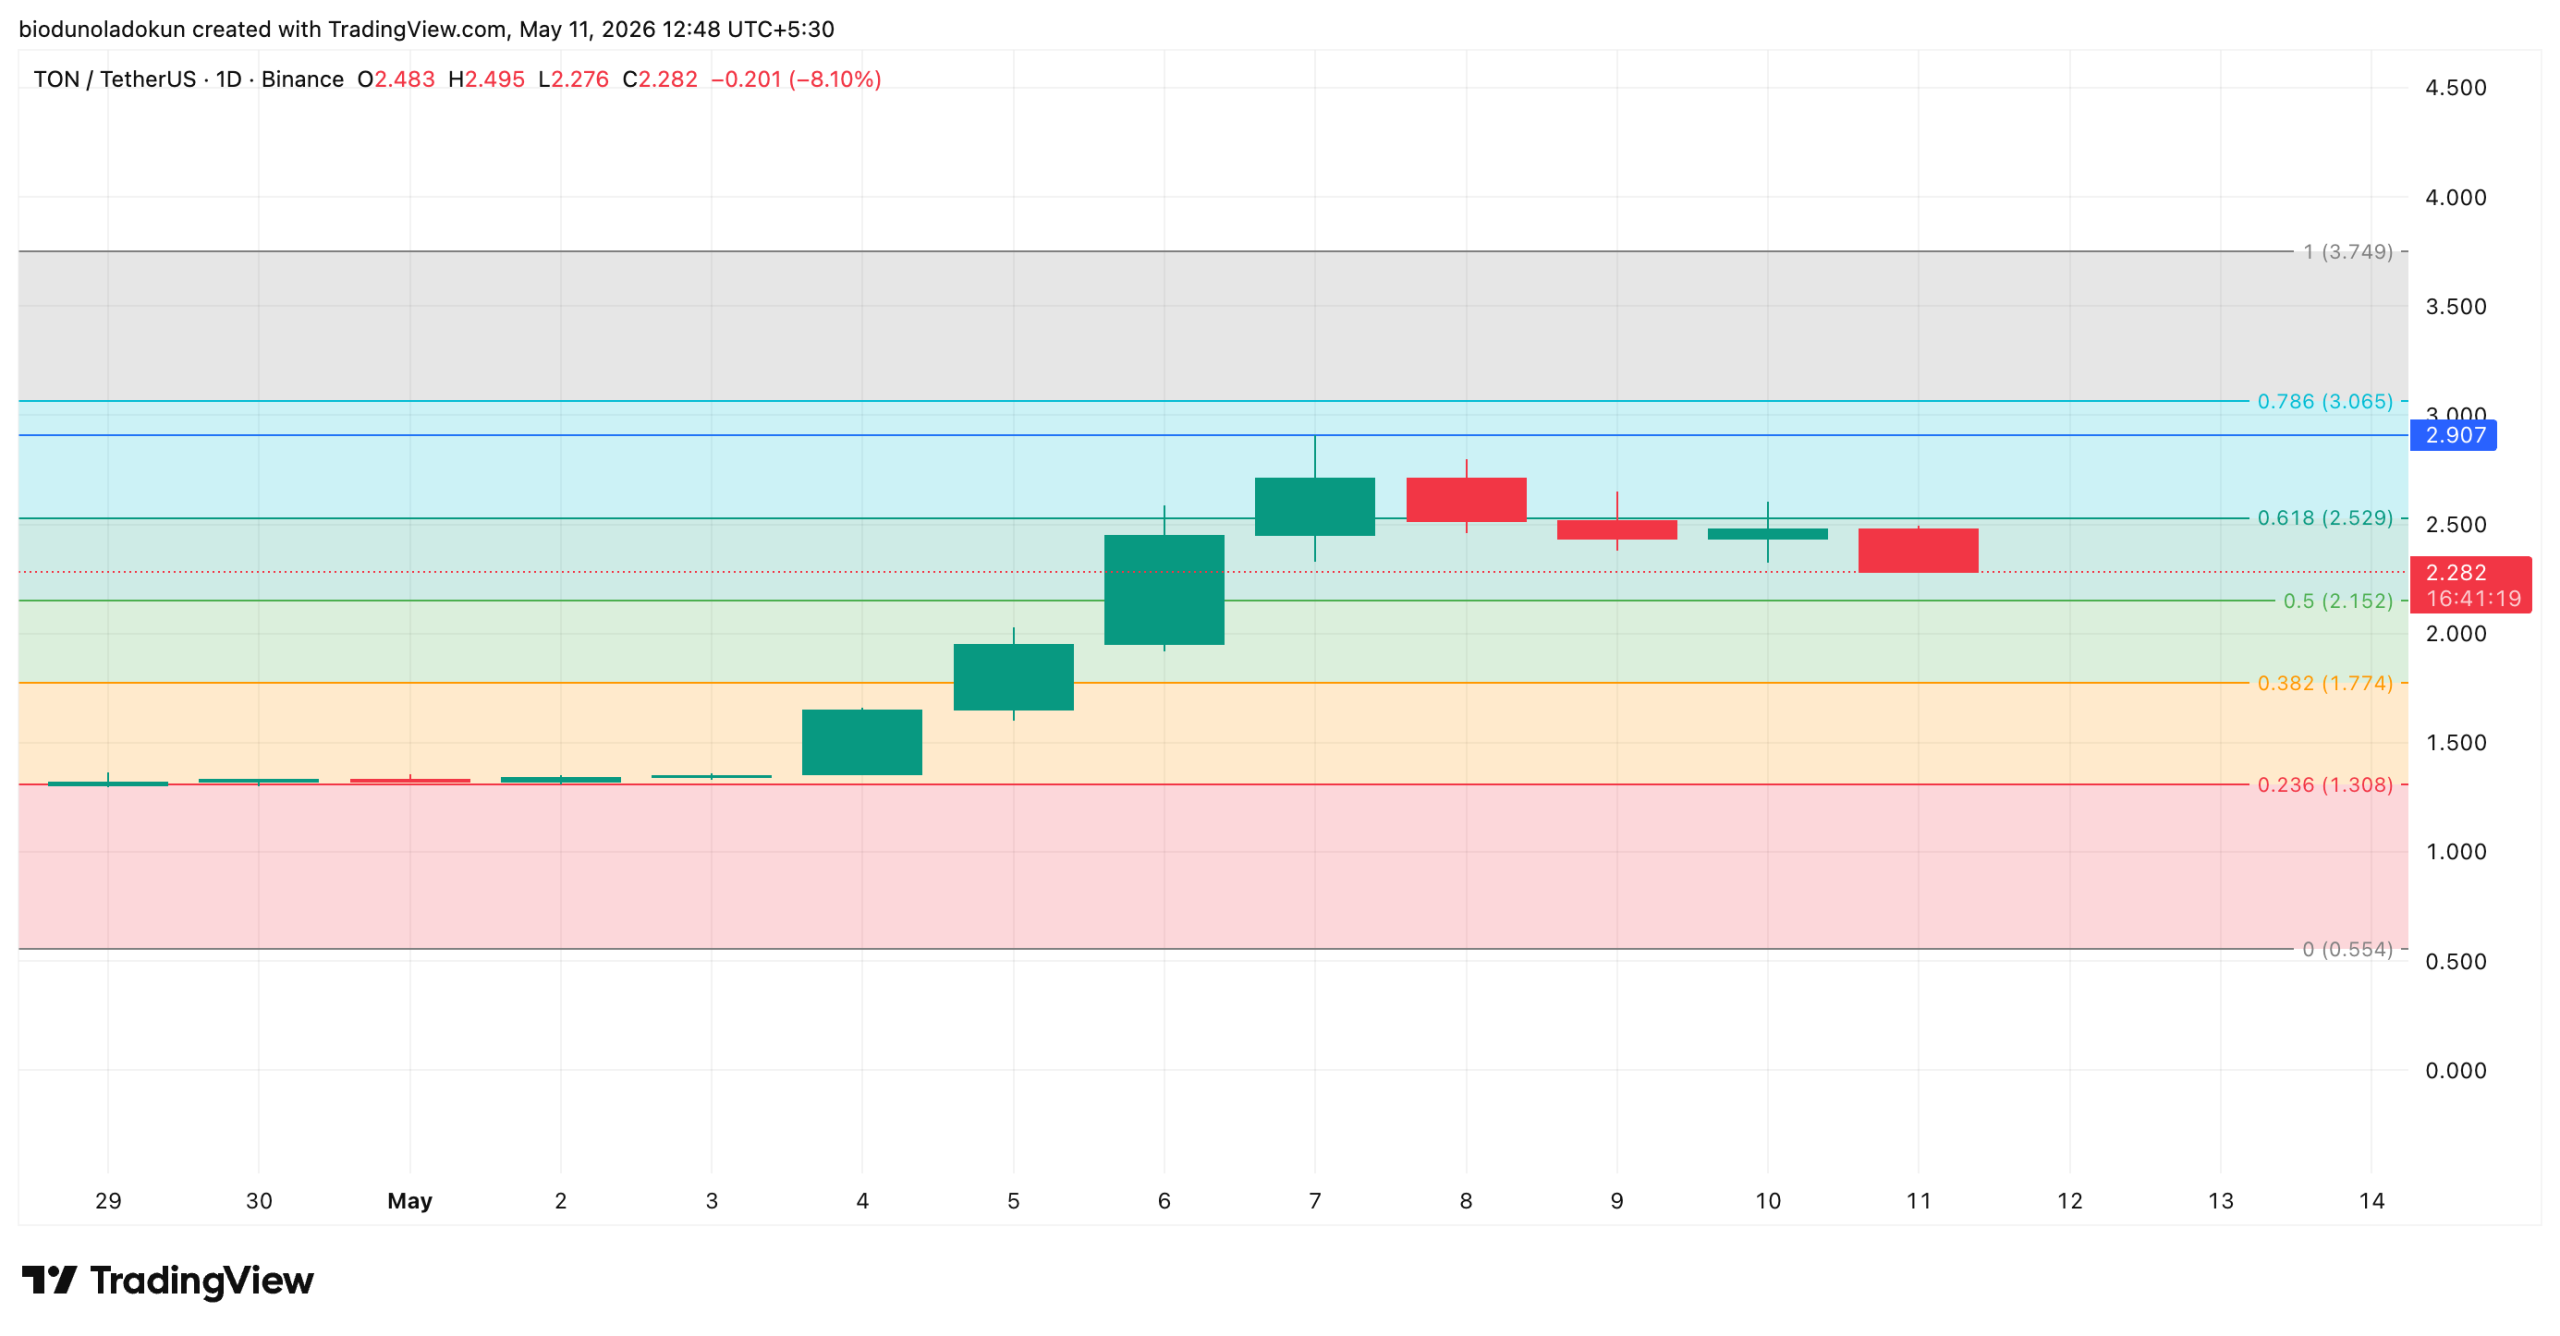
TON has broken below the 0.618 Fibonacci “golden ratio” at $2.52, with $2.15 now the critical support; a daily close below it opens the door to $1.77.
TON’s price is showing signs of exhaustion, a week after Telegram founder Pavel Durov sparked one of the token’s sharpest rallies of the year.
In an update shared on May 4, 2026, Durov announced that Telegram would replace the TON Foundation as the primary driving force behind The Open Network and become the network’s largest validator.
The market response was immediate. TON surged more than 120% over the three days that followed, peaking at $2.89 by May 7.
However, since hitting this high, TON has trended downward, shedding 21% of its value.
On-chain and technical readings suggest the token might be eyeing a deeper dip, potentially toward pre-announcement levels.
Try Our Recommended Crypto Exchanges
Sponsored
Disclosure
We sometimes use affiliate links in our content, when clicking on those we might receive a commission at no extra cost to you. By using this website you agree to our terms and conditions and privacy policy.
On-chain, the clearest red flag is TON’s Network Profit/Loss (NPL) metric, which surged to a two-year high on May 7 as the token neared $3, before sharply reversing.
This metric reflects the net profit or loss of all coins moved on-chain, based on the price at which they were last moved.
A rising NPL suggests increasing profitability across the network.
When it spikes this high, it signals a wave of profit-taking as holders move coins they acquired at lower prices and lock in gains.
The timing of the spike is the tell.
TON’s NPL printed its highest reading in two years just as the altcoin climbed to a nine-month high near $2.90.
This is a textbook signal that long-term holders used the Durov-driven rally as their exit liquidity.
As early sellers cash out, the resulting price weakness may pressure other TON holders to follow, as they fear the rally is over.
This may trigger an extended downward trend.
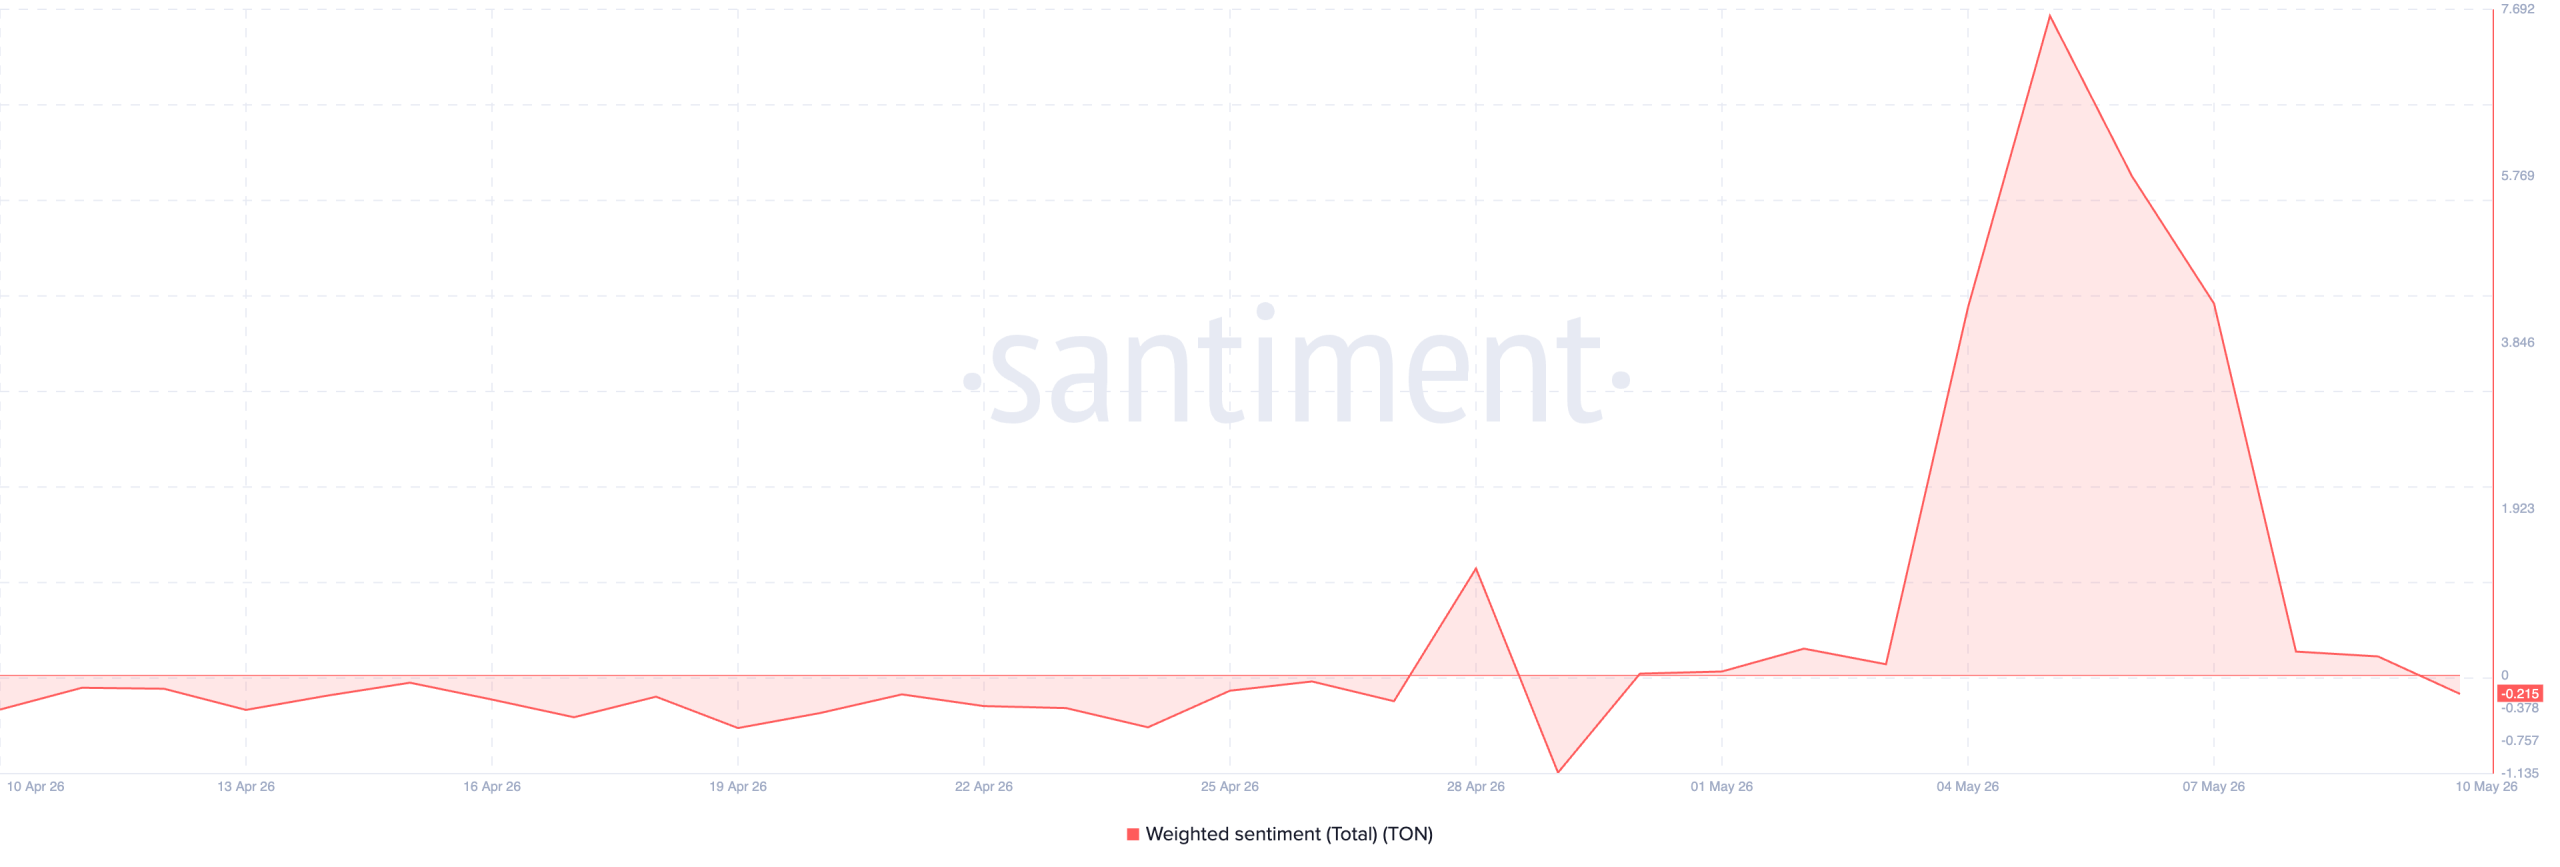
Further, per Santiment’s data, TON’s weighted sentiment spiked sharply following Durov’s May 4 post, reaching a peak of 7.62 by May 5.
The surge reflected a wave of bullish conviction as positive chatter dominated social feeds, mirroring the price action that pushed TON to its multi-month high.
However, that euphoria has since begun to fade, with weighted sentiment slipping back below the zero line for the first time since April 30.
This means negative chatter around TON once again outweighs the positive chatter, a trend that may continue to lower its spot price.
TON Buy-Side Pressure Shrinks Among Spot Traders
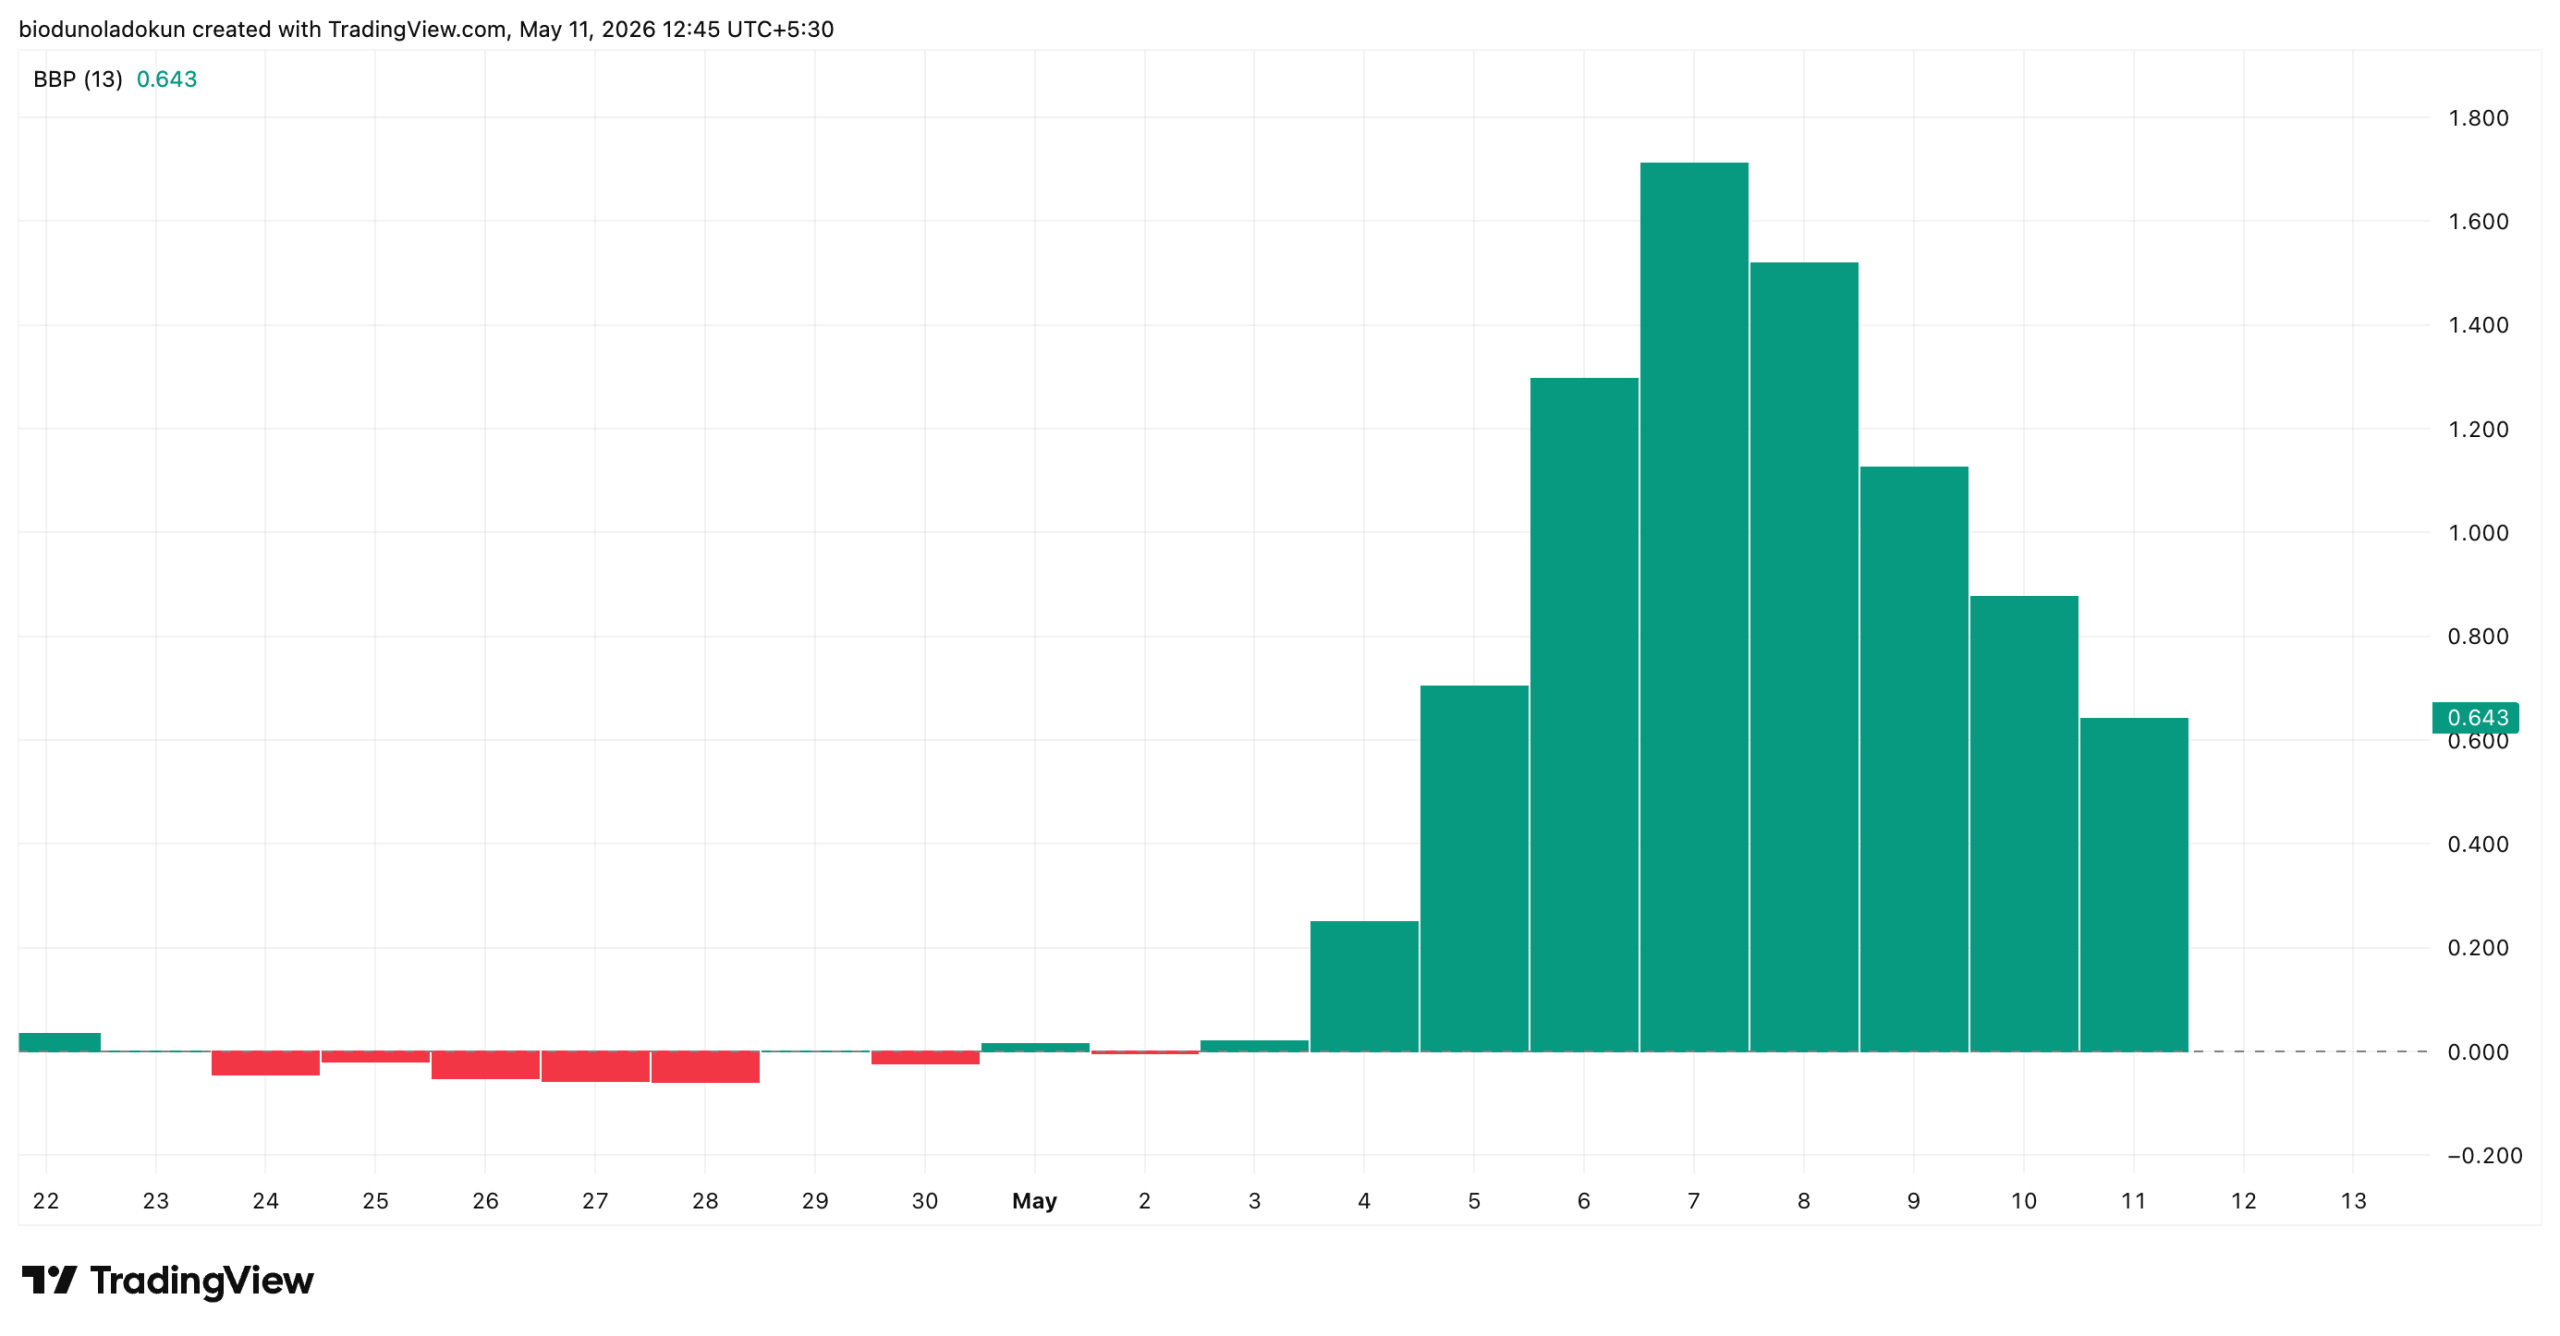
On the daily chart, TON’s Bull-Bear Power (BBP) has started rolling over, signaling that buy-side pressure is fading.
The indicator measures the balance between buying pressure (Bull Power) and selling pressure (Bear Power) in the market.
A positive reading suggests buyers are in control and an uptrend is forming.
When it turns negative, sellers are dominant, and downside risk increases.
Readings from TON’s BBP show that its green histogram bars expanded sharply from May 4 and peaked at roughly 1.71 on May 7 — the same day TON clinched its $2.90 high.
Since then, the bars have shrunk in each successive session.
The reading is still positive at press time, meaning bulls remain marginally in control.
However, the steady decline in bar size shows demand is falling session by session.
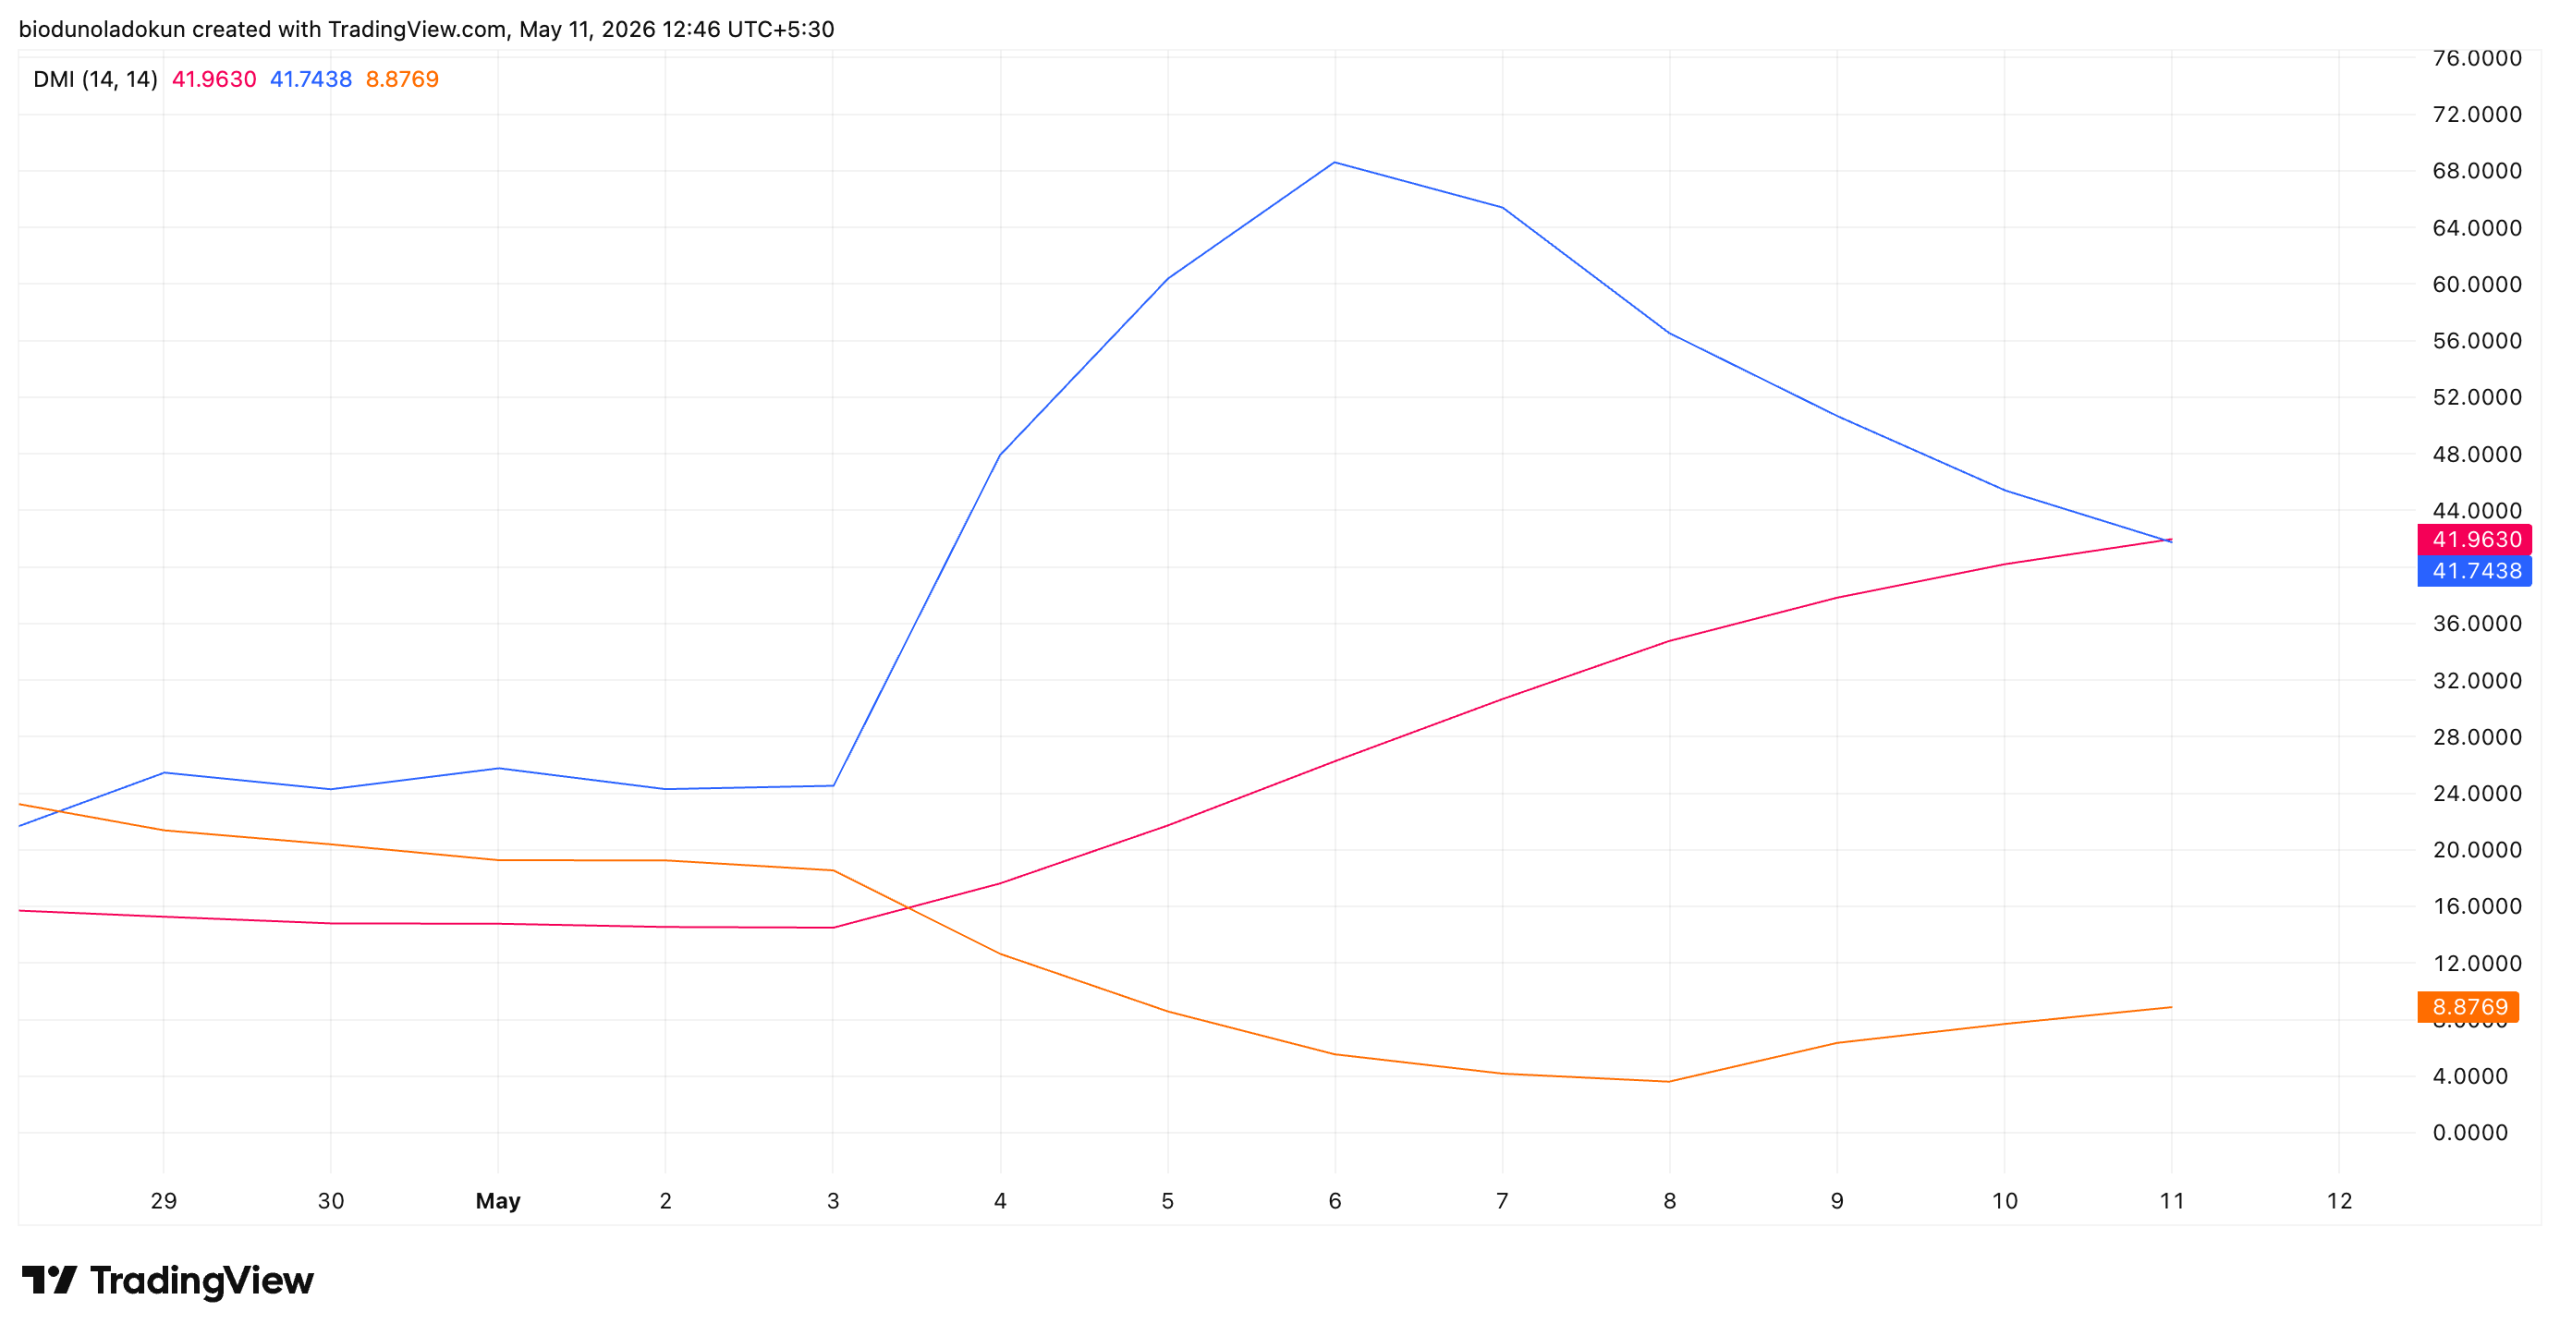
Further, TON’s Directional Movement Index (DMI) supports this bearish outlook, with the positive directional index (+DI) having crossed below the negative directional index (-DI) during today’s session.
The DMI indicator measures the strength of an asset’s price trend.
It consists of two lines: the +DI, which represents upward price movement, and the -DI, which means downward price movement.
When the +DI line breaks below the -DI, especially after a price rally to a multi-month high, it signals an early trend reversal.
It indicates that bearish pressure has overtaken bullish momentum.
This trend carries more weight as TON’s Average Directional Index (ADX; orange) is rising at the same time, confirming that the new bearish move has genuine strength.
TON Price Prediction: Path to $3 Just Got Steeper
TON currently trades at $2.29, having broken below the 0.618 Fibonacci level at $2.52.
The breach is significant because the 0.618 retracement is widely regarded as the “golden ratio,” and a daily close below it marks the move from a healthy pullback to a deeper corrective phase.
TON’s next major support sits at $2.152.
A break here would open the door to $1.774, effectively erasing most of the post-announcement rally.
Disclaimer:
The information provided in this article is for informational purposes only. It is not intended to be, nor should it be construed as, financial advice. We do not make any warranties regarding the completeness, reliability, or accuracy of this information. All investments involve risk, and past performance does not guarantee future results. We recommend consulting a financial advisor before making any investment decisions.
Abiodun Oladokun is a Research Analyst at CCN, where he covers cryptocurrency markets with a focus on on-chain analysis, technical assessments, and emerging trends across decentralized finance (DeFi), real-world assets (RWA), artificial intelligence (AI), decentralized physical infrastructure networks (DePIN), Layer 2s, and meme coins.
Prior to CCN, he served as a Senior On-Chain Analyst at BeInCrypto, producing market reports spanning diverse crypto sectors.
Before that, he conducted technical analysis and market assessments of various altcoins at AMBCrypto, where he also contributed long-form quarterly research papers on DeFi, NFTs, DAOs, and scaling architectures, leveraging on-chain platforms including Messari, Santiment, DefiLlama, and Dune Analytics.
He began his crypto career as a research analyst at SixthSense DAO, developing blockchain forensic tools to trace the history of stolen assets.
Abiodun is a lawyer called to the Nigerian Bar and the founder of Ilé Ijó, a Lagos-based electronic dance music collective.