Crypto’s Worst Day Turns One: 5 Signals That Could Decide Whether 10/10 Happens Again
Share
Key Takeaways
Bitcoin surged to a five-month high of $82,784 before sharply reversing below $80,000, with on-chain data suggesting a sustained supply overhang at that level.
Short-term holders are selling at a profit, miner reserves have hit a 30-day low, and $93.87 million in long liquidations have compounded the sell-side pressure over the past two sessions.
Bitcoin’s Bull-Bear Power has flipped negative, and the Aroon Down Line is at 92.86%, with key support at $79,135 and $74,857 if bearish momentum continues.
Bitcoin price surged to a five-month high of $82,784 two sessions ago before reversing sharply, pulling back below the psychological $80,000 mark.
At press time, the BTC was trading at $79,732, down 2% over the past 24 hours.
The rejection around the $82,000 level points to a significant supply overhang that may continue to beat down the price in the meantime.
Here’s what you need to know.
BTC Short-Term Holders Are Selling at a Profit
Multiple on-chain signals now suggest BTC could struggle to reclaim and hold above $80,000 in the near term.
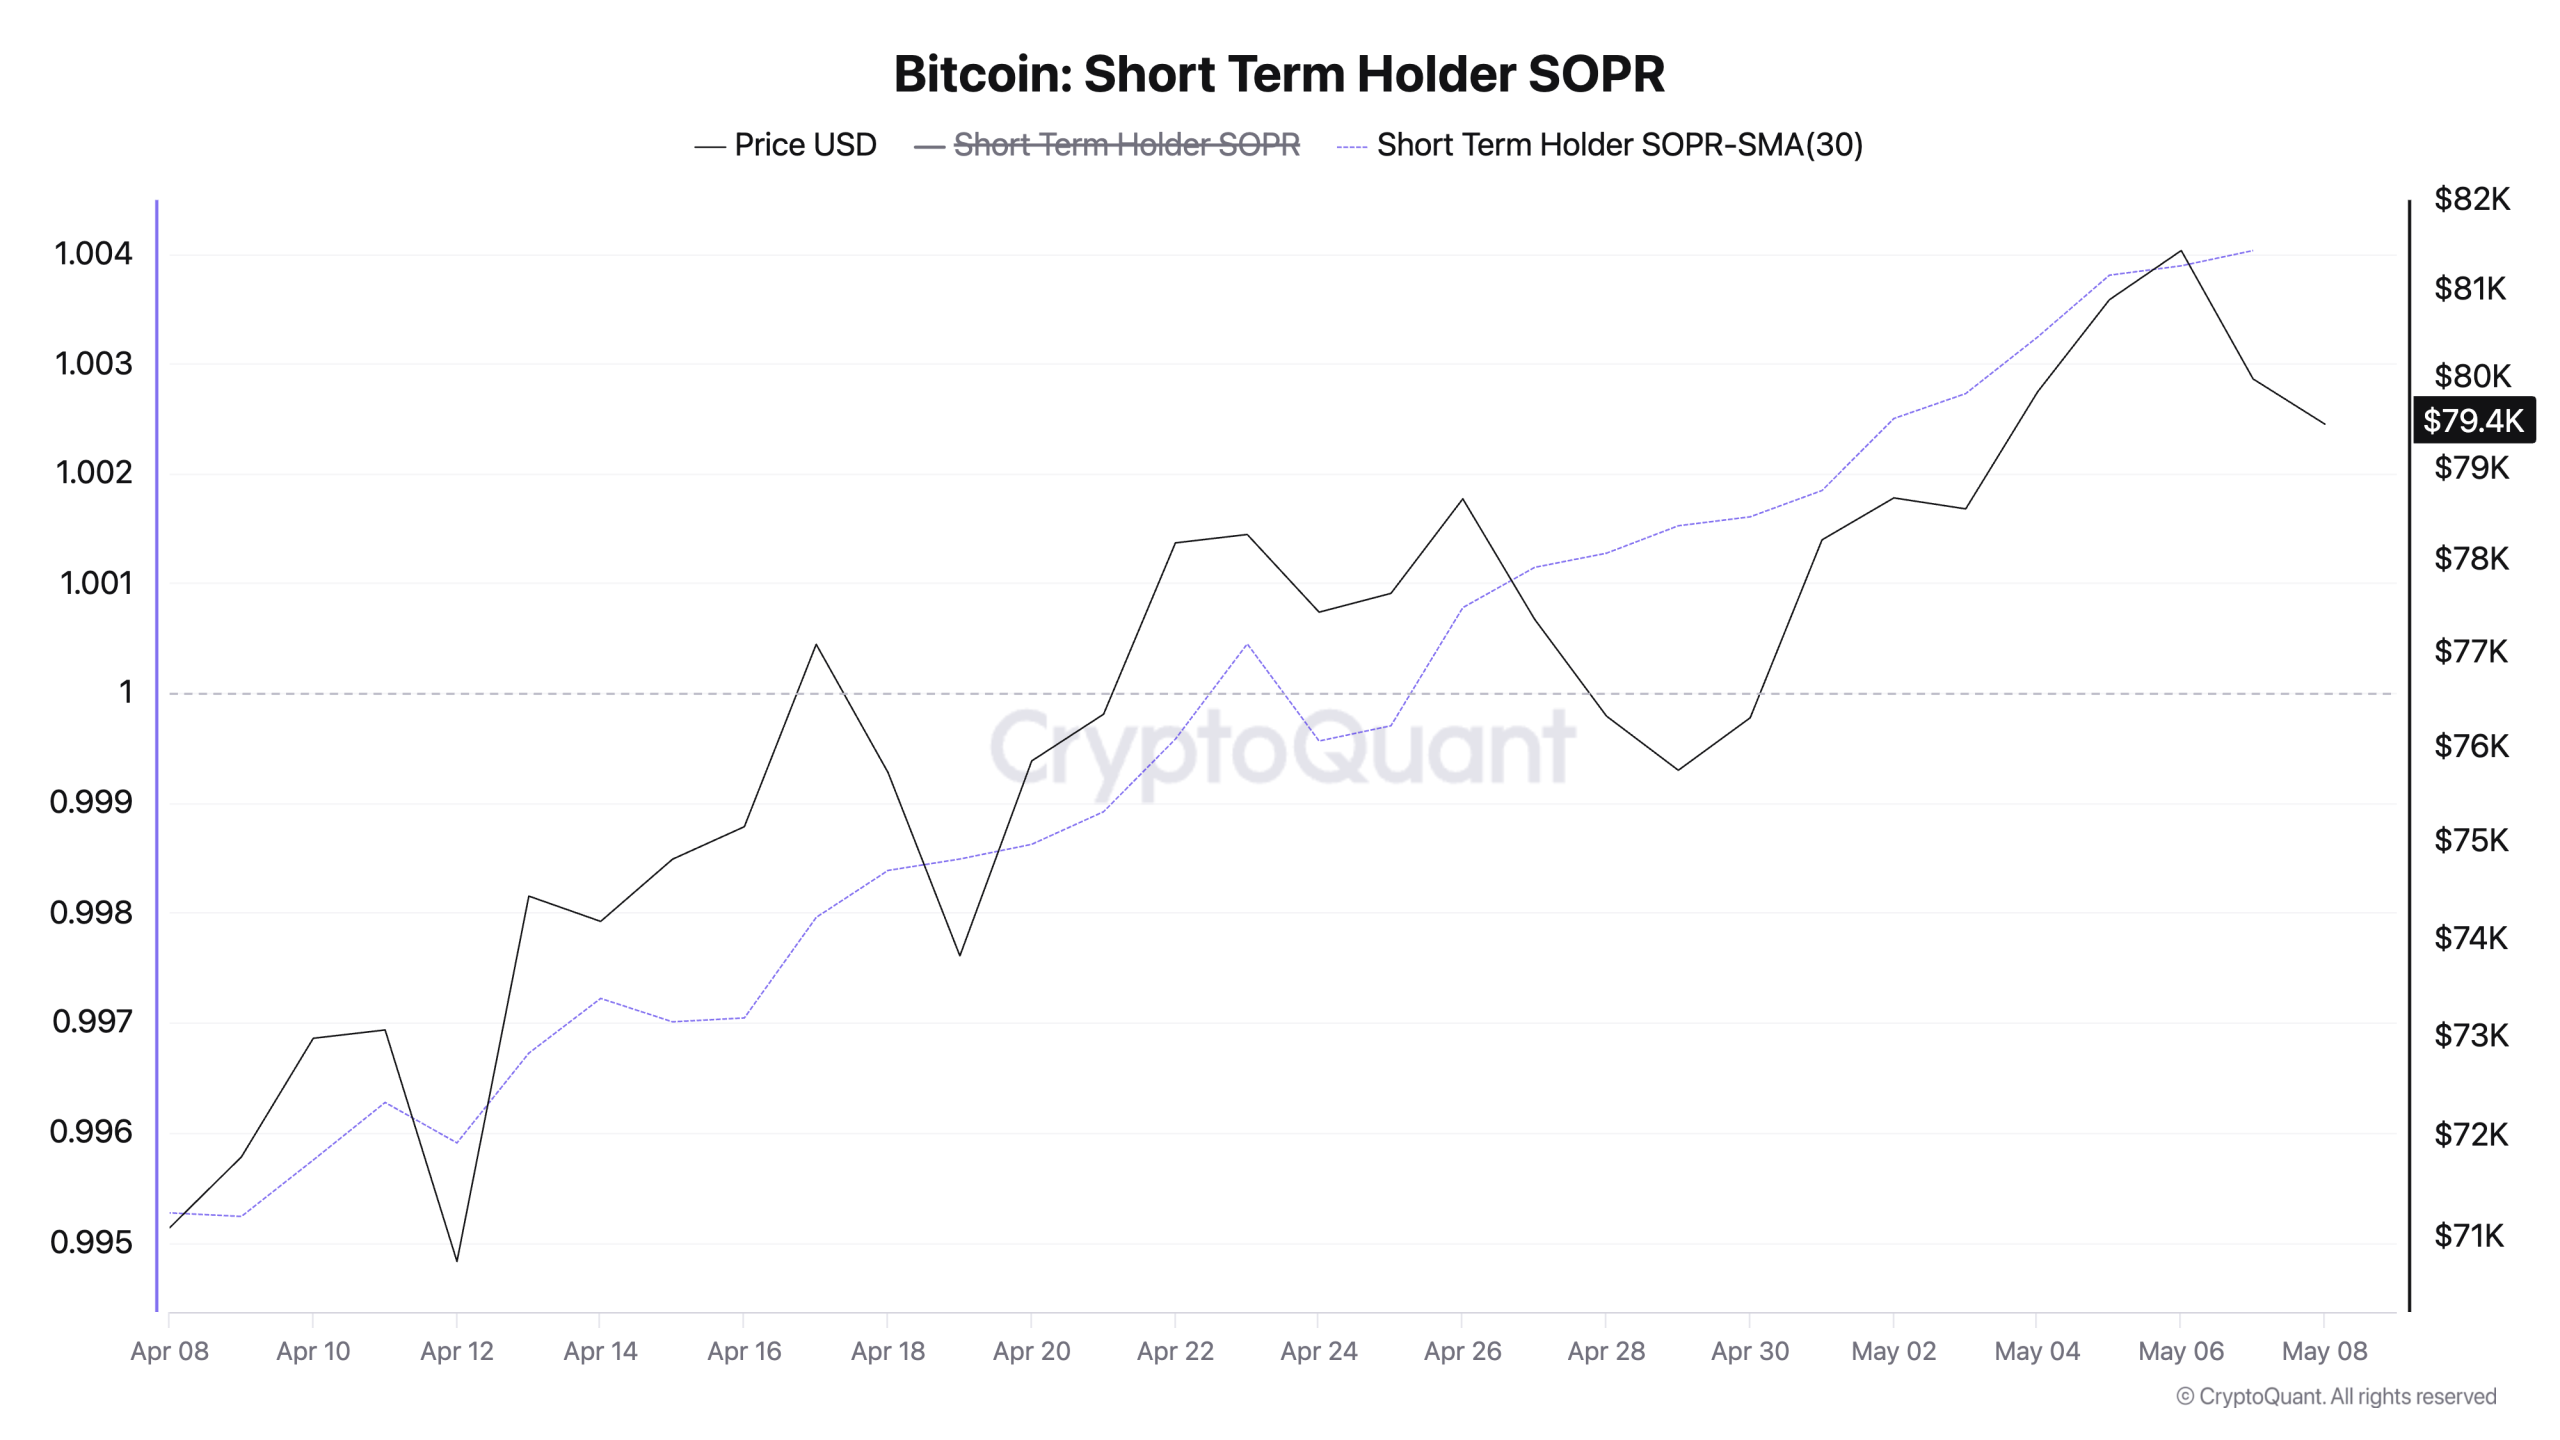
One of the clearest warning signs comes from BTC’s Short-Term Holder Spent Output Profit Ratio (STH-SOPR), measured on a 30-day moving average.
Try Our Recommended Crypto Exchanges
Sponsored
Disclosure
We sometimes use affiliate links in our content, when clicking on those we might receive a commission at no extra cost to you. By using this website you agree to our terms and conditions and privacy policy.
According to CryptoQuant’s data, the metric has climbed and remained above 1 since late April — a reading that signals short-term holders are consistently selling at a profit.
At press time, it stands at a year-to-date high of 1.
Bitcoin Short Term Holder SOPR | Credit: CryptoQuant
The STH-SOPR gauges the profitability of the short-term holders of a particular crypto asset.
It generally provides insights into whether investors who have held a specific asset for 3 to 6 months are in profit.
If the STH-SOPR is below 1, it suggests that these holders are selling at a loss.
Conversely, if it prints above 1, short-term holders are, on average, selling their assets at a profit.
At 1 as of this writing, BTC’s STH-SOPR suggests that investors who have held their coins for less than six months are, on average, selling at a profit.
This matters because STHs are among the most reactive participants in the market. Unlike long-term holders, who tend to accumulate during drawdowns and rarely capitulate, STHs are highly sensitive to price movements and quick to lock in gains when the opportunity presents itself.
If this pattern of profit-taking continues, it could prevent any meaningful BTC price recovery attempt in the near term.
BTC Miner Reserves Hit 30-Day Low as Sellers Lock In Gains
CCN’s assessment of mining activity on the Bitcoin network confirms that miners are contributing to the coin’s current downtrend.
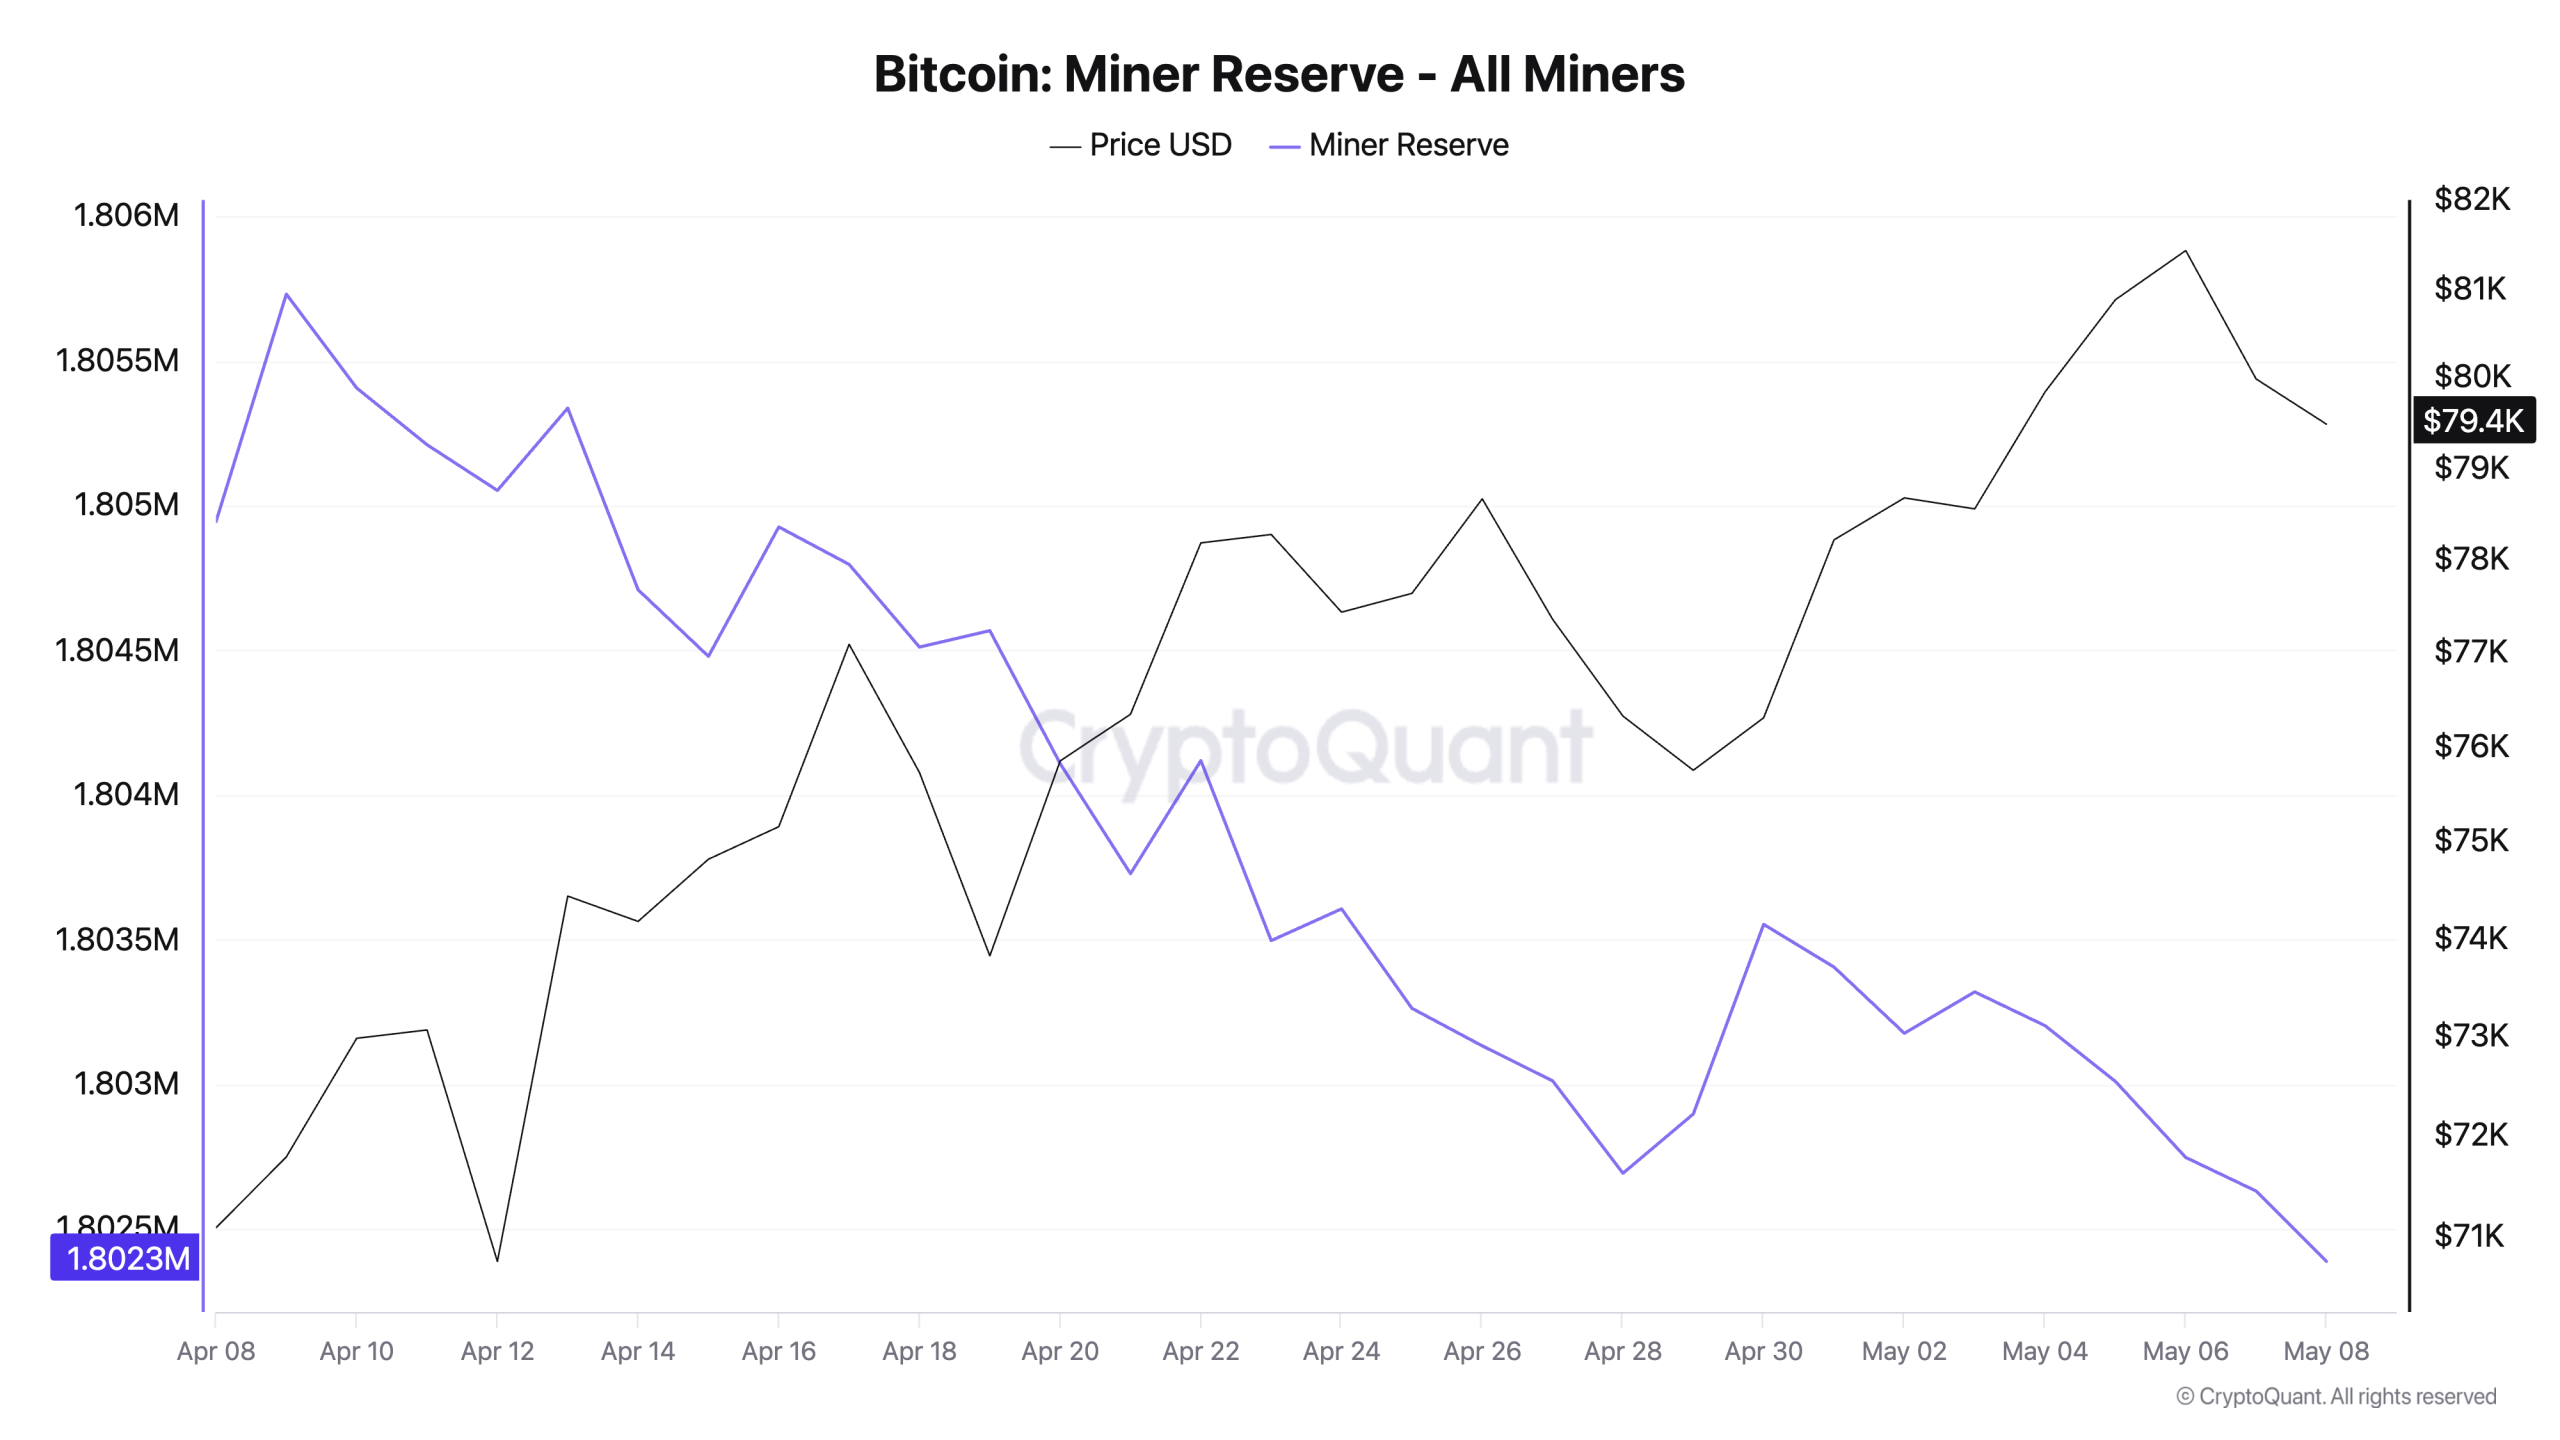
CryptoQuant’s data show that as BTC’s price gradually recovered over the past month — driven mostly in part by optimism around ceasefire negotiations — miners steadily distributed their holdings into rising prices.
With geopolitical tensions now appearing to re-escalate and the prospect of renewed conflict on the table, selling has intensified.
Miner reserves fell to a 30-day low as of May 7, suggesting the cohort is moving to lock in gains at elevated levels rather than holding.
The BTC miner reserve tracks the number of coins held in miners’ wallets. It represents the coin reserves miners have yet to sell.
When the metric climbs, it signals miners are holding onto more of their mined coins, indicating confidence in future price increases.
Conversely, when the reserve declines like this, miners are moving coins out of their wallets, usually to sell, confirming the growing bearish sentiment against BTC.
Leverage Unwind Is Driving BTC’s Dip
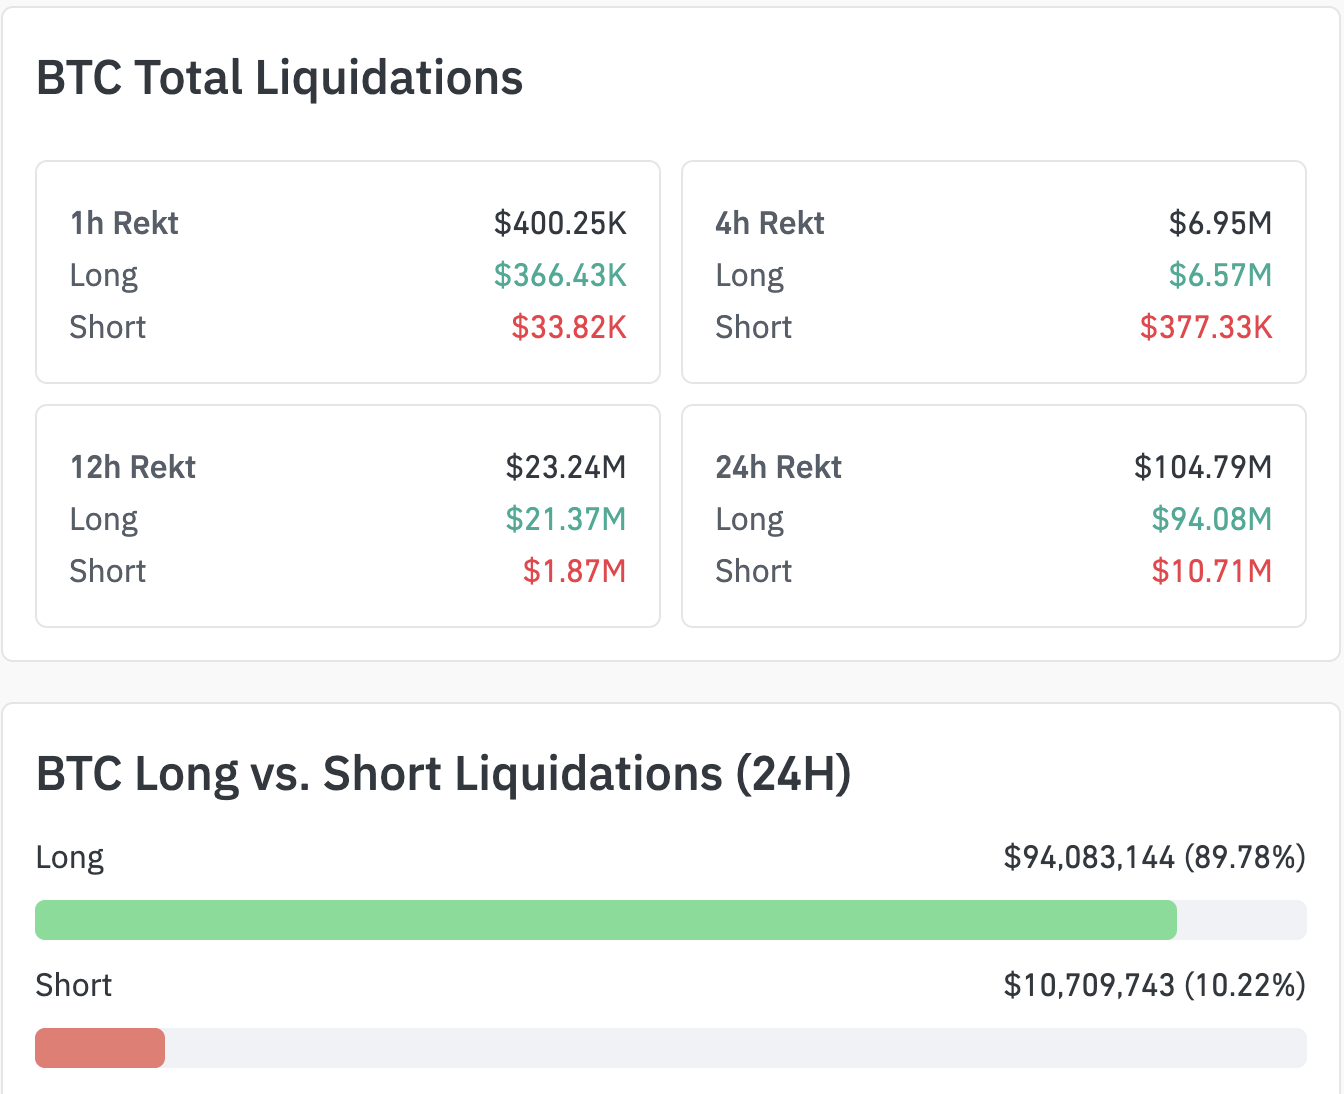
The cascade of long liquidations that have followed BTC’s price decline over the past two sessions has also amplified its current dip.
As the price stalled near the $82,000 resistance zone and began to slip, traders who had opened leveraged long positions were automatically liquidated as the market moved against them.
According to Coinglass, in the past 24 hours alone, total BTC liquidations across the market reached $105.45 million.
Long positions accounted for $93.87 million in liquidations, compared with just $11.58 million in short liquidations.
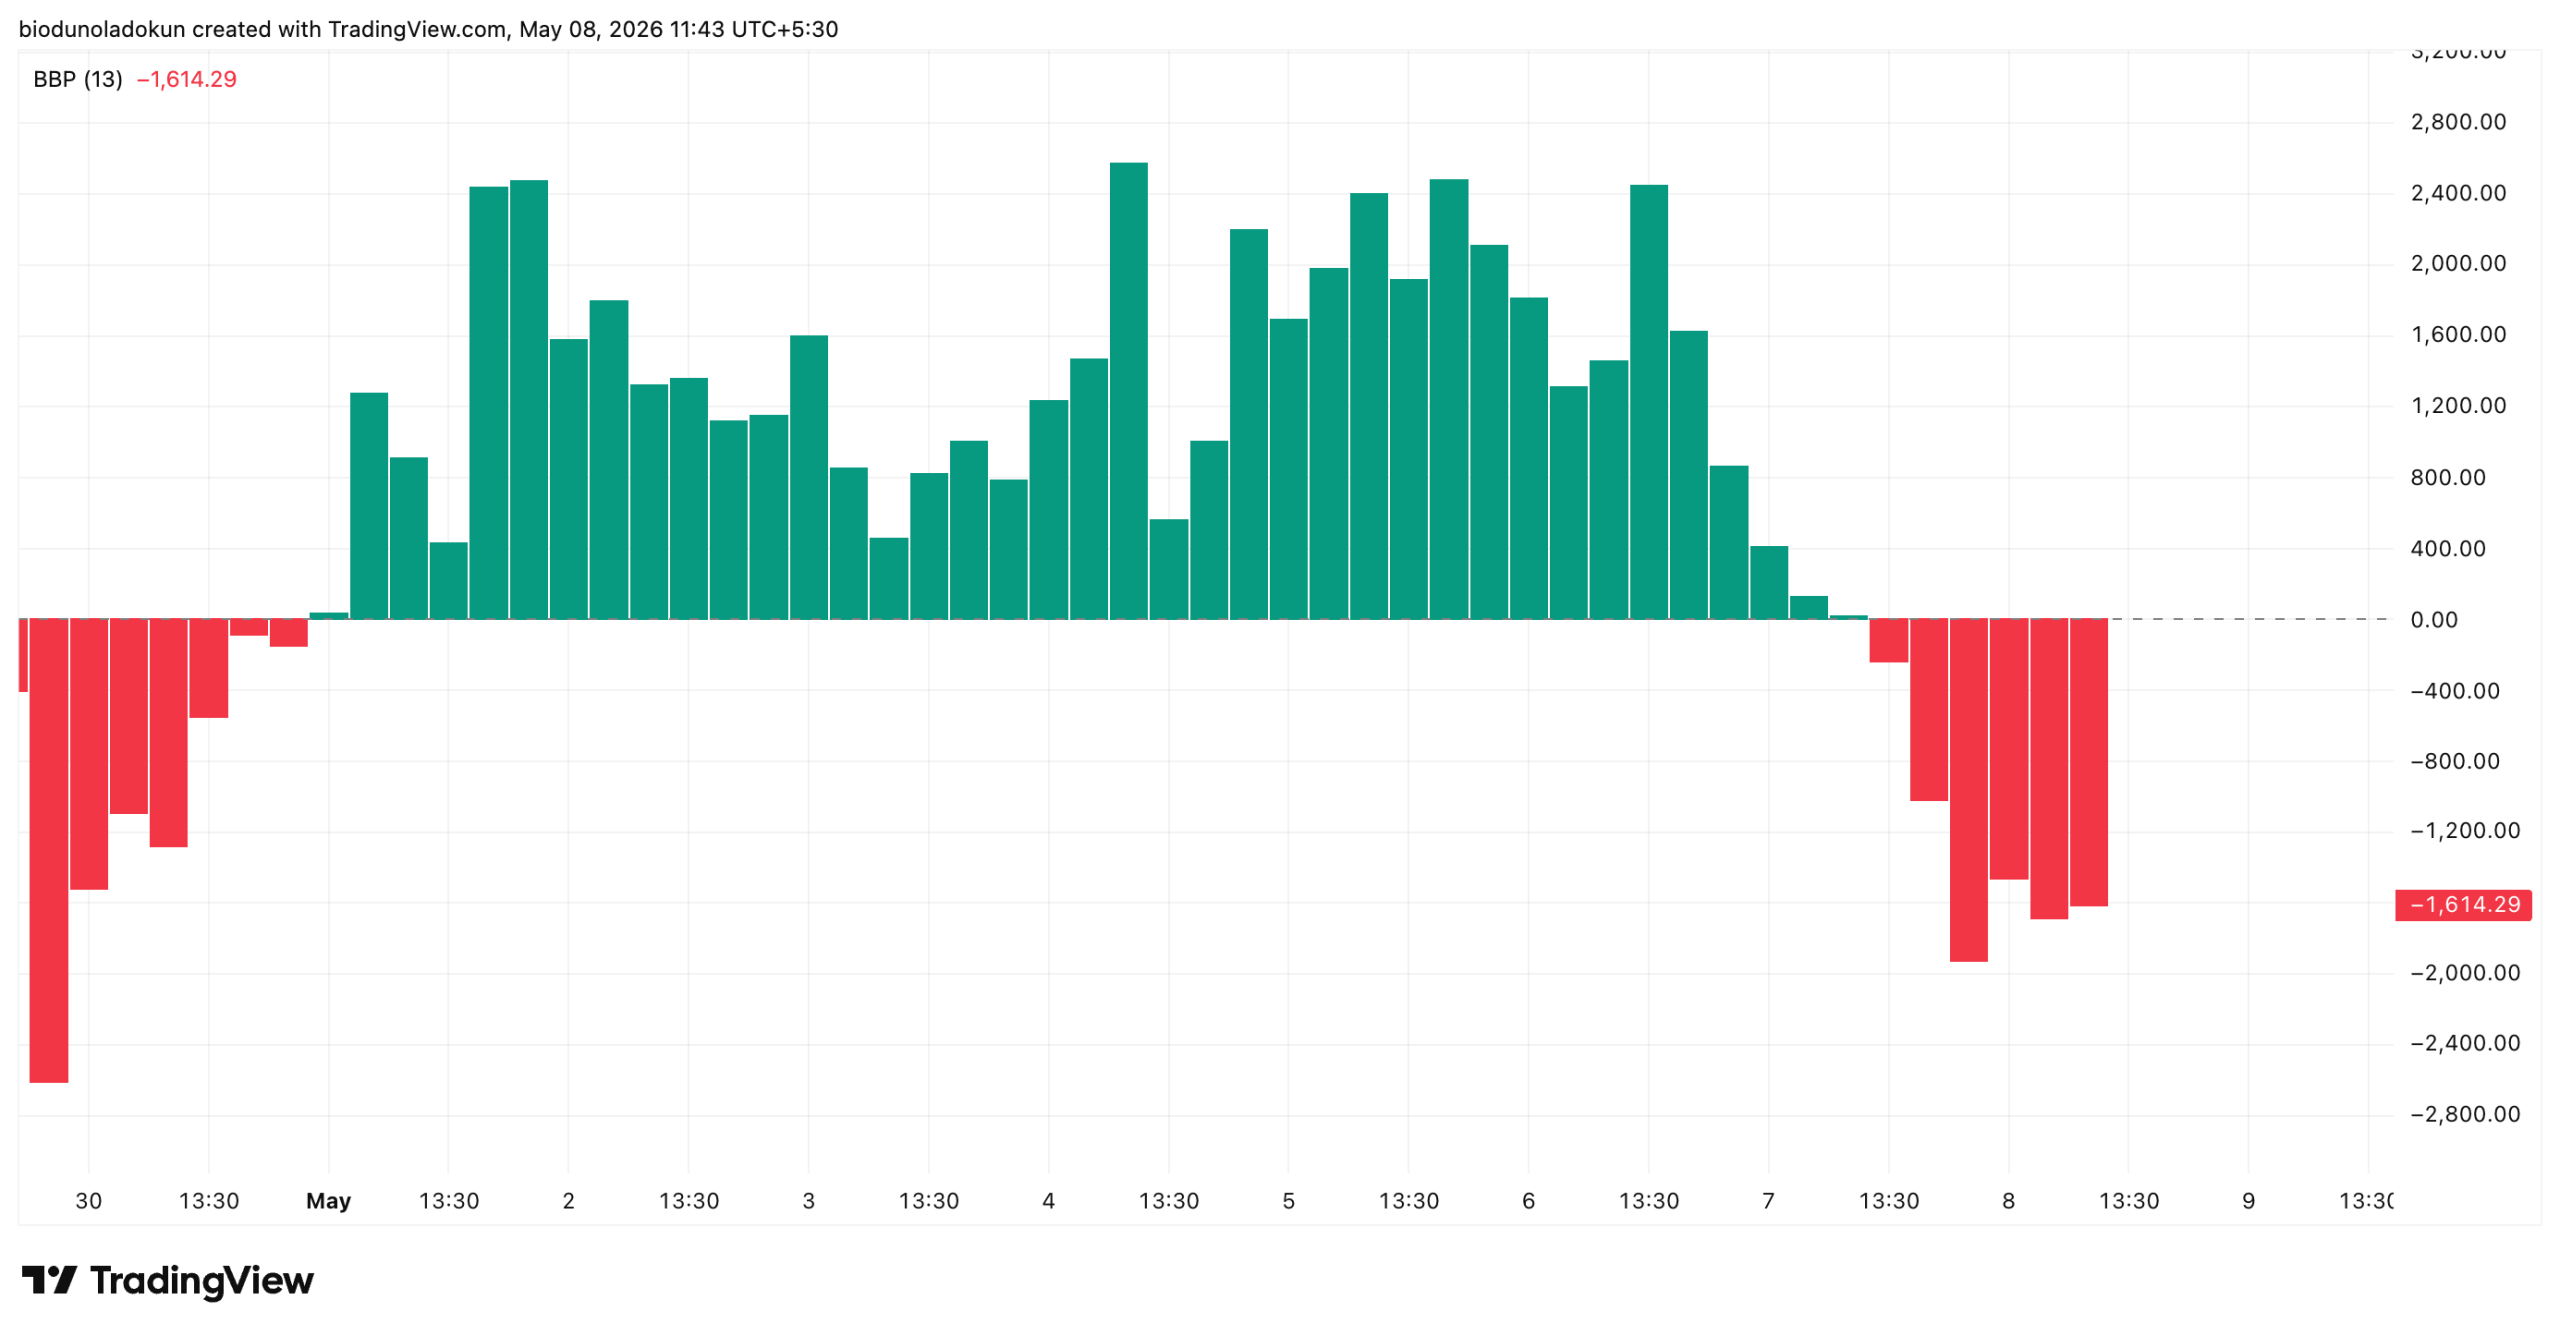
This indicator measures the balance of strength between bulls and bears in the market.
When BBP returns a positive value, buying pressure outweighs selling pressure, suggesting bullish momentum and the potential for continued upside.
When it turns negative, bears have wrested control, and selling pressure is dominating price action.
From May 1 through May 6, BTC’s BBP held consistently in positive territory, a period that aligned with the coin’s grind toward its five-month high.
But since May 7, the indicator has collapsed into the red, reflecting the surge in bearish conviction among spot traders.
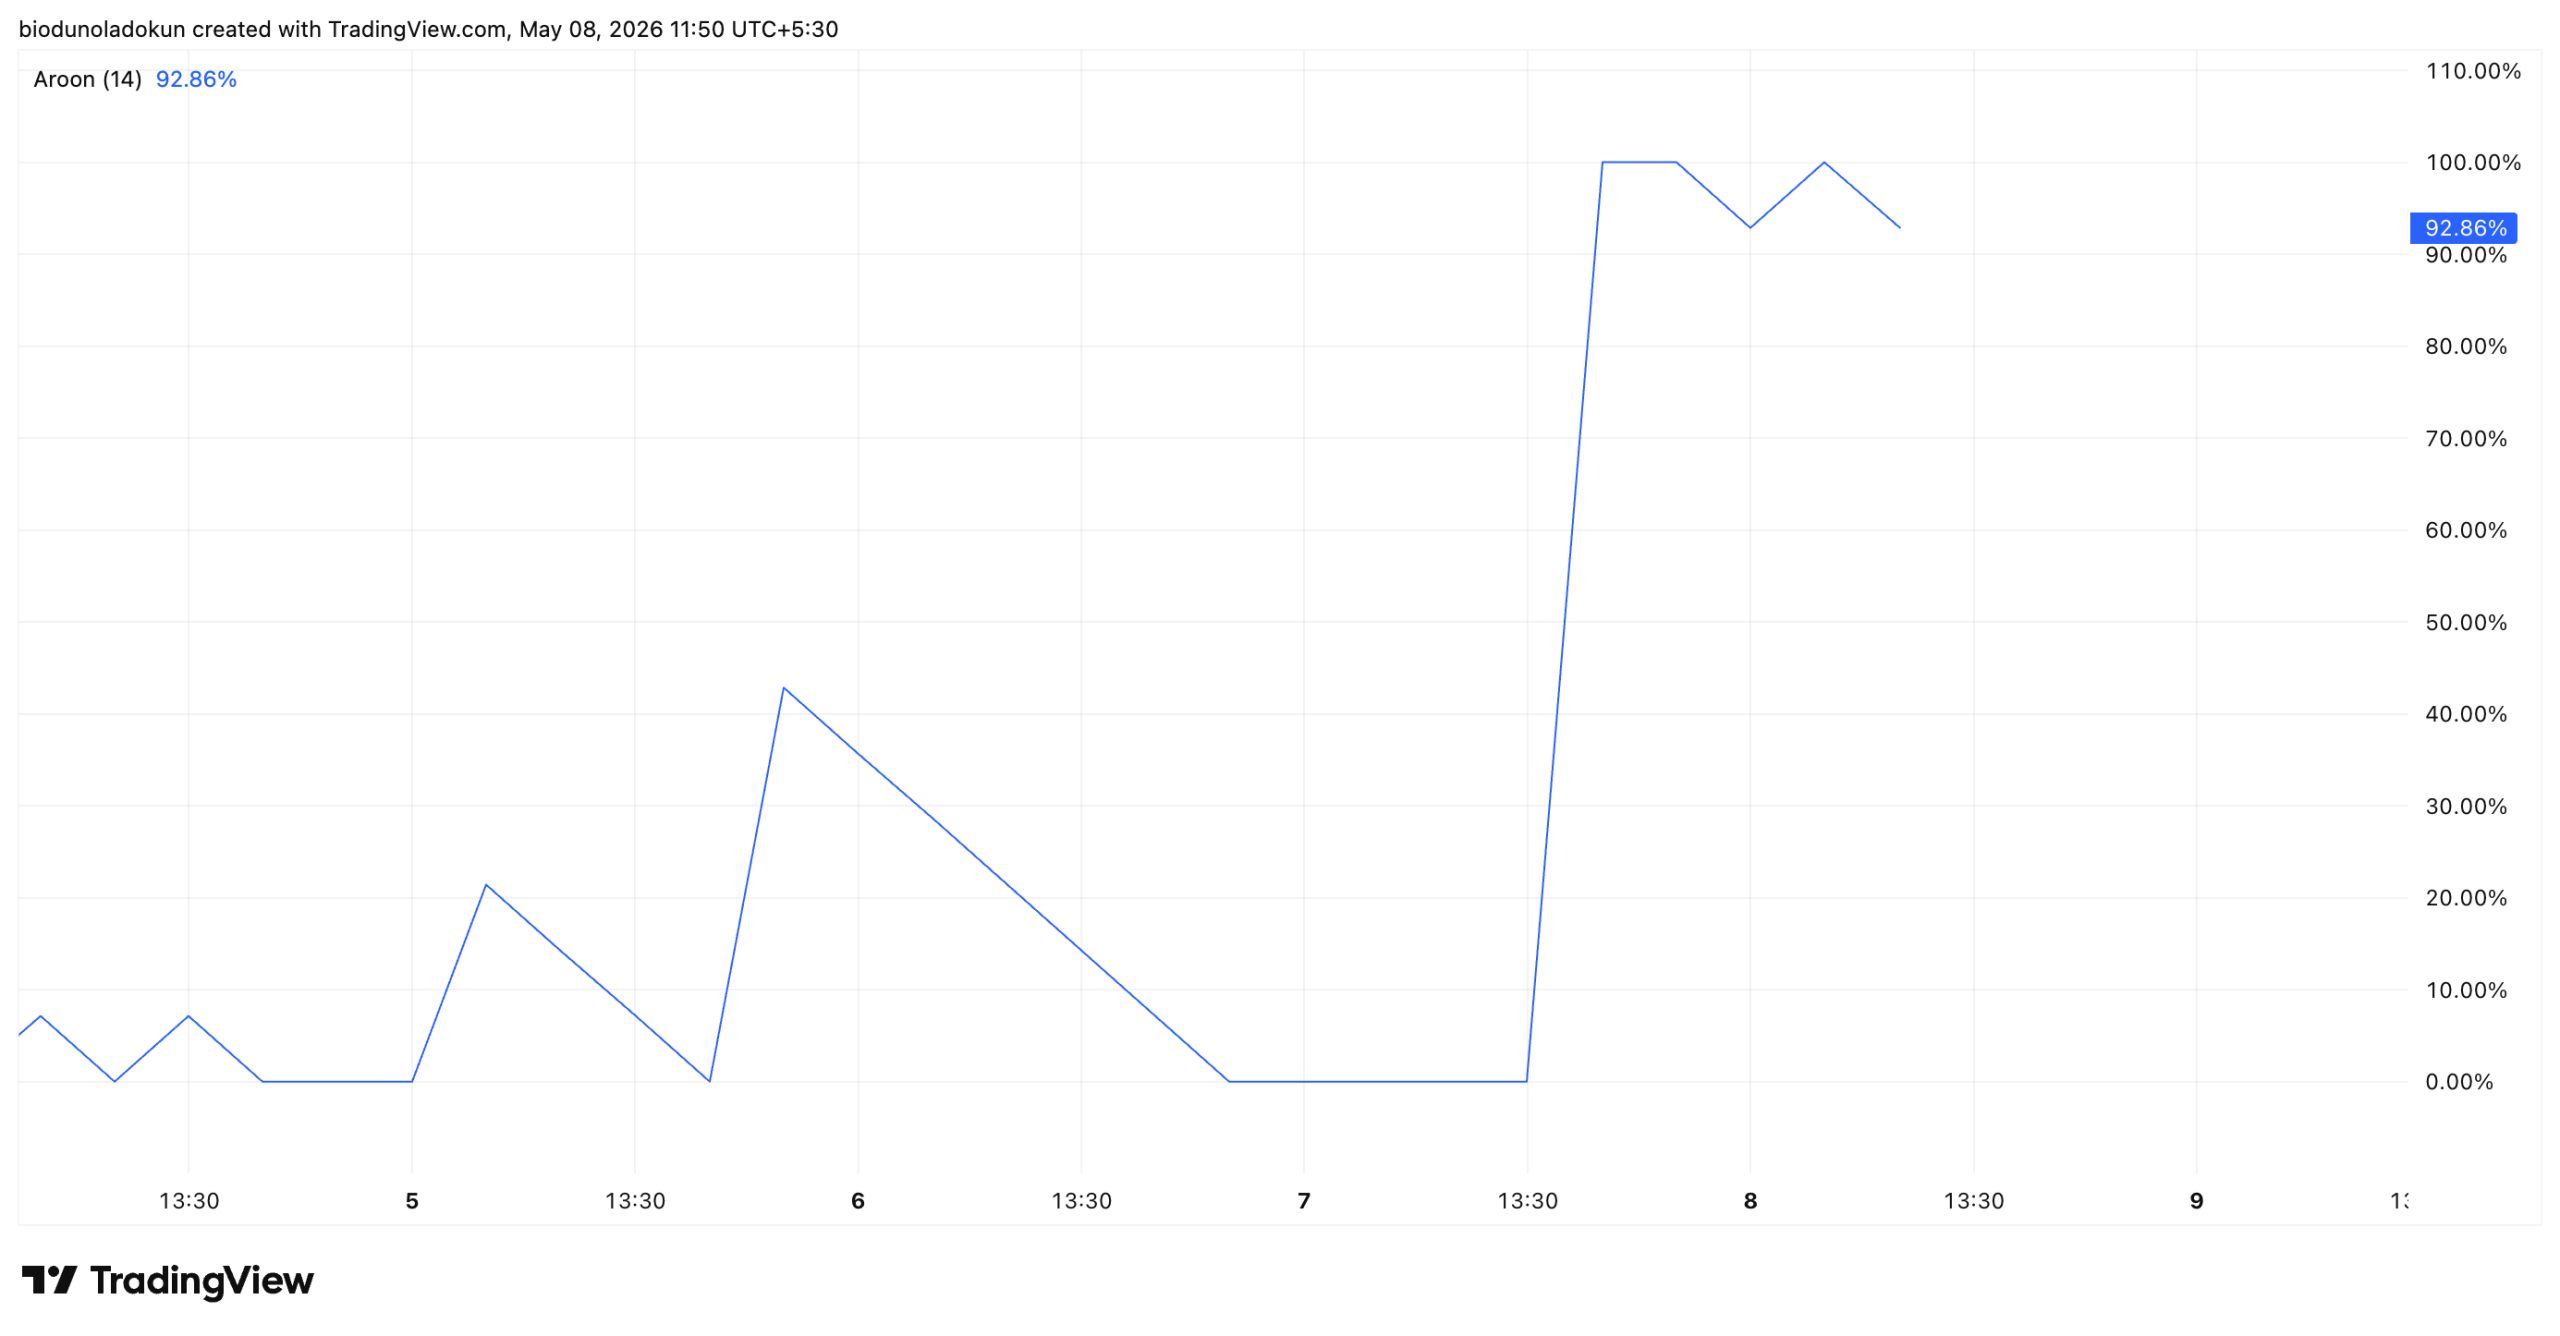
Moreover, BTC’s Aroon Down Line, which is near 100% (92.86%) as of this writing, supports this bearish outlook.
The Aroon indicator measures the strength and direction of a trend. It consists of two lines: the Aroon Up, which tracks the time since the last high, and the Aroon Down, which tracks the time since the previous low.
When the Aroon Down Line is near or at 100%, the asset has recently made a new low within the chosen period, indicating a strong downward trend.
This suggests that BTC sellers are firmly in control, and the current decline could continue.
BTC Price Prediction: Can BTC Reclaim $80K or Is $74K Next?
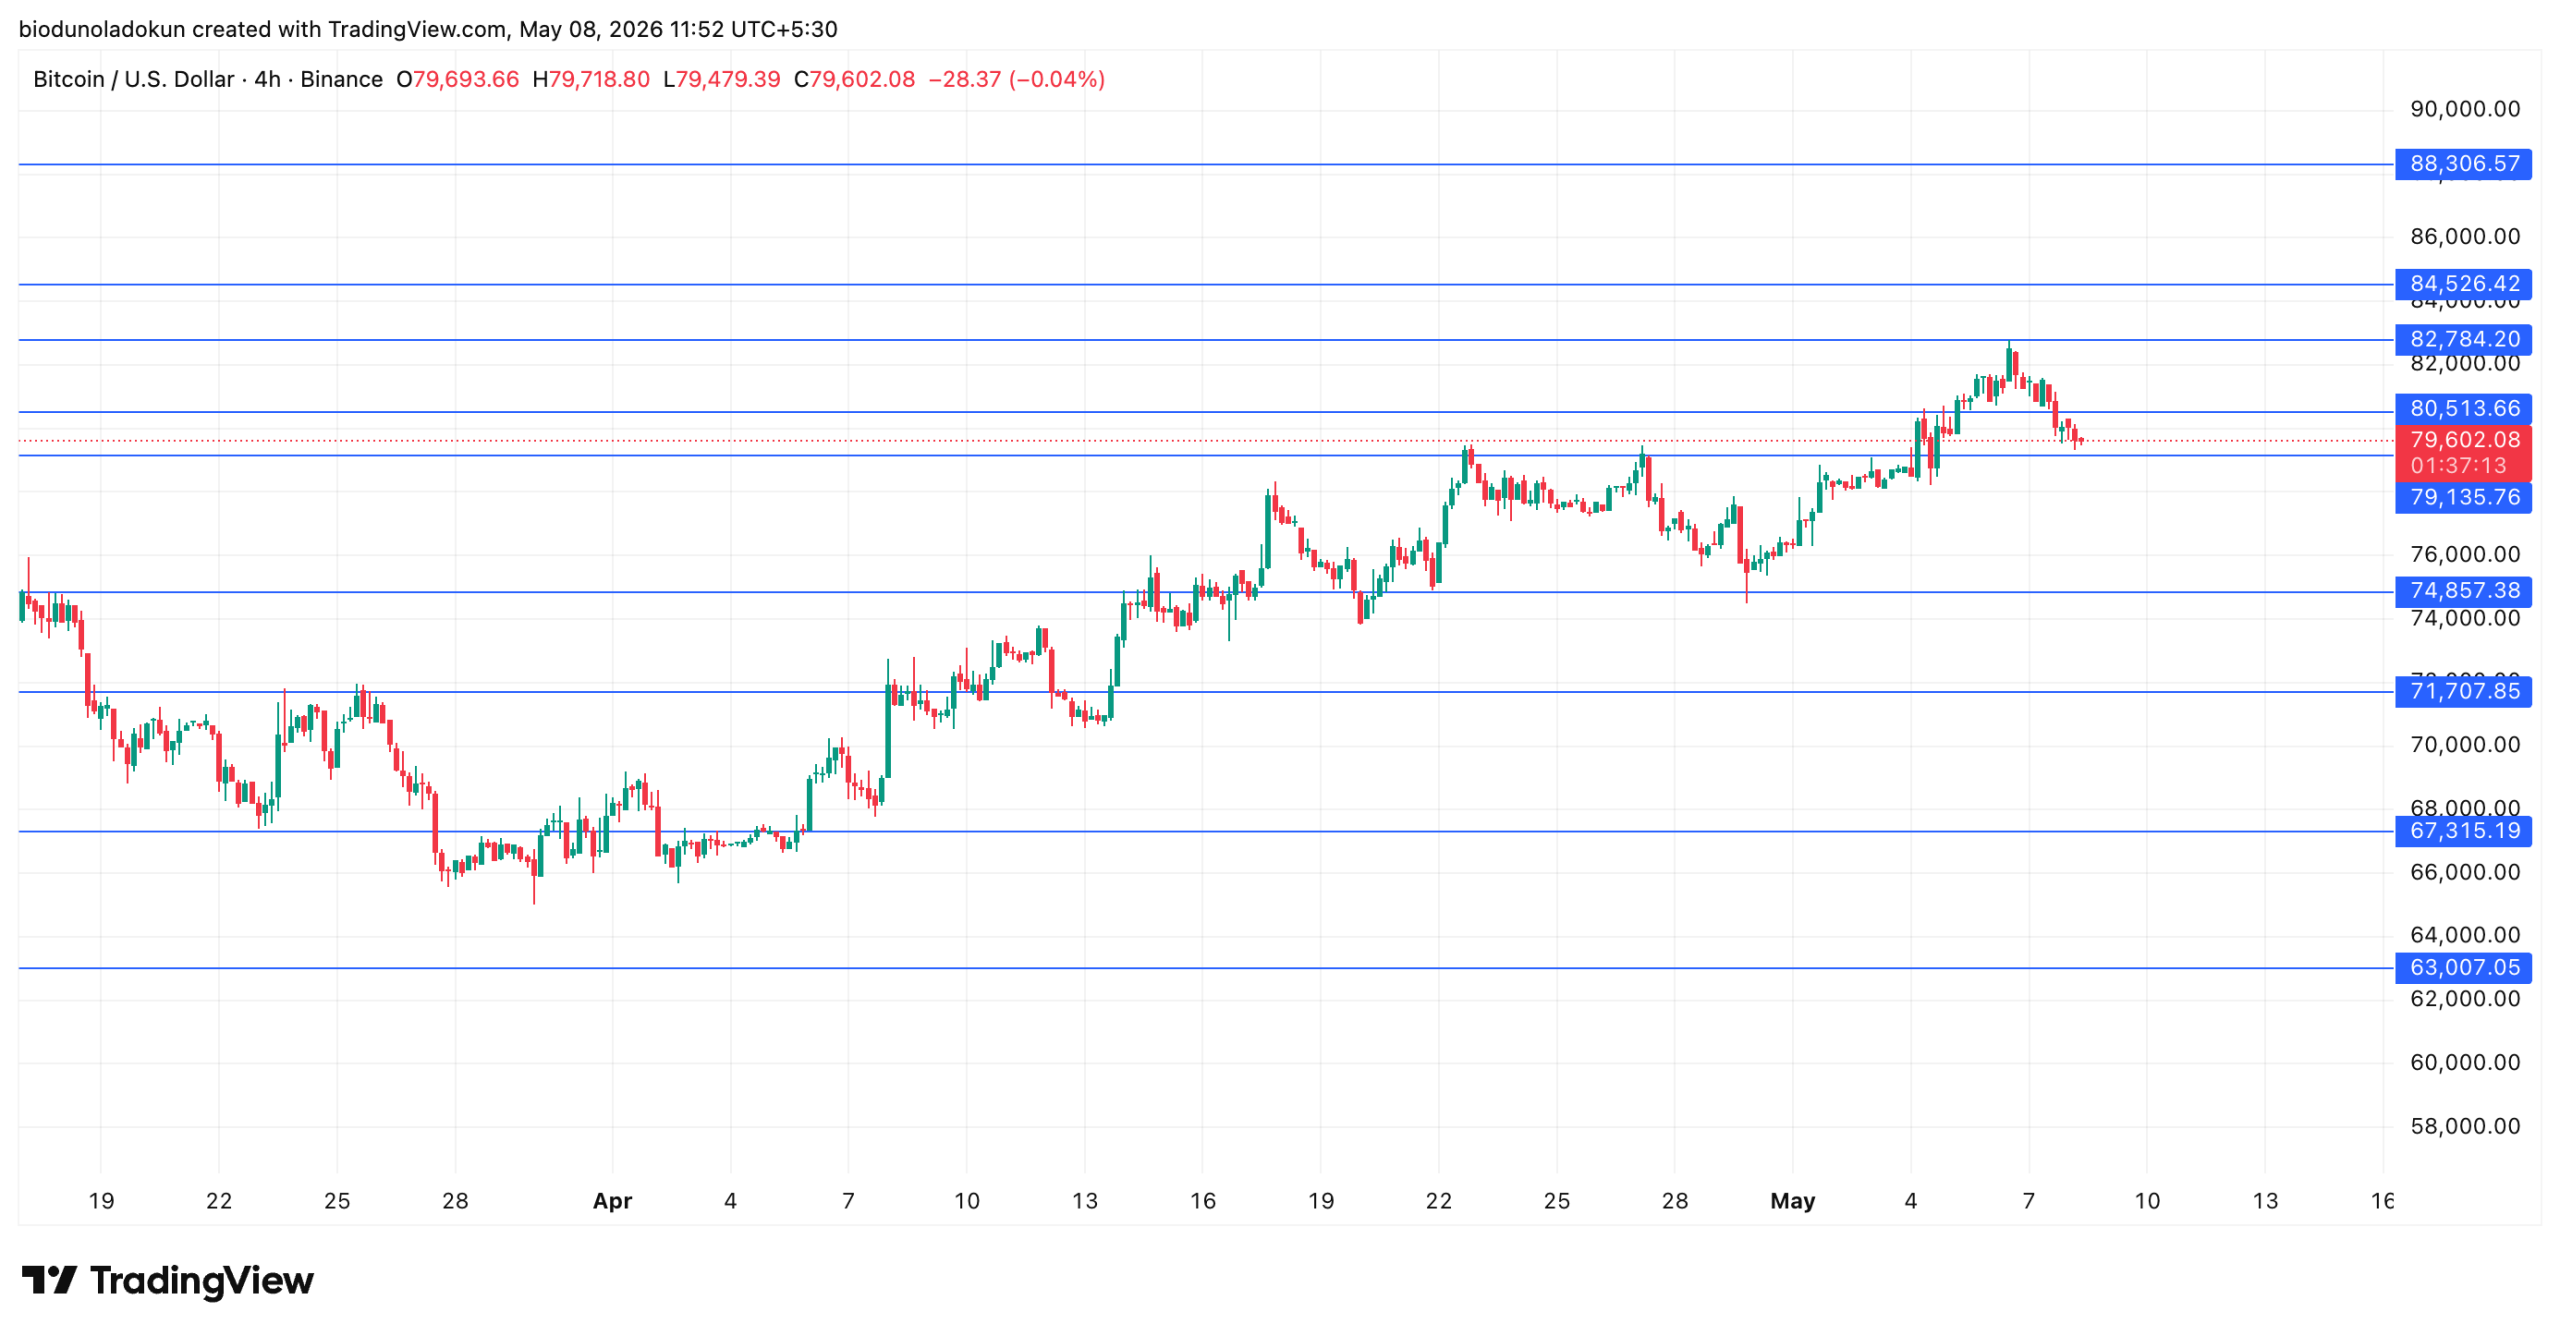
BTC currently hovers below the $80,513 resistance level on a four-hour chart.
Having been rejected at the five-month high of $82,784, the key question now is whether it can reclaim $80,513 as support or whether the current bearish structure deepens.
If sell-side pressure persists, the immediate downside levels to watch are $79,135, which is already being tested, followed by $74,857.
On the upside, reclaiming and closing above $80,513 would be the first sign that bulls are attempting to reassert control.
Disclaimer:
The information provided in this article is for informational purposes only. It is not intended to be, nor should it be construed as, financial advice. We do not make any warranties regarding the completeness, reliability, or accuracy of this information. All investments involve risk, and past performance does not guarantee future results. We recommend consulting a financial advisor before making any investment decisions.
Abiodun Oladokun is a Research Analyst at CCN, where he covers cryptocurrency markets with a focus on on-chain analysis, technical assessments, and emerging trends across decentralized finance (DeFi), real-world assets (RWA), artificial intelligence (AI), decentralized physical infrastructure networks (DePIN), Layer 2s, and meme coins.
Prior to CCN, he served as a Senior On-Chain Analyst at BeInCrypto, producing market reports spanning diverse crypto sectors.
Before that, he conducted technical analysis and market assessments of various altcoins at AMBCrypto, where he also contributed long-form quarterly research papers on DeFi, NFTs, DAOs, and scaling architectures, leveraging on-chain platforms including Messari, Santiment, DefiLlama, and Dune Analytics.
He began his crypto career as a research analyst at SixthSense DAO, developing blockchain forensic tools to trace the history of stolen assets.
Abiodun is a lawyer called to the Nigerian Bar and the founder of Ilé Ijó, a Lagos-based electronic dance music collective.