Will TROLL continue to rise? | Credit: Veronica Cestari
Share
Key Takeaways
TROLL surged more than 77% in 24 hours after breaking out of a bullish flag pattern.
Rising trading volume has pushed the token to its highest level since October 2025.
Holding above $0.085 could keep the structure intact, with targets near $0.16.
Solana-based memecoin TROLL is suddenly back in the spotlight after delivering one of the biggest memecoin breakouts of the week.
On Sunday, May 10, 2026, TROLL surged more than 77% in just 24 hours. This has pushed its market capitalization above $90 million, sending the price toward $0.10.
The explosive move comes after many traders had already assumed TROLL’s rally was over.
Instead, the token has now posted gains exceeding 632% over the last 30 days.
As a result, TROLL has hit its highest level since October 2025.
Here is why the Solana memecoin surged, and what could be next for the price?
TROLL Bull Flag Breakout Fuels Upside
One of the main catalysts behind the rally is what the community is calling a “float squeeze.”
Try Our Recommended Crypto Exchanges
Sponsored
Disclosure
We sometimes use affiliate links in our content, when clicking on those we might receive a commission at no extra cost to you. By using this website you agree to our terms and conditions and privacy policy.
According to on-chain data shared by FrostxXBT, wallets linked to centralized exchanges, including Coinbase and several tier-2 platforms, reportedly hold more than 22% of TROLL’s circulating supply.
At the same time, long-term holders don’t appear to be taking profits aggressively. Instead, many are continuing to accumulate, tightening the available supply even further.
That combination has created a relatively illiquid market structure where supply on the open market keeps shrinking while speculative demand continues to rise.
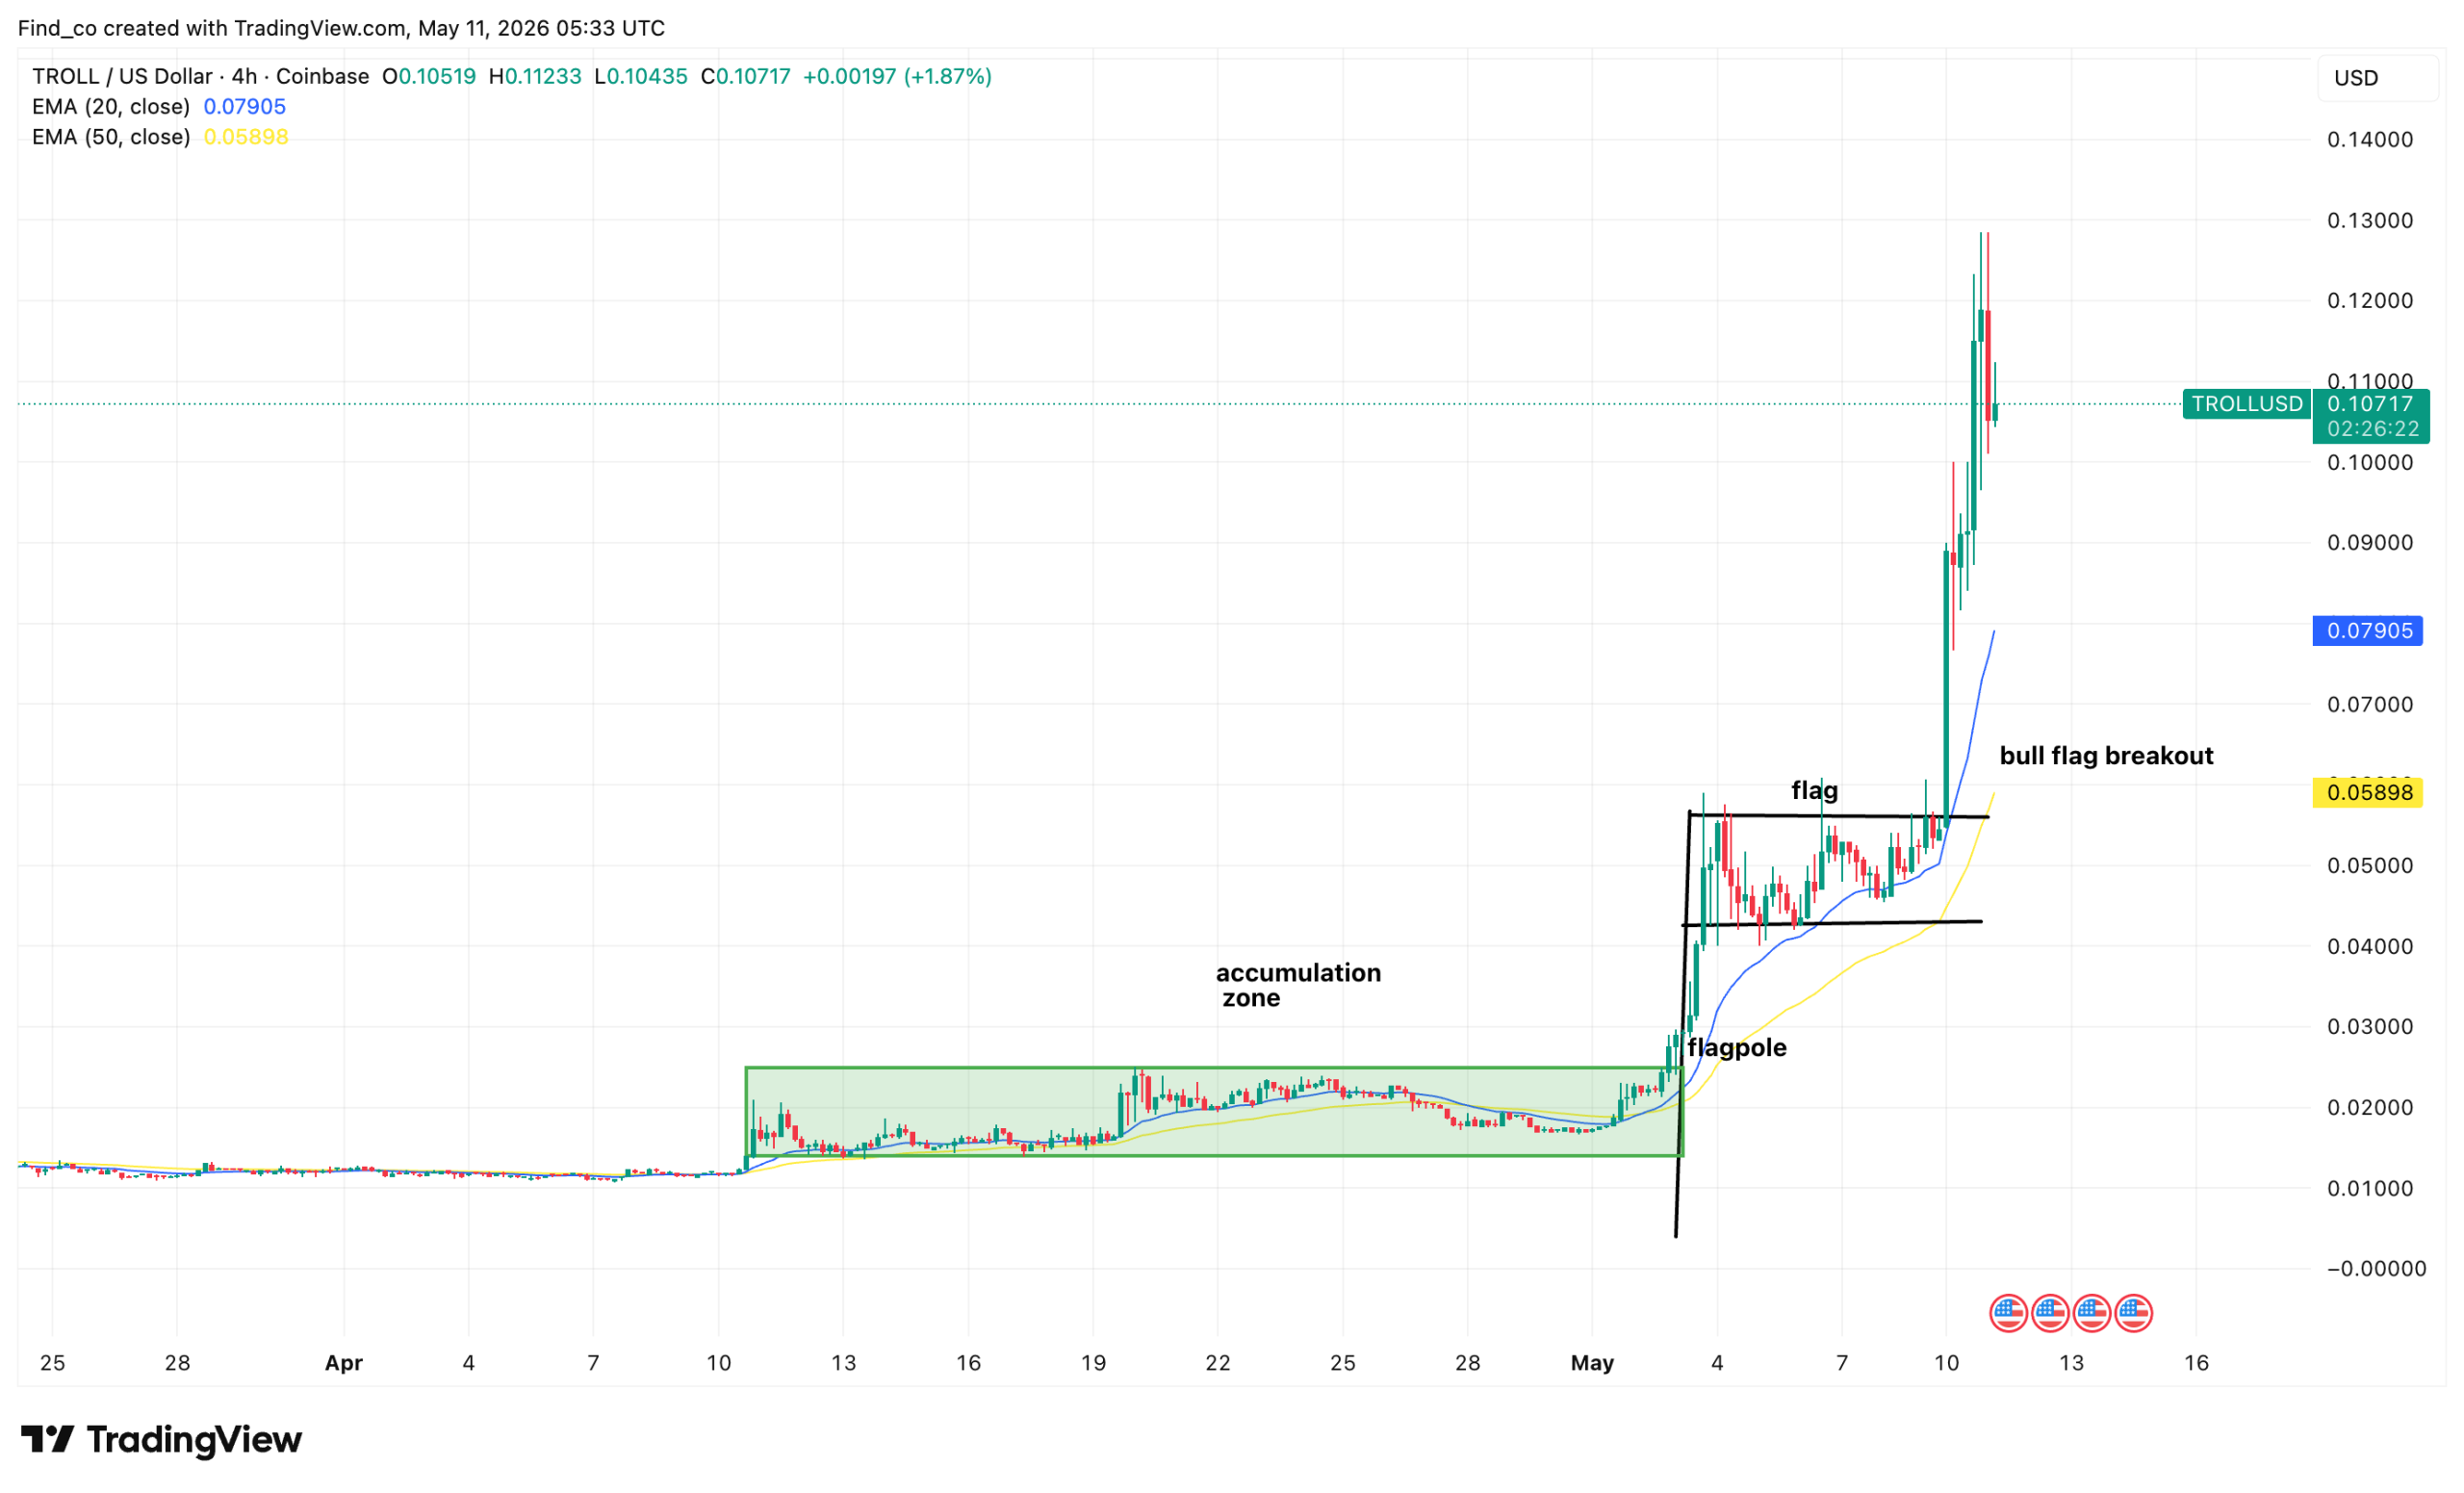
Following this setup, the 4-hour chart suggests TROLL has now transitioned from an extended accumulation phase into a breakout rally.
After spending several weeks consolidating between roughly $0.014 and $0.025, the token surged higher.
As buying volume increased, the price eventually broke above the upper trendline of the pattern.
At the time of writing, the overall structure still leans bullish. According to CCN’s analysis, that remains valid as long as TROLL holds above the breakout region near $0.065.
Meanwhile, both the 20 EMA and 50 EMA continue trending upward, reinforcing the strength of the current momentum.
If momentum continues, the next psychological region sits around $0.15. However, traders need to watch out.
Losing the bull flag would weaken the short-term structure and increase the likelihood of a cooldown toward the EMA support region.
Why Else Is TROLL Rising?
Besides that, the broader Solana memecoin ecosystem is also playing a major role in TROLL’s resurgence.
Over the past several weeks, Solana memecoins have seen a massive wave of speculative trading, driven by high-risk traders seeking the next 100x opportunity.
Following explosive rallies in trending Solana memecoins like Hantavirus, speculative capital has begun rotating into larger, more established memecoin projects with strong liquidity and viral communities.
As expected, the TROLL memecoin has emerged as one of the biggest beneficiaries of this trend.
Unlike many altcoins that remain heavily tied to Bitcoin’s movements, TROLL has shown independent momentum driven almost entirely by retail speculation.
Another key factor behind the rally is the token’s growing narrative momentum online.
Prominent accounts on X have increasingly branded TROLL as the “daddy of all memes,” referencing its alignment with classic internet trolling culture.
The branding campaign has helped fuel aggressive retail FOMO.
Volume, Sentiment, Offer Risk and Reward
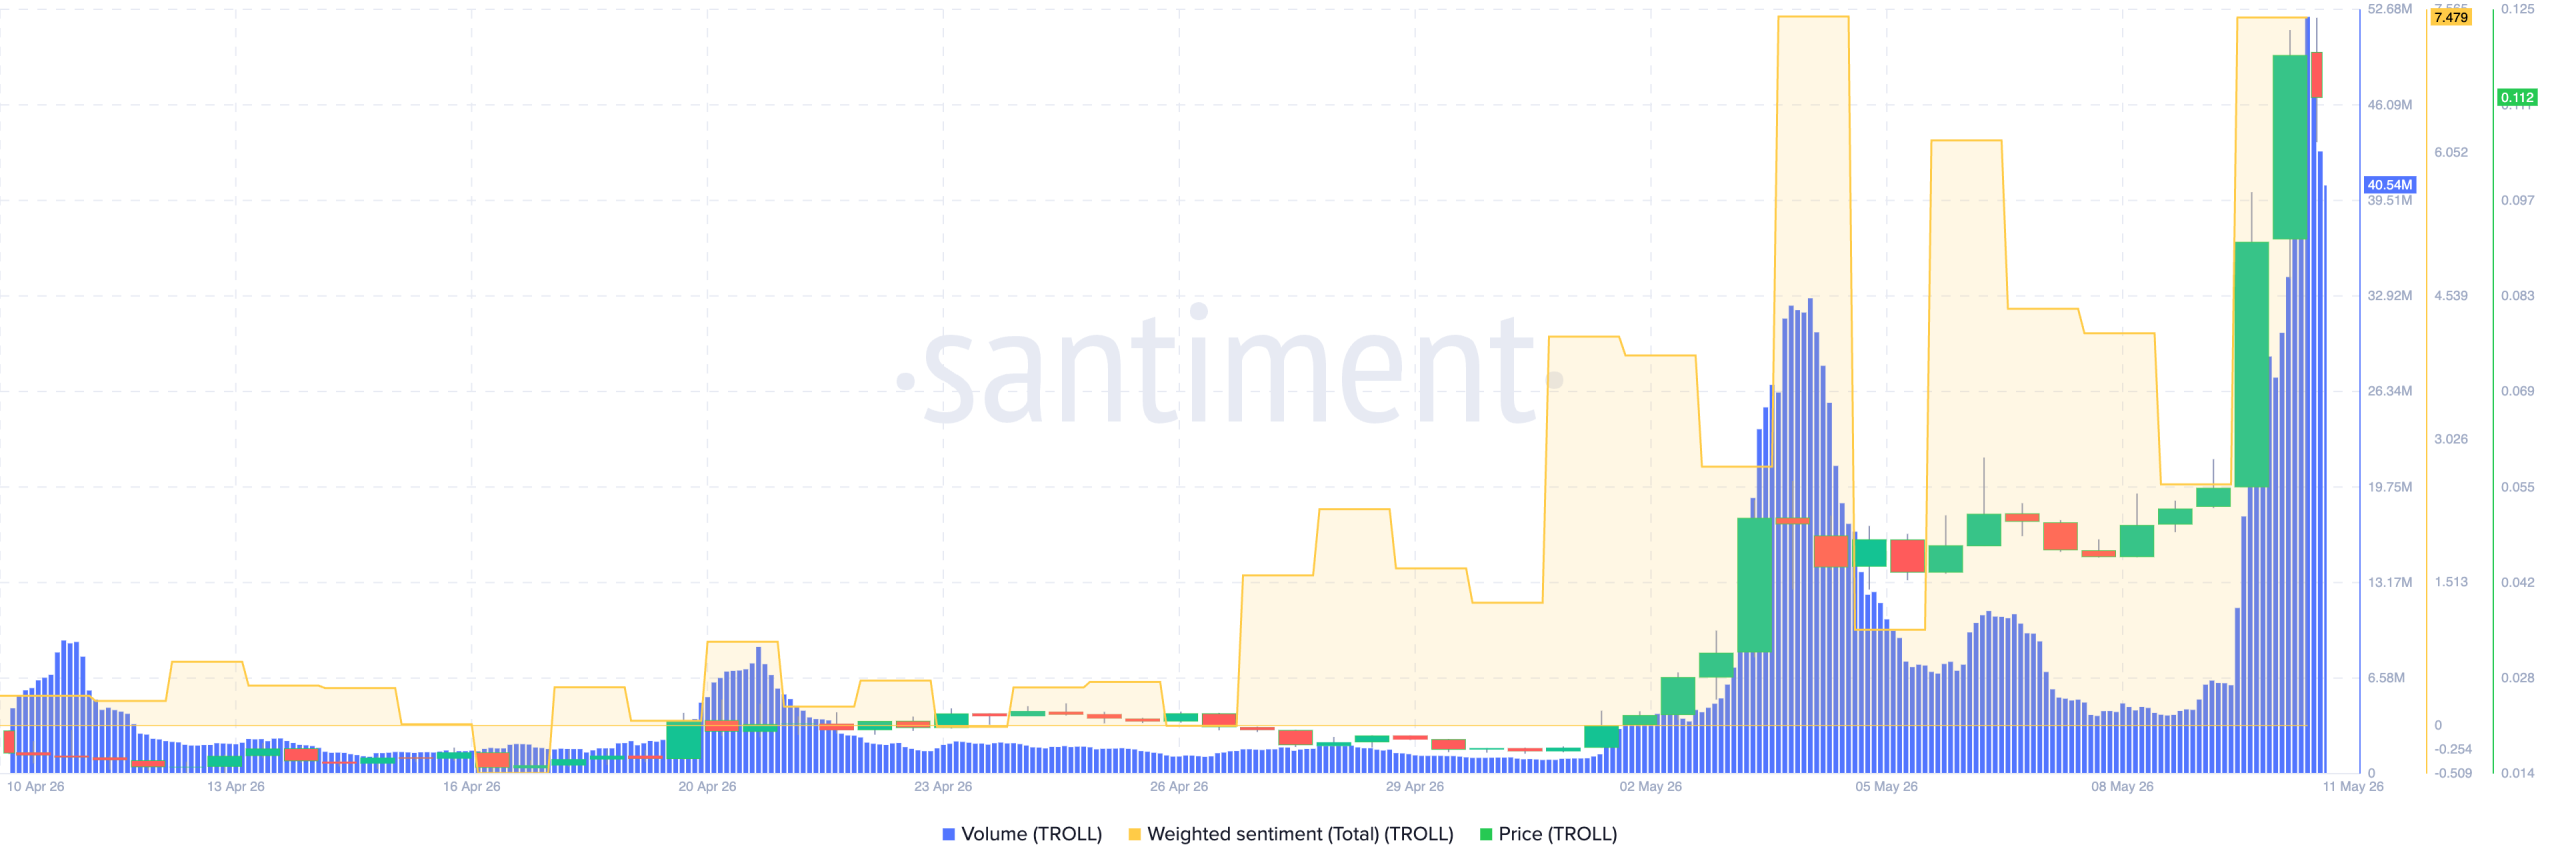
Trading activity reflects that surge in enthusiasm.
According to Santiment, TROLL’s trading volume exploded by more than 402%, climbing above $40 million for the first time in a long while.
Amid that, TROLL’s weighted sentiment has also spiked, suggesting that the memecoin is in a strong momentum phase.
This setup often supports continuation moves in memecoins, especially when sentiment and volume rise together.
However, sentiment is now approaching euphoric territory, which can also signal a possible local top.
As long as sentiment remains elevated and volume supports the move, TROLL’s price could continue to push higher.
TROLL Trading Volume vs Weighted Sentiment | Credit: Santiment
But if buying pressure drops while volume stays high, it may indicate distribution and increase the risk of a pullback.
TROLL Price Prediction
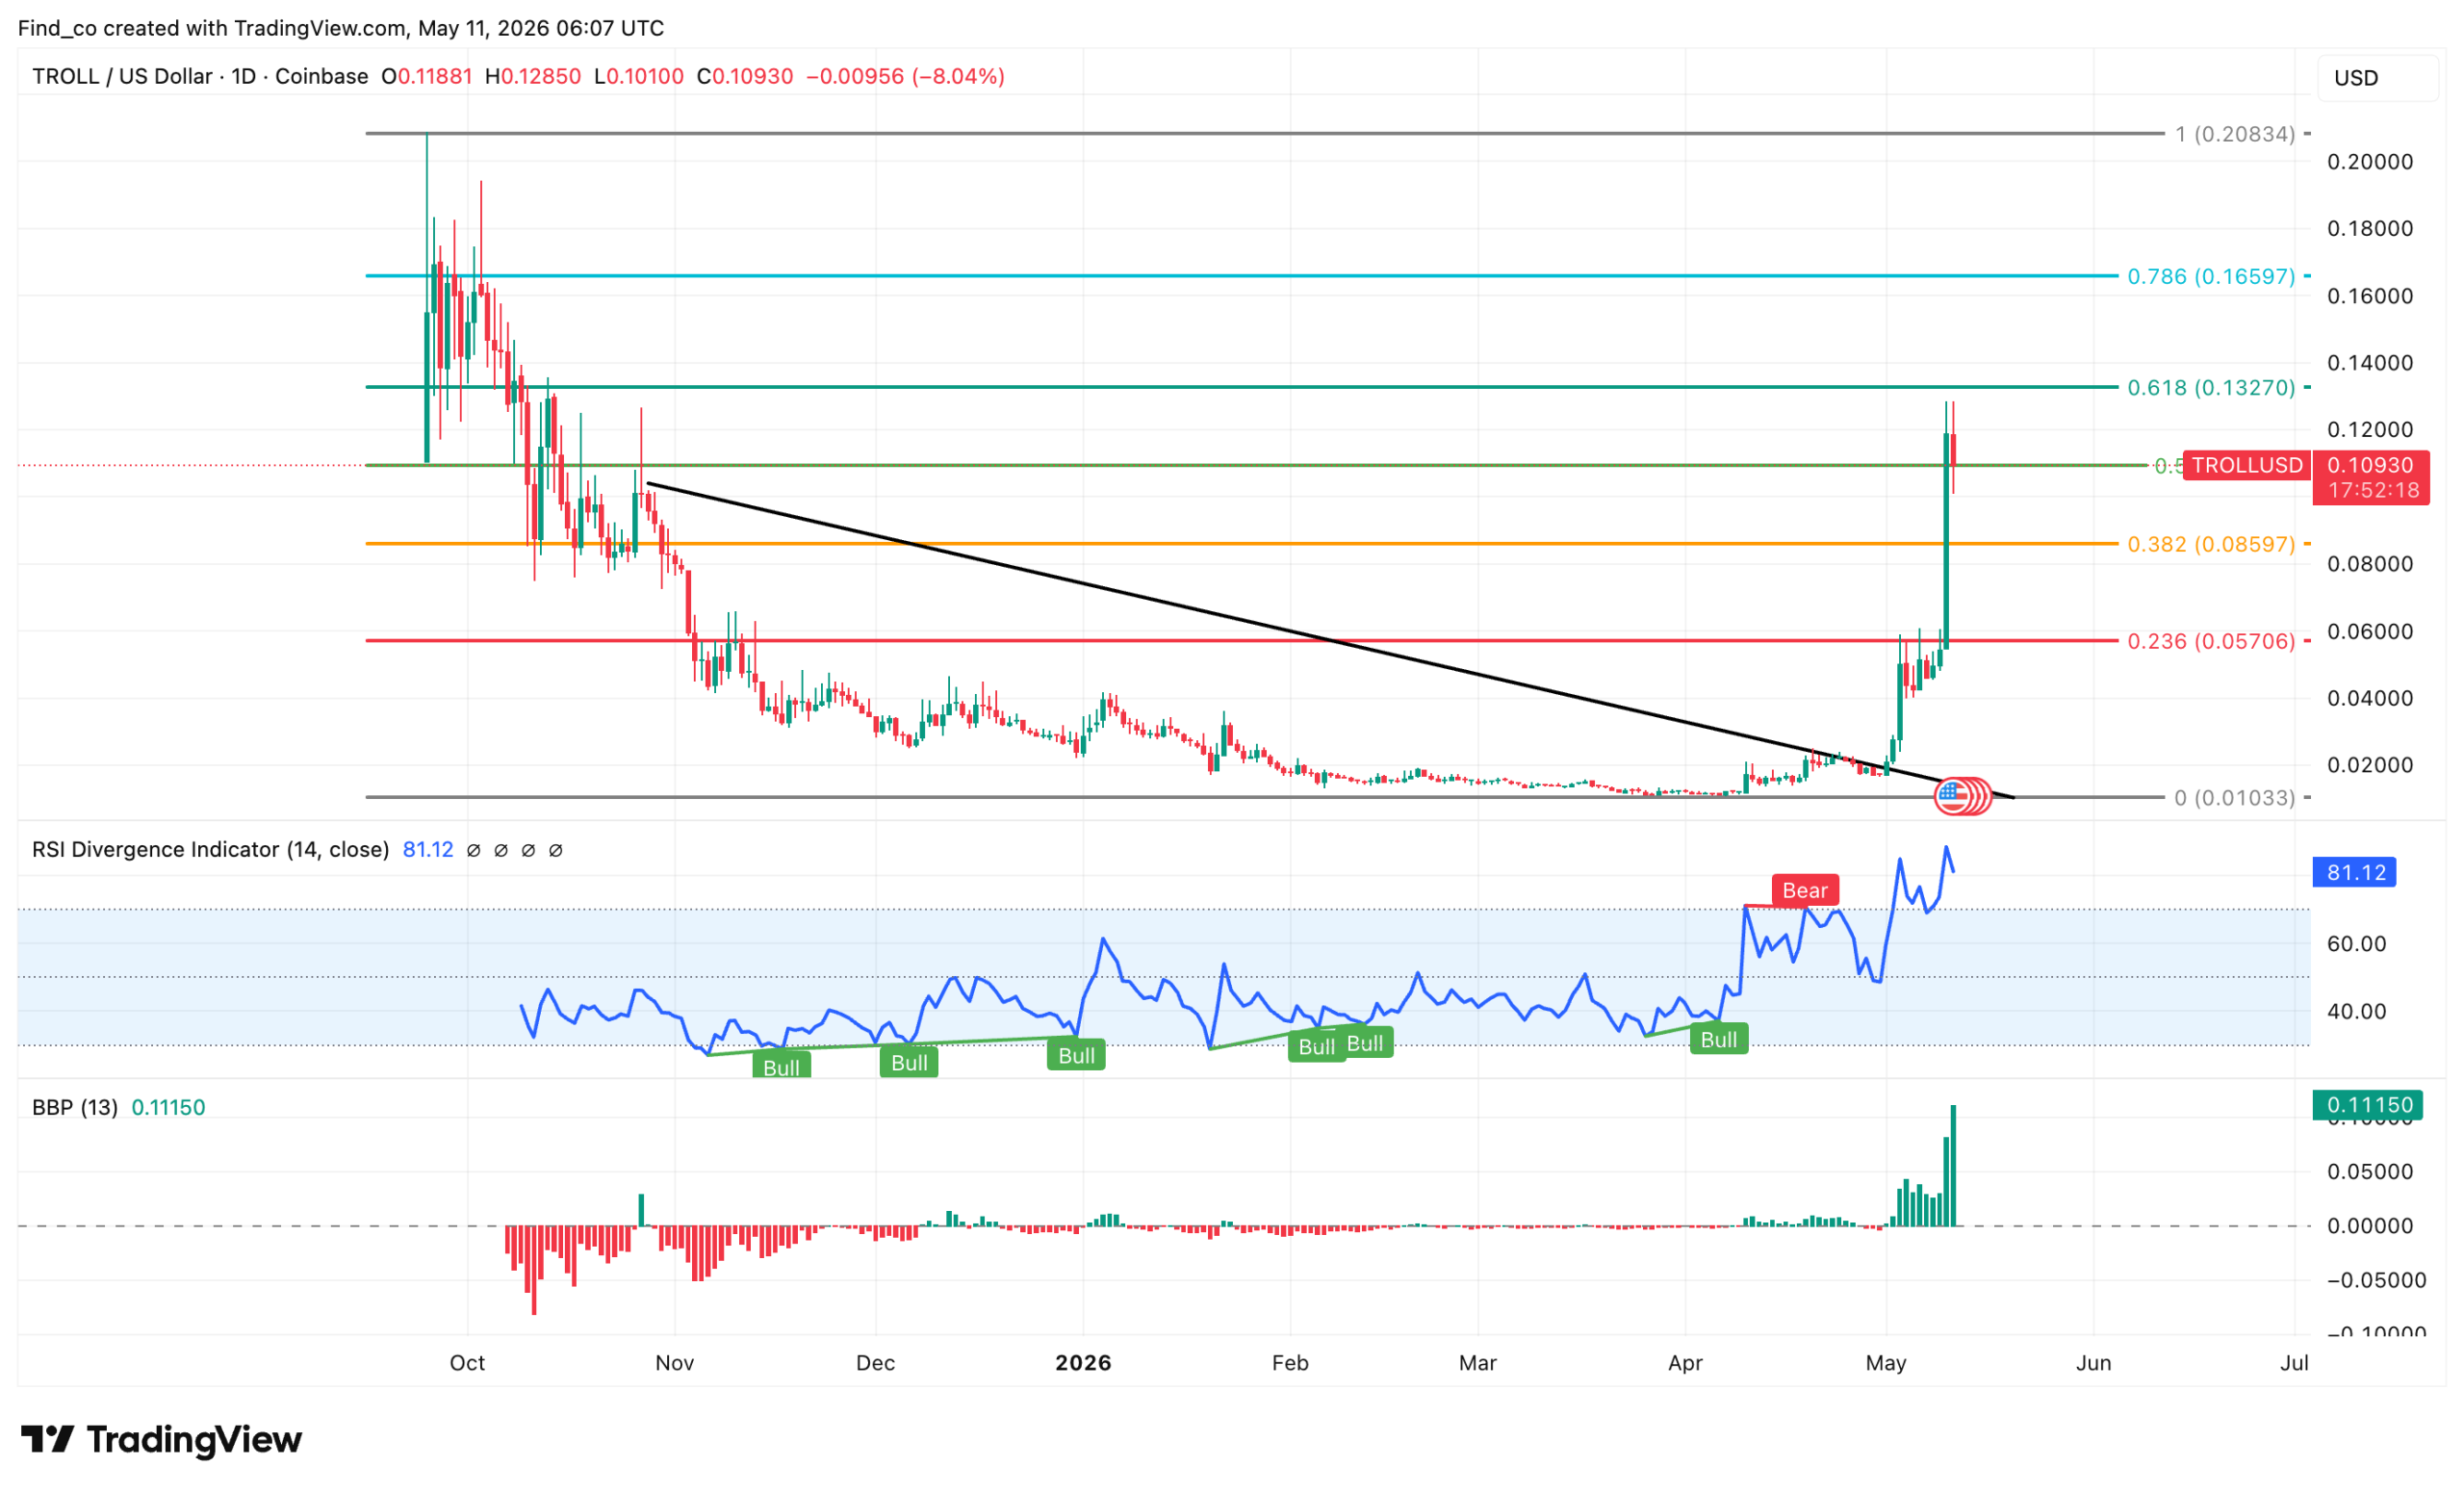
From a technical perspective, traders are closely watching the $0.10 range, which marks a major psychological resistance zone.
Notably, the Bull Bear Power (BBP) supports the move. Additionally, the Relative Strength Index (RSI) has been rising, indicating that buyers remain in control.
At the time of writing, the token’s price is now approaching the key 0.5 Fib resistance at $0.11, which is acting as the next major decision zone.
A hold above the $0.090 region could open the door to a continuation toward the 0.618 Fib at $0.13 and potentially the 0.786 Fib near $0.16.
However, the main risk here is overheating. RSI is deep in overbought territory, and the recent move increases the probability of volatility or profit-taking.
Disclaimer:
The information provided in this article is for informational purposes only. It is not intended to be, nor should it be construed as, financial advice. We do not make any warranties regarding the completeness, reliability, or accuracy of this information. All investments involve risk, and past performance does not guarantee future results. We recommend consulting a financial advisor before making any investment decisions.
Victor Olanrewaju is a crypto analyst and reporter at CCN with deep roots in on-chain research and technical analysis. His crypto journey began in 2017, but it was the 2020 Uniswap airdrop that sparked a full-time pivot into the space.
With a foundation in copywriting, Victor honed his craft creating high-converting content for leading crypto brokers — most notably an XRP price prediction that ranked #1 on Google during the 2021 bull run.
He later joined AMBCrypto in 2022, where he combined storytelling with technical and on-chain analysis to cover key market narratives.
In 2024, he expanded his expertise at BeInCrypto, collaborating with analysts and using tools like Glassnode, Santiment, and IntoTheBlock to break down Bitcoin and altcoin trends.
At CCN, Victor covers the top cryptocurrencies, memecoins, macro shifts, blending real-time insights with deep-dive metrics.
He holds a Bachelor’s degree in Physics from the University of Ibadan, equipping him to simplify complex data for a wide audience. Follow his work or connect on LinkedIn or X.