Meet the Top 101 in Crypto

Bitcoin (BTC) Under Pressure to Slide Under $74K as US 10-Year Yield Surges, Japan Bonds Break 1999 Highs

Published 18 May 2026
Victor Olanrewaju
Authors

Key Takeaways

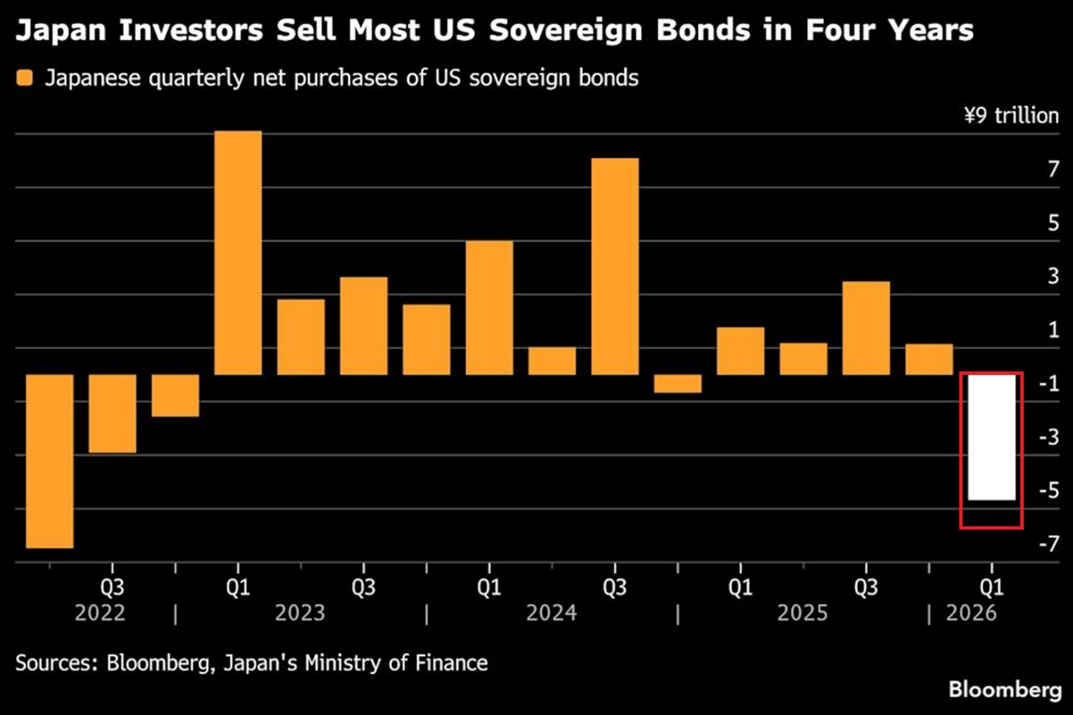
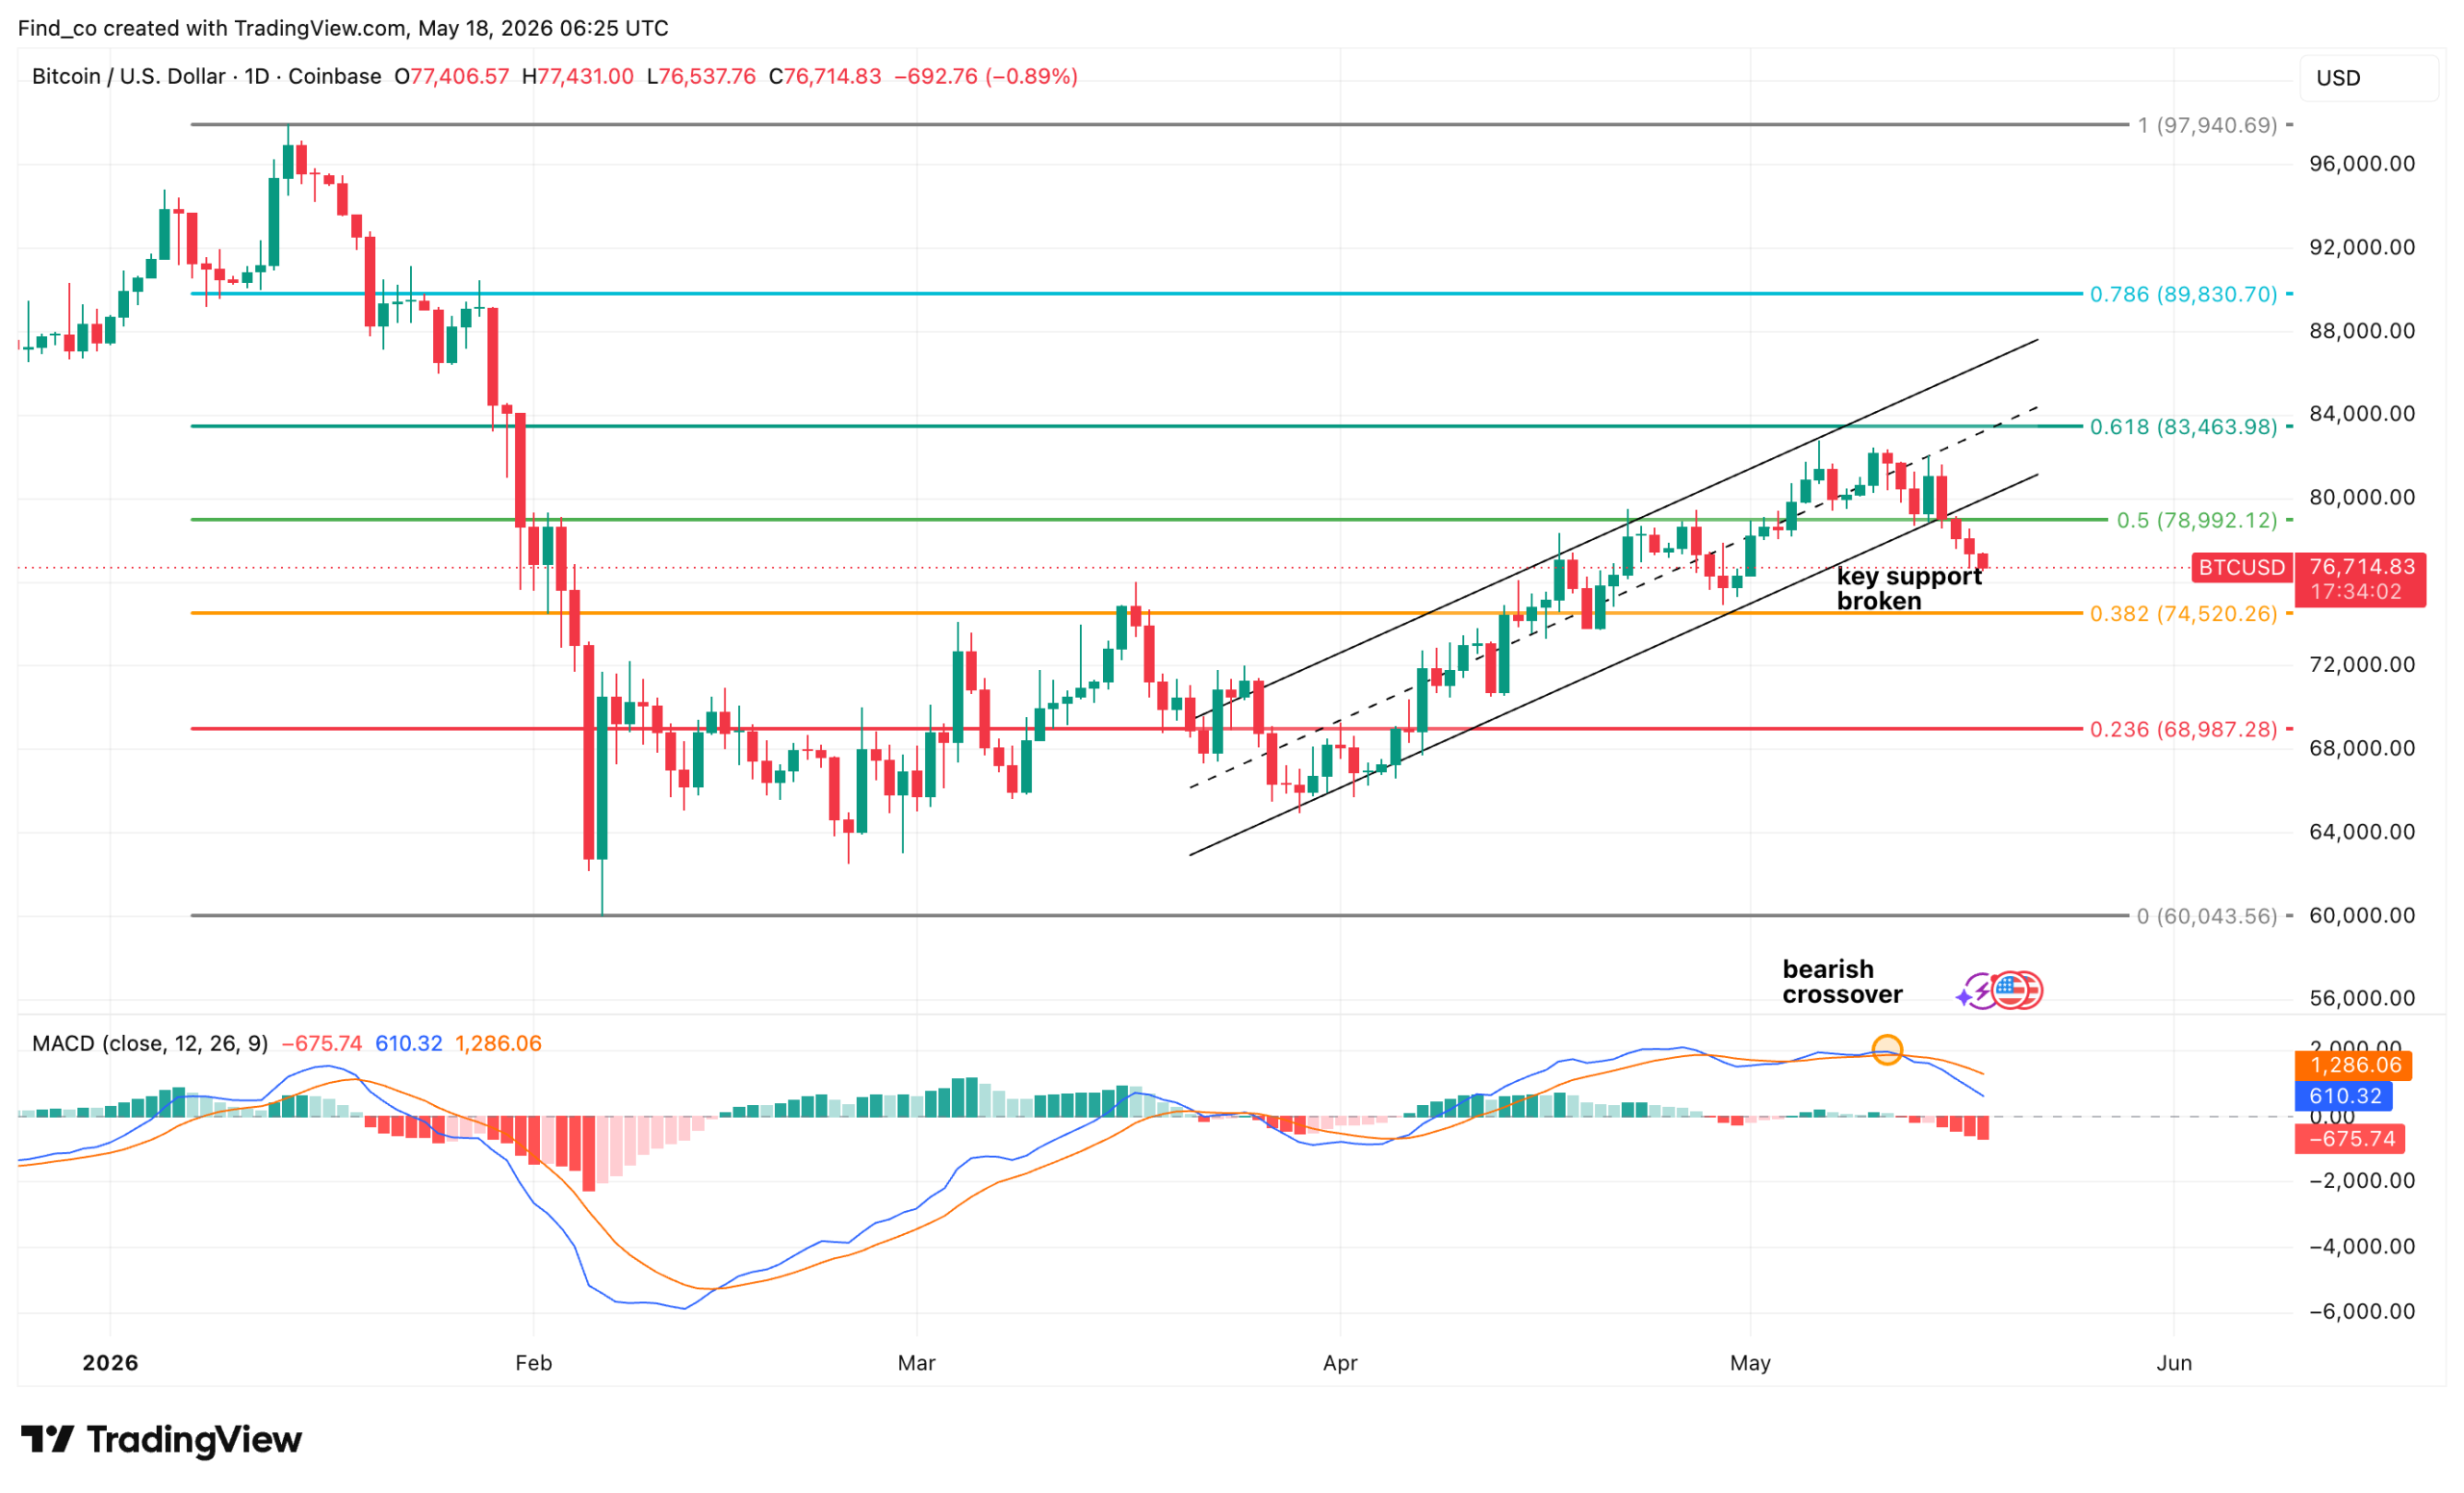
  • Bitcoin fell below $77,000 as rising U.S. and Japanese bond yields triggered a broader global risk-off move across financial markets.
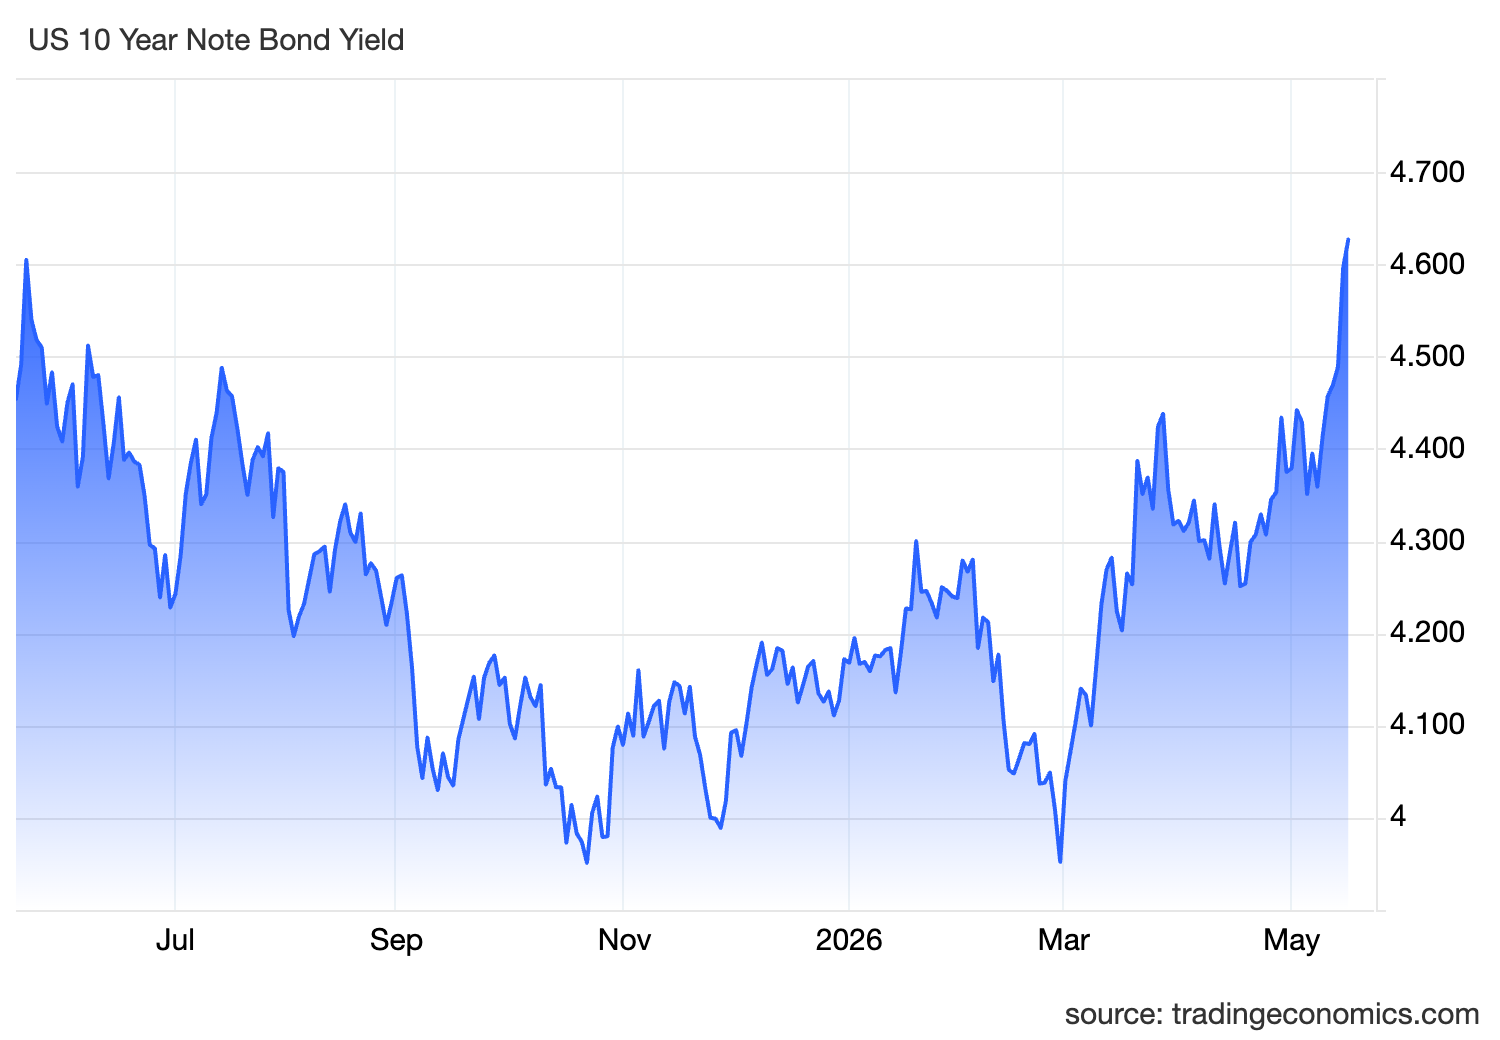
  • Higher Treasury yields, persistent inflation, and expectations of tighter Federal Reserve policy are reducing appetite for risk assets like BTC.
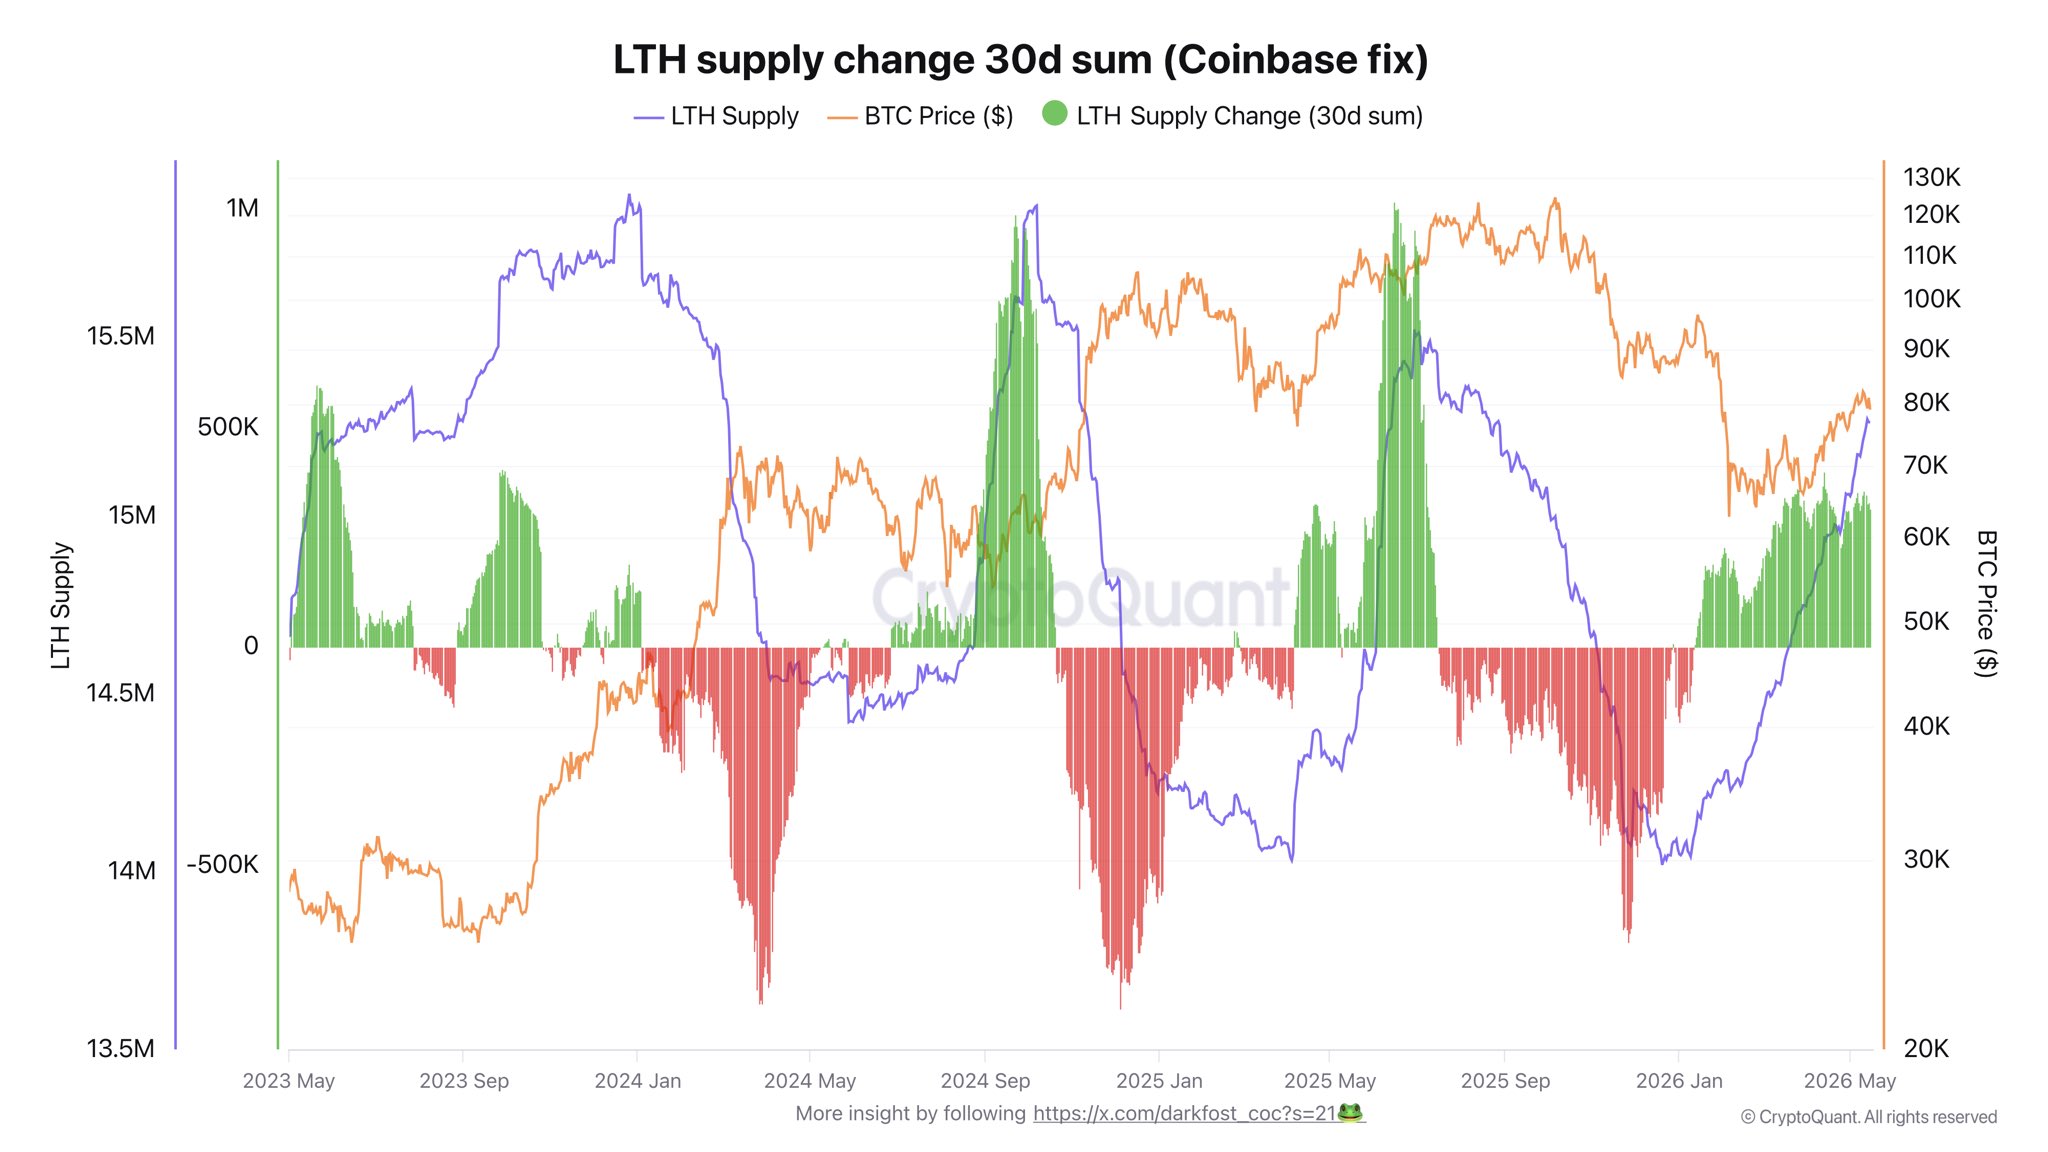
  • Despite short-term weakness, long-term holder accumulation remains strong, suggesting selling pressure is easing while key support sits near $74,500.

The global financial system is flashing serious warning signals, and Bitcoin is now caught directly in the crossfire.

On Sunday, May 17, Bitcoin’s price broke beneath its consolidation structure, plunging more than 4.5% to trade near $76,900.

The decline erased the policy-driven optimism that had pushed BTC above $82,000 following progress on the U.S. CLARITY Act.

Instead, crypto markets are now reacting to a synchronized liquidation event across both U.S. and Japanese sovereign debt markets.

As a result, more than $140 billion has already been wiped from the total crypto market capitalization over the weekend as risk appetite collapsed.

But what exactly impacted this, and what could be next for Bitcoin’s price?

U.S. Treasury Yields Are Triggering a Global Risk-Off Event

The biggest macro pressure currently crushing Bitcoin’s price is the violent repricing happening inside the US bond market.

As of this writing, the benchmark US 10-year Treasury yield has surged to 4.62%, marking its highest level since mid-2025.

Even more alarming, the 30-year Treasury yield closed at 5.12% — a level markets last saw before the 2008 financial crisis.

For institutional investors, these yields represent a shift in global capital allocation.

When “risk-free” government bonds suddenly offer returns above 5%, speculative assets like Bitcoin become significantly less attractive in the short term.

US 10-year treasury yield
US 10-Year Treasury Yield | Credit: TradingEconomics

But that’s not all.

According to CCN’s findings, the bond market sell-off was triggered by another wave of hotter-than-expected inflation data.

Get These Top Crypto Casino Offers Now!
Sponsored
Disclosure
Opened in 2023
Promotions
200% deposit bonus up to 20,000 USDT + up to 100 FS (promo code: CG100)
Coins
Tether Bitcoin Ethereum USD Coin TRON +7
Opened in 2021
Promotions
Casino No Wagering 100 Free Spins
Coins
Bitcoin Tether USD Coin Ethereum Solana +11
Opened in 2018
Promotions
500% Welcome Bonus up to $90,000 + 100 Free Spins
Coins
Bitcoin Ethereum Litecoin Tether Dogecoin +3
Show More

As reported two weeks ago, Core CPI inflation printed at a stubborn 3.8%, while wholesale Producer Price Index (PPI) metrics also accelerated.

At the same time, ongoing geopolitical tensions have pushed crude oil prices back above $100 per barrel.

Oil prices surge
WTI Crude 4-Hour Chart | Credit: TradingView

Thus, high energy prices are acting as both:

  • A direct inflation accelerant.
  • A hidden tax on global economic growth.

This combination has shattered hopes that inflation was cooling and dramatically increased fears that interest rates could remain elevated much longer than markets previously expected.

Japan’s Bond Market May Be the Biggest Threat of All

While U.S. yields are already creating pressure, we believe the real systemic shockwave is coming from Japan.

At press time, the yield on Japan’s 30-year government bond surged above 4% for the first time since the instrument began trading in 1999.

At the same time, Japan’s 20-year bond yield exploded to levels not seen since 1996 as traders increasingly expect the Bank of Japan to raise rates at its June meeting.

Japan 30-Year LSEG yield
JP30Y Daily Chart | Credit: TradingView

This matters enormously for global markets, as well as Bitcoin’s price

For over two decades, Japan’s near-zero interest rate environment encouraged massive overseas investment into global assets — including more than $1 trillion in U.S. Treasuries.

Japan US treasuries Bitcoin
Japan US Sovereign Bonds Chart | Credit: Bloomberg

Now, rising domestic yields are triggering a historic capital repatriation cycle. As a result, Japanese institutions are selling foreign assets, including $29.6 billion in US Treasuries, and bringing money back home.

Like Japan, Chinese holdings of US Treasuries have dropped to the lowest level since the 2008 Financial crisis.

That process is draining global liquidity at the exact moment Bitcoin and crypto markets are already under pressure from rising U.S. yields.

“Warsh Fed” Has Changed Market Expectations

Outside the bond and treasury yield market, the macro pressure intensified further after Kevin Warsh officially became the 17th Chair of the Federal Reserve following Senate confirmation.

For context, Warsh has long been viewed as one of Wall Street’s most aggressive inflation hawks. As a result, markets have abandoned expectations for interest rate cuts for the rest of 2026.

Instead, swap markets are now increasingly pricing in the rising probability of another Fed hike. Beyond that, analysts forecast a more aggressive balance-sheet contraction during Warsh’s reign.

This shift is critically important for Bitcoin because tighter monetary policy directly removes liquidity from financial markets.

LTH May Ease the Downward Pressure

Looking at on-chain data, Bitcoin’s long-term holder (LTH) supply is rising again.

According to CryptoQuant data, LTH supply has climbed back to 15.26 million BTC. This metric last reached these levels in August 2025,  while over 316,000 BTC have been added over the past 30 days.

Historically, rising LTH supply has been considered bullish. This is because more coins are being moved into wallets unlikely to sell soon, thereby reducing the market’s liquidity.

Interestingly, this contrasts with late November, when the metric showed a -650,000 BTC decline as long-term holders distributed coins near local highs.

In the meantime, CryptoQuant analyst Darkfost noted that the upcoming May 23 milestone is significant as well.

Around 800,000 BTC moved by Coinbase six months ago will officially become classified as long-term held coins.

long-term holder supply impact analyzed
BTC 30-Day LTH Supply Change | Credit: CryptoQuant

If sustained, this could push the metric even higher and attract more attention to LTH dynamics.

Overall, the data suggests that many holders who accumulated BTC during the previous correction are still holding rather than taking profits.

At the same time, this does not imply that Bitcoin’s price will surge past $85,000. But it signifies that selling pressure is easing, and a notable correction in the $60,000 direction might not happen.

BTC Price Analysis: What to Expect

From a technical perspective, Bitcoin is showing signs of short-term weakness after breaking a key support level within an ascending channel on the daily chart below.

At the time of writing, BTC is currently trading around $76,700. This breakdown comes as the MACD confirms a bearish crossover, with momentum shifting in favor of sellers for the first time since the April recovery.

The rejection below the 0.5 Fibonacci level at $78,992 is significant because it invalidates the recent bullish structure that had been building toward the $85,000 resistance zone.

As such, Bitcoin’s price is now approaching the 0.382 Fibonacci support near $74,520. Notably, this is the key level that bulls need to defend.

A sustained move below that zone could open the door for a deeper correction toward $69,000, aligning with the 0.236 retracement.

Despite the recent pullback, the broader structure is not yet fully bearish. Bitcoin remains above the major macro support around $60,000, and the previous rebound from that region still suggests long-term accumulation.

Bitcoin BTC technical analysis
BTC/USD Daily Chart | Credit: TradingView

However, in the near term, momentum has weakened, and bulls will need to reclaim the broken channel support quickly to regain control.

If BTC recovers above $79,000 and re-enters the channel, the market could attempt another push toward $83,463 and eventually $89,830.

Disclaimer: The information provided in this article is for informational purposes only. It is not intended to be, nor should it be construed as, financial advice. We do not make any warranties regarding the completeness, reliability, or accuracy of this information. All investments involve risk, and past performance does not guarantee future results. We recommend consulting a financial advisor before making any investment decisions.
Victor Olanrewaju

Victor Olanrewaju is a crypto analyst and reporter at CCN with deep roots in on-chain research and technical analysis. His crypto journey began in 2017, but it was the 2020 Uniswap airdrop that sparked a full-time pivot into the space.

With a foundation in copywriting, Victor honed his craft creating high-converting content for leading crypto brokers — most notably an XRP price prediction that ranked #1 on Google during the 2021 bull run.

He later joined AMBCrypto in 2022, where he combined storytelling with technical and on-chain analysis to cover key market narratives.

In 2024, he expanded his expertise at BeInCrypto, collaborating with analysts and using tools like Glassnode, Santiment, and IntoTheBlock to break down Bitcoin and altcoin trends.

At CCN, Victor covers the top cryptocurrencies, memecoins, macro shifts, blending real-time insights with deep-dive metrics.

He holds a Bachelor’s degree in Physics from the University of Ibadan, equipping him to simplify complex data for a wide audience. Follow his work or connect on LinkedIn or X.

Related

Survey Icon
Help us improve
1 of 4
Is this your first time here?
What brought you here today?
What are you most interested in?
Would you be interested in:
Thank you icon
Thank you for your feedback!
DMCA.com Protection Status