Home / Analysis / Crypto / Technical Analysis / Why Is the Crypto Market Crashing? A Perfect Storm of Liquidity, Japanese Bond Yields and Leverage Slams Prices
Top Three Reasons Why the Crypto Market Is Crashing | Credit: Hameem Sarwar
Share
Key Takeaways
The crypto market crashed over the weekend, falling 30% from its all-time high.
Leverage unwinding, the yen carry trade, and bearish price action triggered this sharp decline.
How much longer will the crypto market continue to crash before it bounces?
The crypto market took another sharp hit today, plunging more than 5% within hours.
The drop deepened an already-brutal slide from the all-time highs, now more than 30%, and erased the weekend’s brief rebound.
With the bounce failing almost immediately, traders are once again asking the same question: Why is the crypto market crashing, and can it actually recover from here?
Why is Crypto Crashing?
The crypto market has crashed by more than 30% since its all-time high in October.
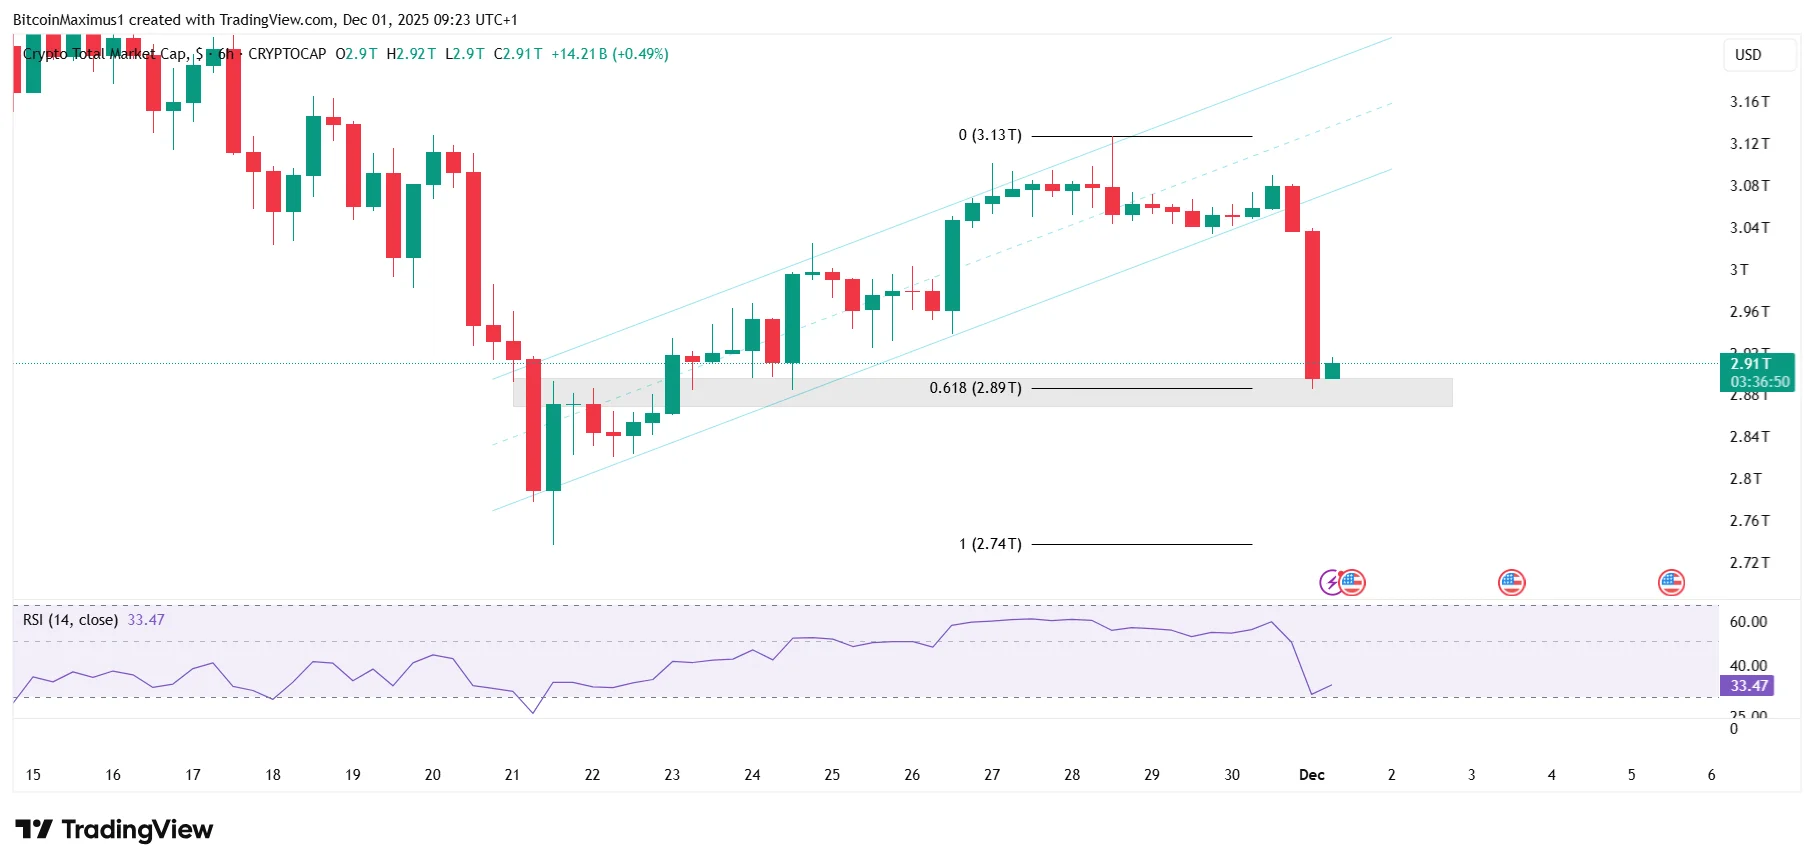
The chart analysis shows that the crypto market cap broke down from its ascending wedge structure (red icon) at the start of November.
Get These Top Crypto Casino Offers Now!
Sponsored
Disclosure
We sometimes use affiliate links in our content, when clicking on those we might receive a commission at no extra cost to you. By using this website you agree to our terms and conditions and privacy policy.
Since the crypto market had increased for 1,050 days, the correction could continue for far longer than traders expect.
Initially, all eyes are on the $2.5 trillion support area, which is nearly 15% below the current price.
What Caused the Crypto Crash?
The charts predicted a breakdown, but a powerful macro trigger drove this crash.
The drop was sparked by rising global yields, especially Japan’s 2-year bond, which pushed above 1% for the first time since 2008, signaling a tightening and triggering a broad risk-off move.
That macro shock broke key support, triggering forced liquidations in long positions and turning the selloff into a rapid, deep drop driven by leverage unwinding.
The stock market also fell 0.5% pre-market, fueling the ongoing crash.
Another reason for the crash is the fact that the move occurred during the weekend, when liquidity is historically very thin.
As stated by the Kobeissi Letter:
As a result, the sudden rush of selling volume leads to a domino-effect selloff, which is only amplified by the historic amounts of levered positions being liquidated.
The final reason for the crypto market crash is the unwind of the Yen carry trade.
However, the lack of a bullish divergence in the RSI makes this bounce unlikely.
Long-term bearish signals indicate a continued downtrend, rather than a relief rally.
All eyes are on $2.9 trillion support, as a break could accelerate losses by 15%.
What Comes Next?
Crypto’s latest meltdown isn’t just another dip; it’s the result of technical breakdowns, macroeconomic stress, and extreme leverage all hitting simultaneously.
Charts confirm that the bull cycle has ended, momentum is bearish, and the macro backdrop is shaky.
The big question is no longer just why crypto is crashing. But it’s whether bulls can defend the final support zones long enough to avoid an even deeper collapse.
For now, $2.9 trillion is key support. If it fails, $2.5 trillion is the next target.
Disclaimer:
The information provided in this article is for informational purposes only. It is not intended to be, nor should it be construed as, financial advice. We do not make any warranties regarding the completeness, reliability, or accuracy of this information. All investments involve risk, and past performance does not guarantee future results. We recommend consulting a financial advisor before making any investment decisions.
Valdrin Tahiri is a cryptocurrency analyst and reporter at CCN, specializing in technical analysis with a focus on Elliott Wave theory, on-chain metrics, and fundamental research. He brings over seven years of experience in the crypto space as both a trader and writer.
He discovered cryptocurrencies in 2017 while earning his MSc in Financial Markets at the Barcelona School of Economics, which sparked a deep interest in blockchain and market dynamics. Since then, he’s contributed to top crypto outlets like BeInCrypto and CoinGape.
Valdrin also served as Community Manager of BeInCrypto’s Telegram group for three years, helping grow it into one of the largest crypto communities worldwide. His expertise in market structure and price patterns allows him to break down complex trends into clear, actionable insights.
He’s published thousands of articles covering altcoins, Bitcoin cycles, and macro trends.