HYPE surges 20% to a seven-month high after Coinbase becomes Hyperliquid's official USDC treasury deployer, putting $50 back in play. Credit: CCN
Share
Key Takeaways
HYPE has surged nearly 20% in 24 hours to a seven-month high of $46.99, leading market gains after Coinbase became the official USDC treasury deployer on Hyperliquid under the network’s AQA framework.
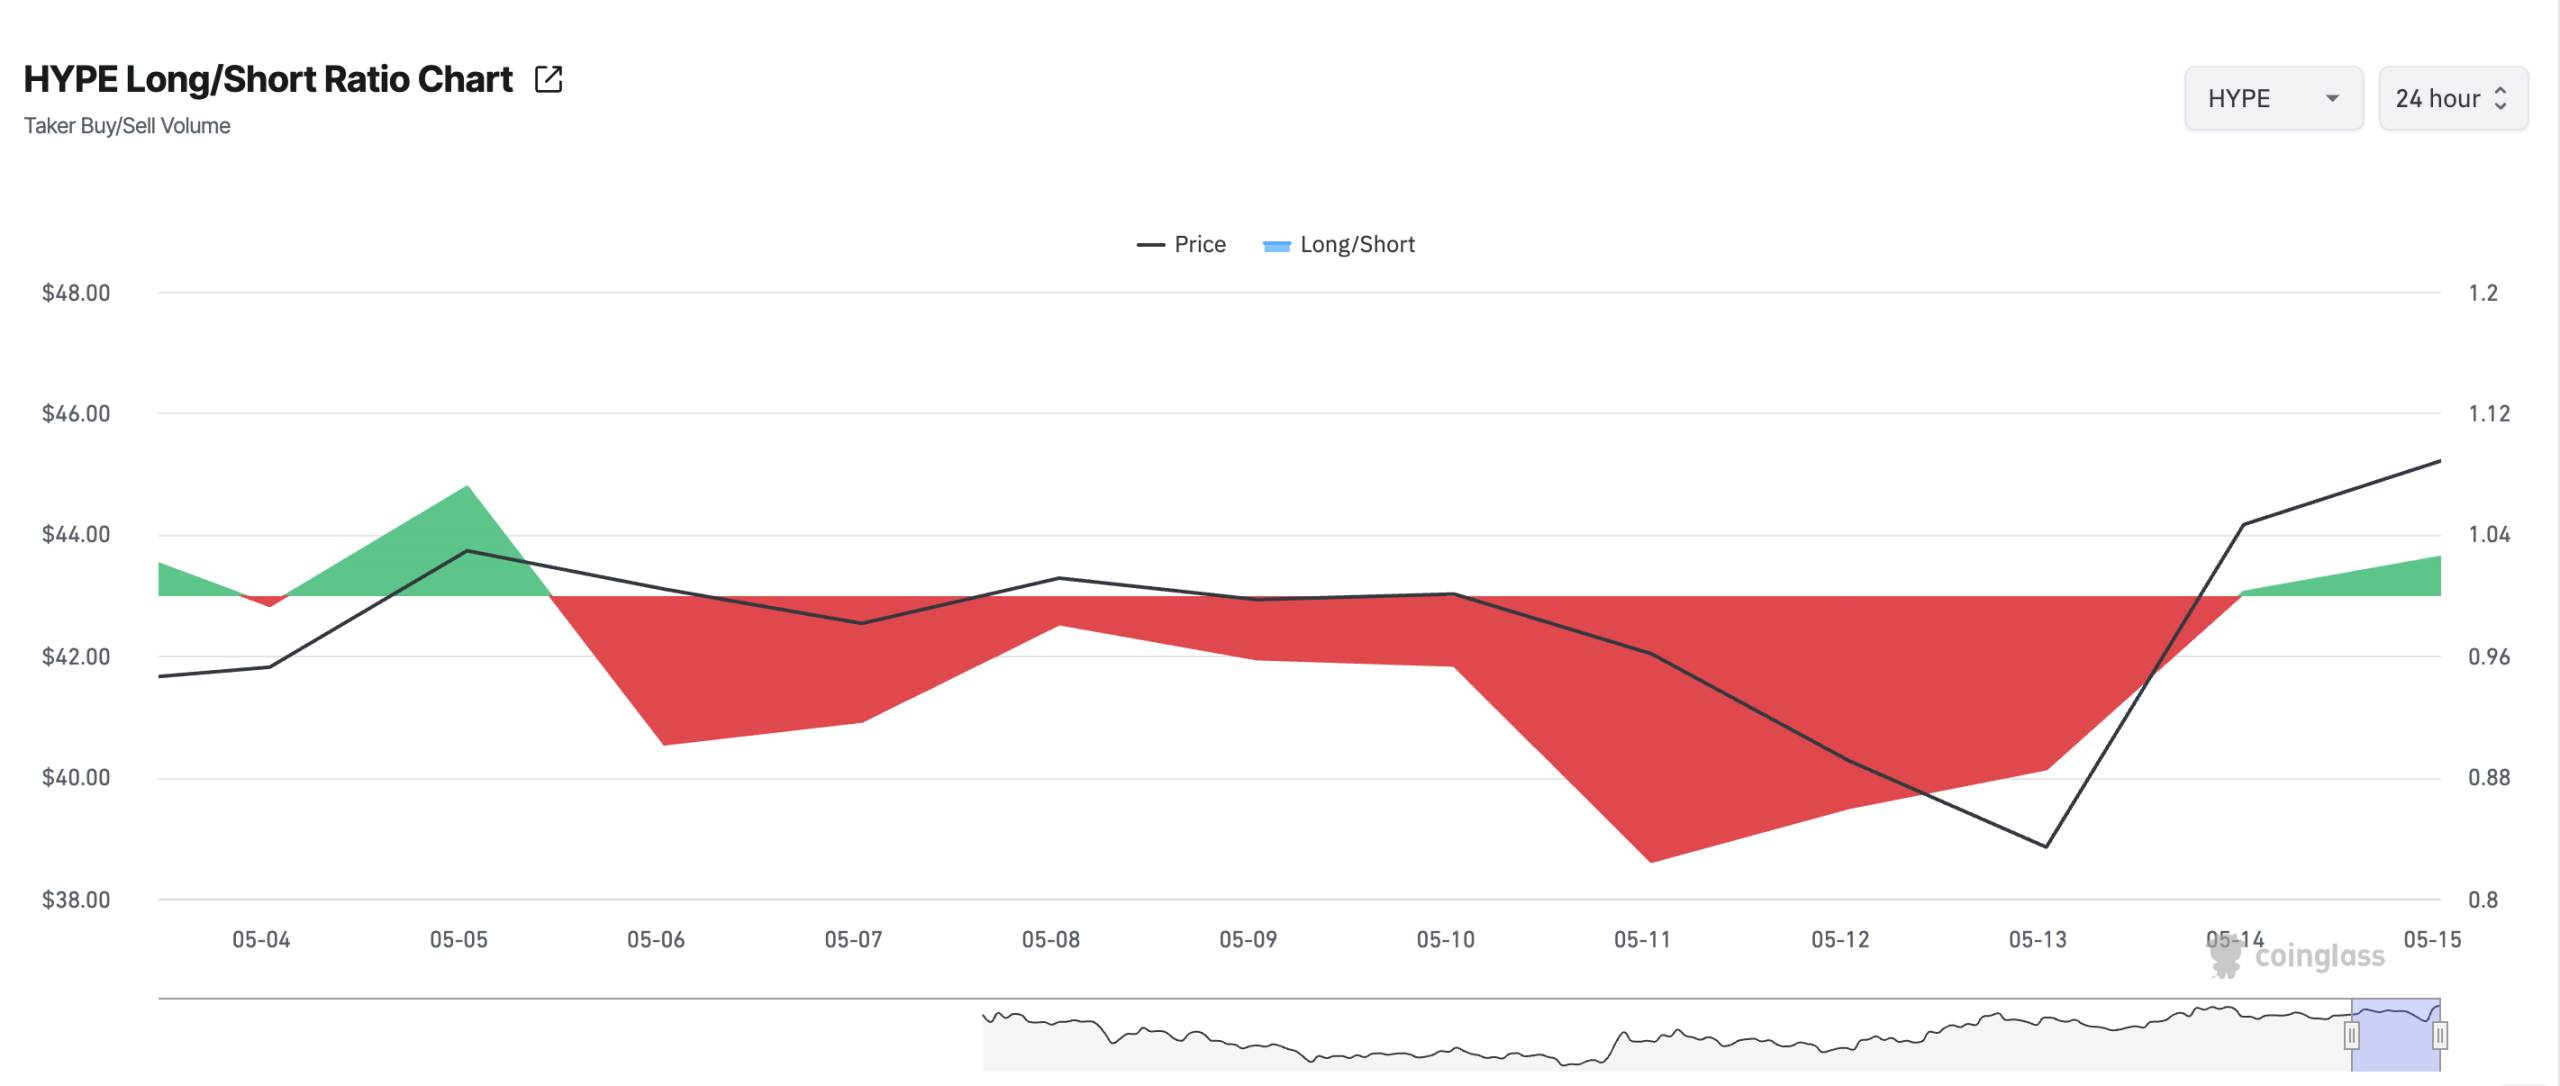
Spot volume hit a two-month high of $128 million, CVD spiked to 1,390, and the long/short ratio flipped above 1 for the first time in nine sessions — confirming both spot and derivatives traders are positioning bullishly.
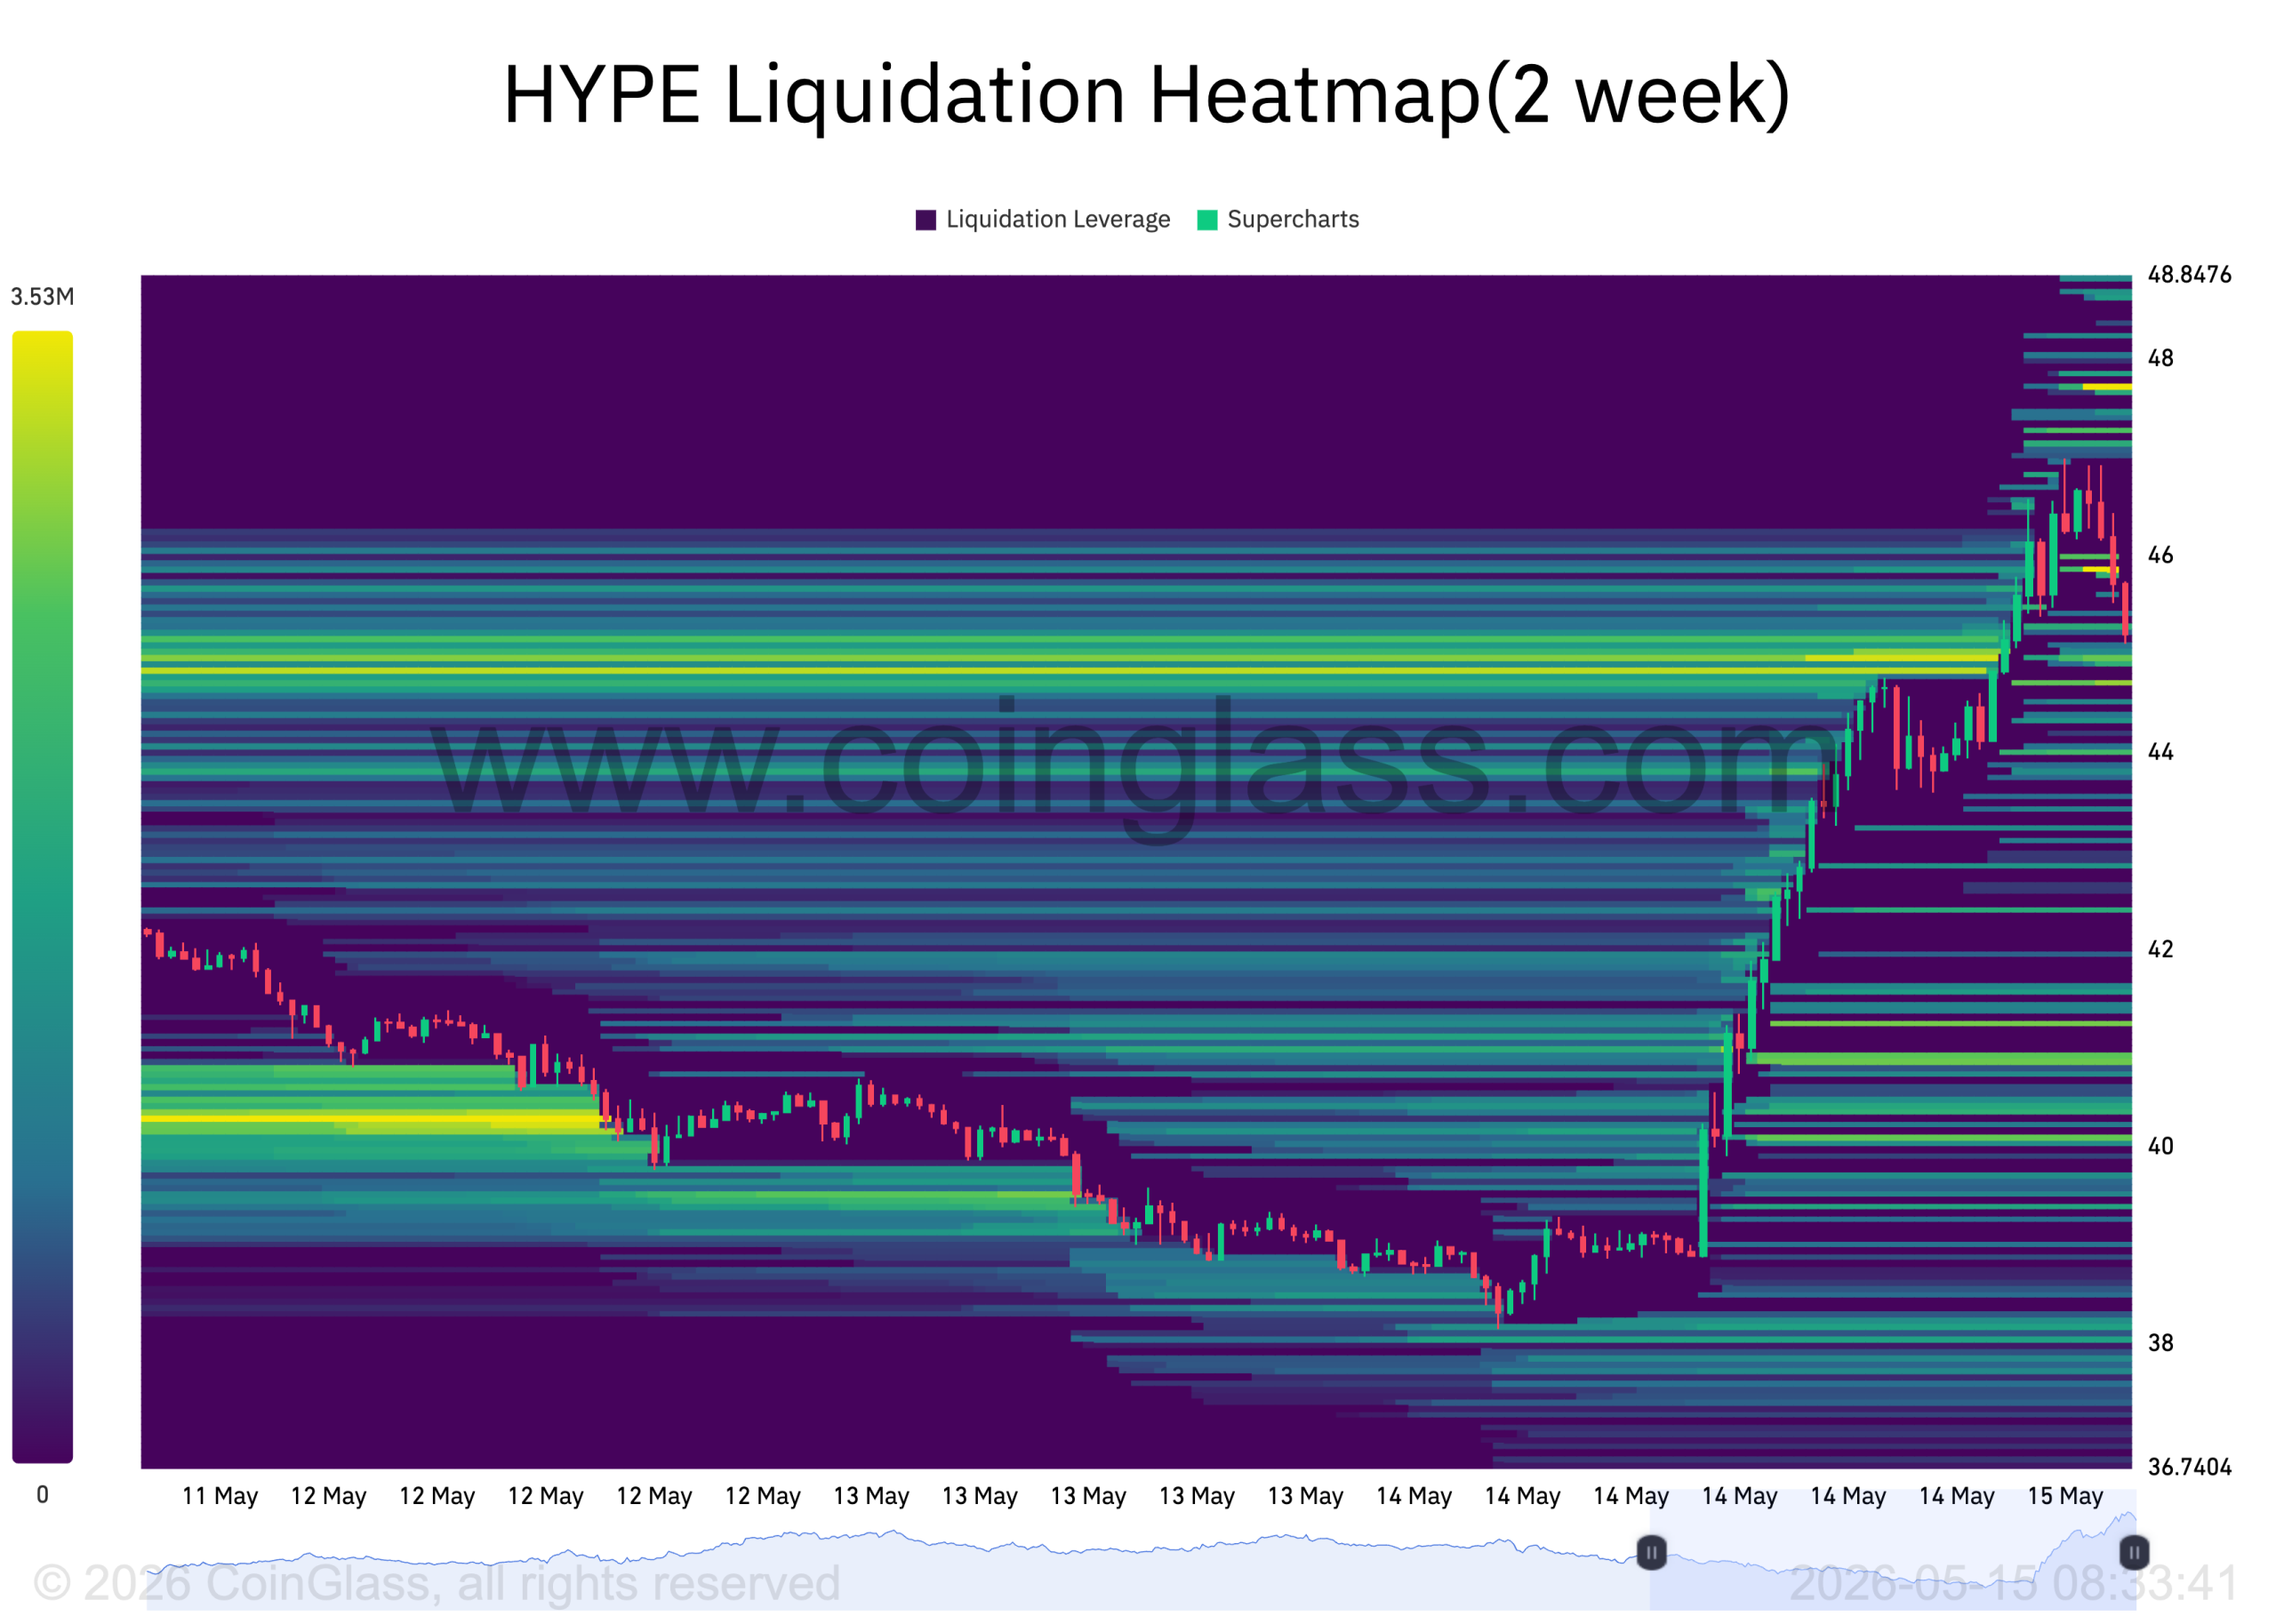
A break above $46.99 opens the door to $50, though a significant liquidity cluster at $40 could pull prices lower if profit-taking accelerates.
Hyperliquid’s native token, HYPE, has quickly become one of the market’s strongest performers.
Its price has spiked nearly 20% over the past 24 hours, making it the market’s top gainer during that period.
HYPE has also broken out of a multi-week consolidation range and reclaimed levels not seen since October 2025.
How high can the altcoin’s price climb in the short term?
Coinbase Reshapes Hyperliquid Stablecoin Economy
HYPE’s double-digit rally follows yesterday’s announcement from Coinbase that it is expanding support for USDC on Hyperliquid by becoming the official treasury deployer of USDC under Hyperliquid’s Aligned Quote Asset (AQA) framework.
The AQA framework connects stablecoin liquidity directly into Hyperliquid’s trading infrastructure and shares reserve yield revenue with the protocol.
Try Our Recommended Crypto Exchanges
Sponsored
Disclosure
We sometimes use affiliate links in our content, when clicking on those we might receive a commission at no extra cost to you. By using this website you agree to our terms and conditions and privacy policy.
As part of the transition, Native Markets, the developer behind Hyperliquid-native stablecoin USDH, agreed to terms granting Coinbase the right to purchase USDH brand assets.
USDH markets are fully functional but will sunset over time, with feeless conversions to USDC and fiat redemptions available to users during the transition.
While Coinbase handles treasury deployment and yield distribution, stablecoin issuer Circle will serve as the technical deployer overseeing USDC minting, redemption, and Cross-Chain Transfer Protocol services.
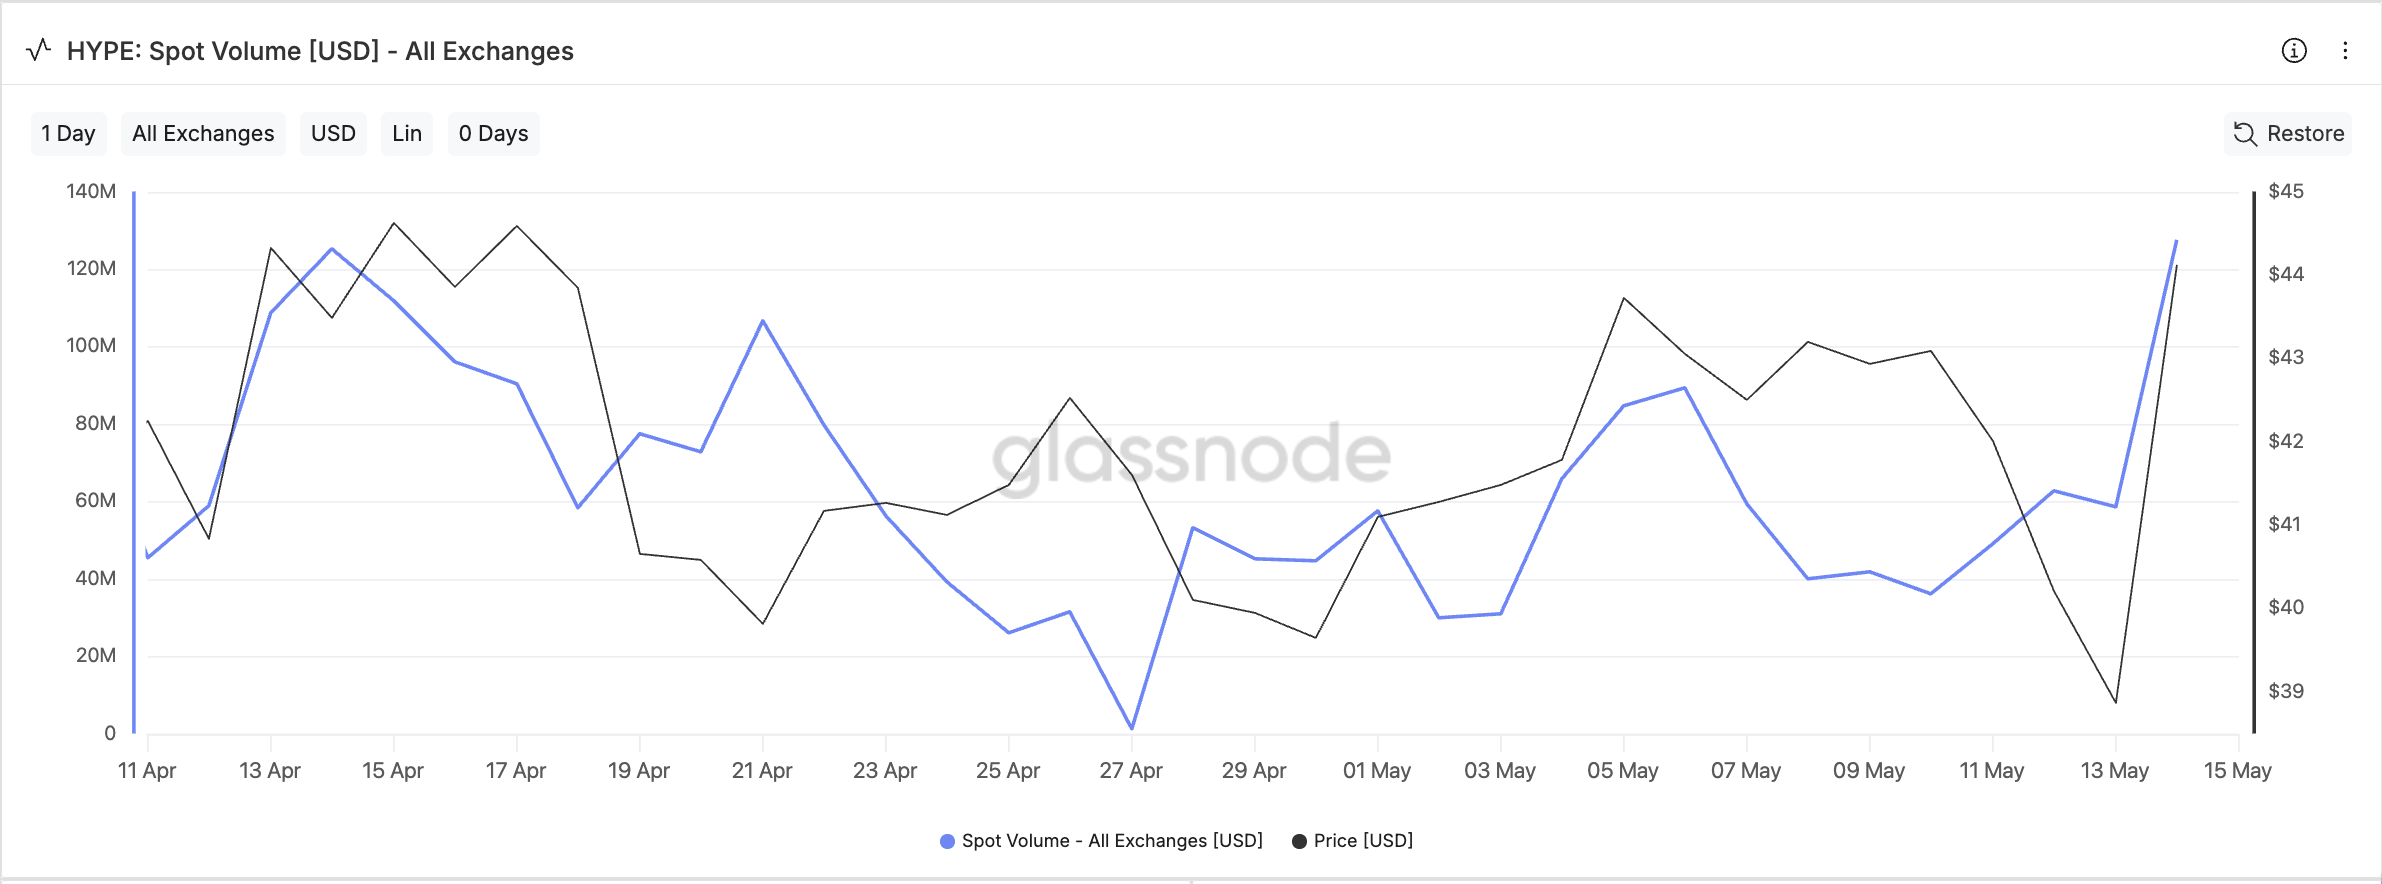
Spot Volume Hits Two-Month High as Buyers Take Control
Traders wasted no time pricing in the news as HYPE’s spot volume across all exchanges closed at a two-month high of $128 million yesterday, per Glassnode.
This marks the token’s strongest day of organic buying interest since mid-March.
While the spike in HYPE’s spot volume suggests genuine demand for the altcoin, it cannot be read in isolation, as it does not show whether buyers or sellers dominated the session.
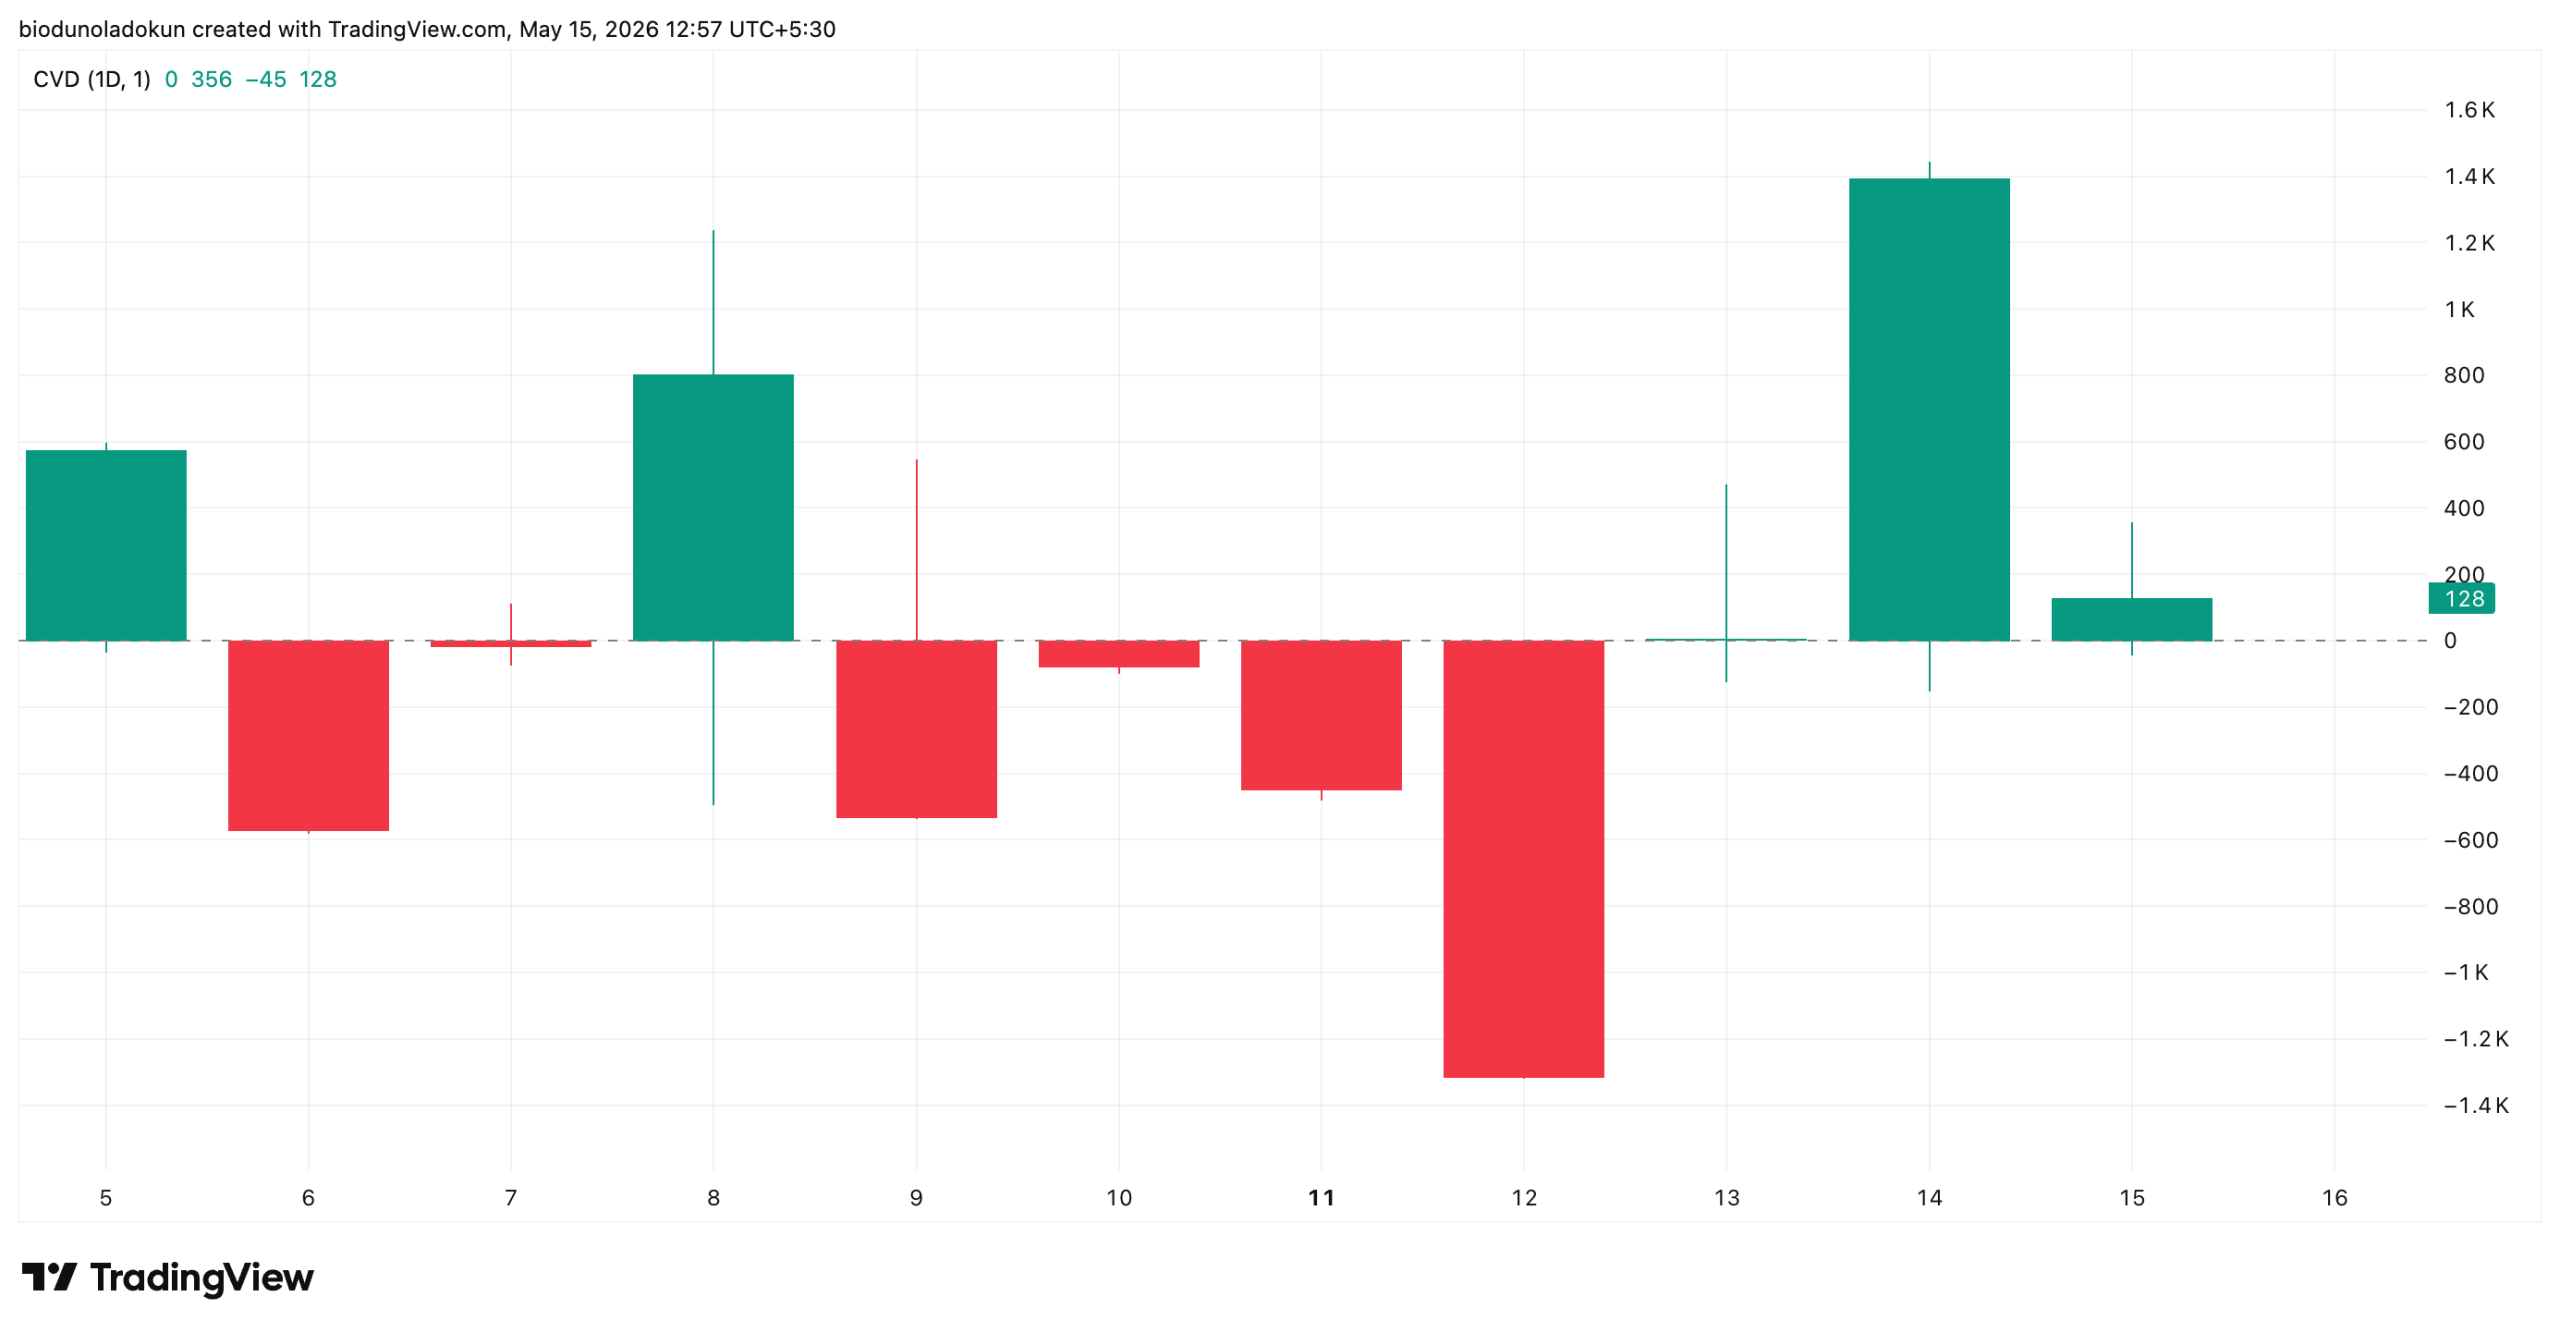
A look at HYPE’s Cumulative Volume Delta (CVD) reveals who was in control.
On the daily chart, HYPE’s CVD spiked to 1,390 yesterday, its highest reading in two months.
An asset’s CVD measures the running difference between aggressive buy orders (and aggressive sell orders) over a given period.
When price, volume, and CVD all trend higher, it signals that the rally carries genuine conviction and can continue.
HYPE Momentum Indicators Flash Bullish
Readings from HYPE’s key momentum indicators support this positive outlook.
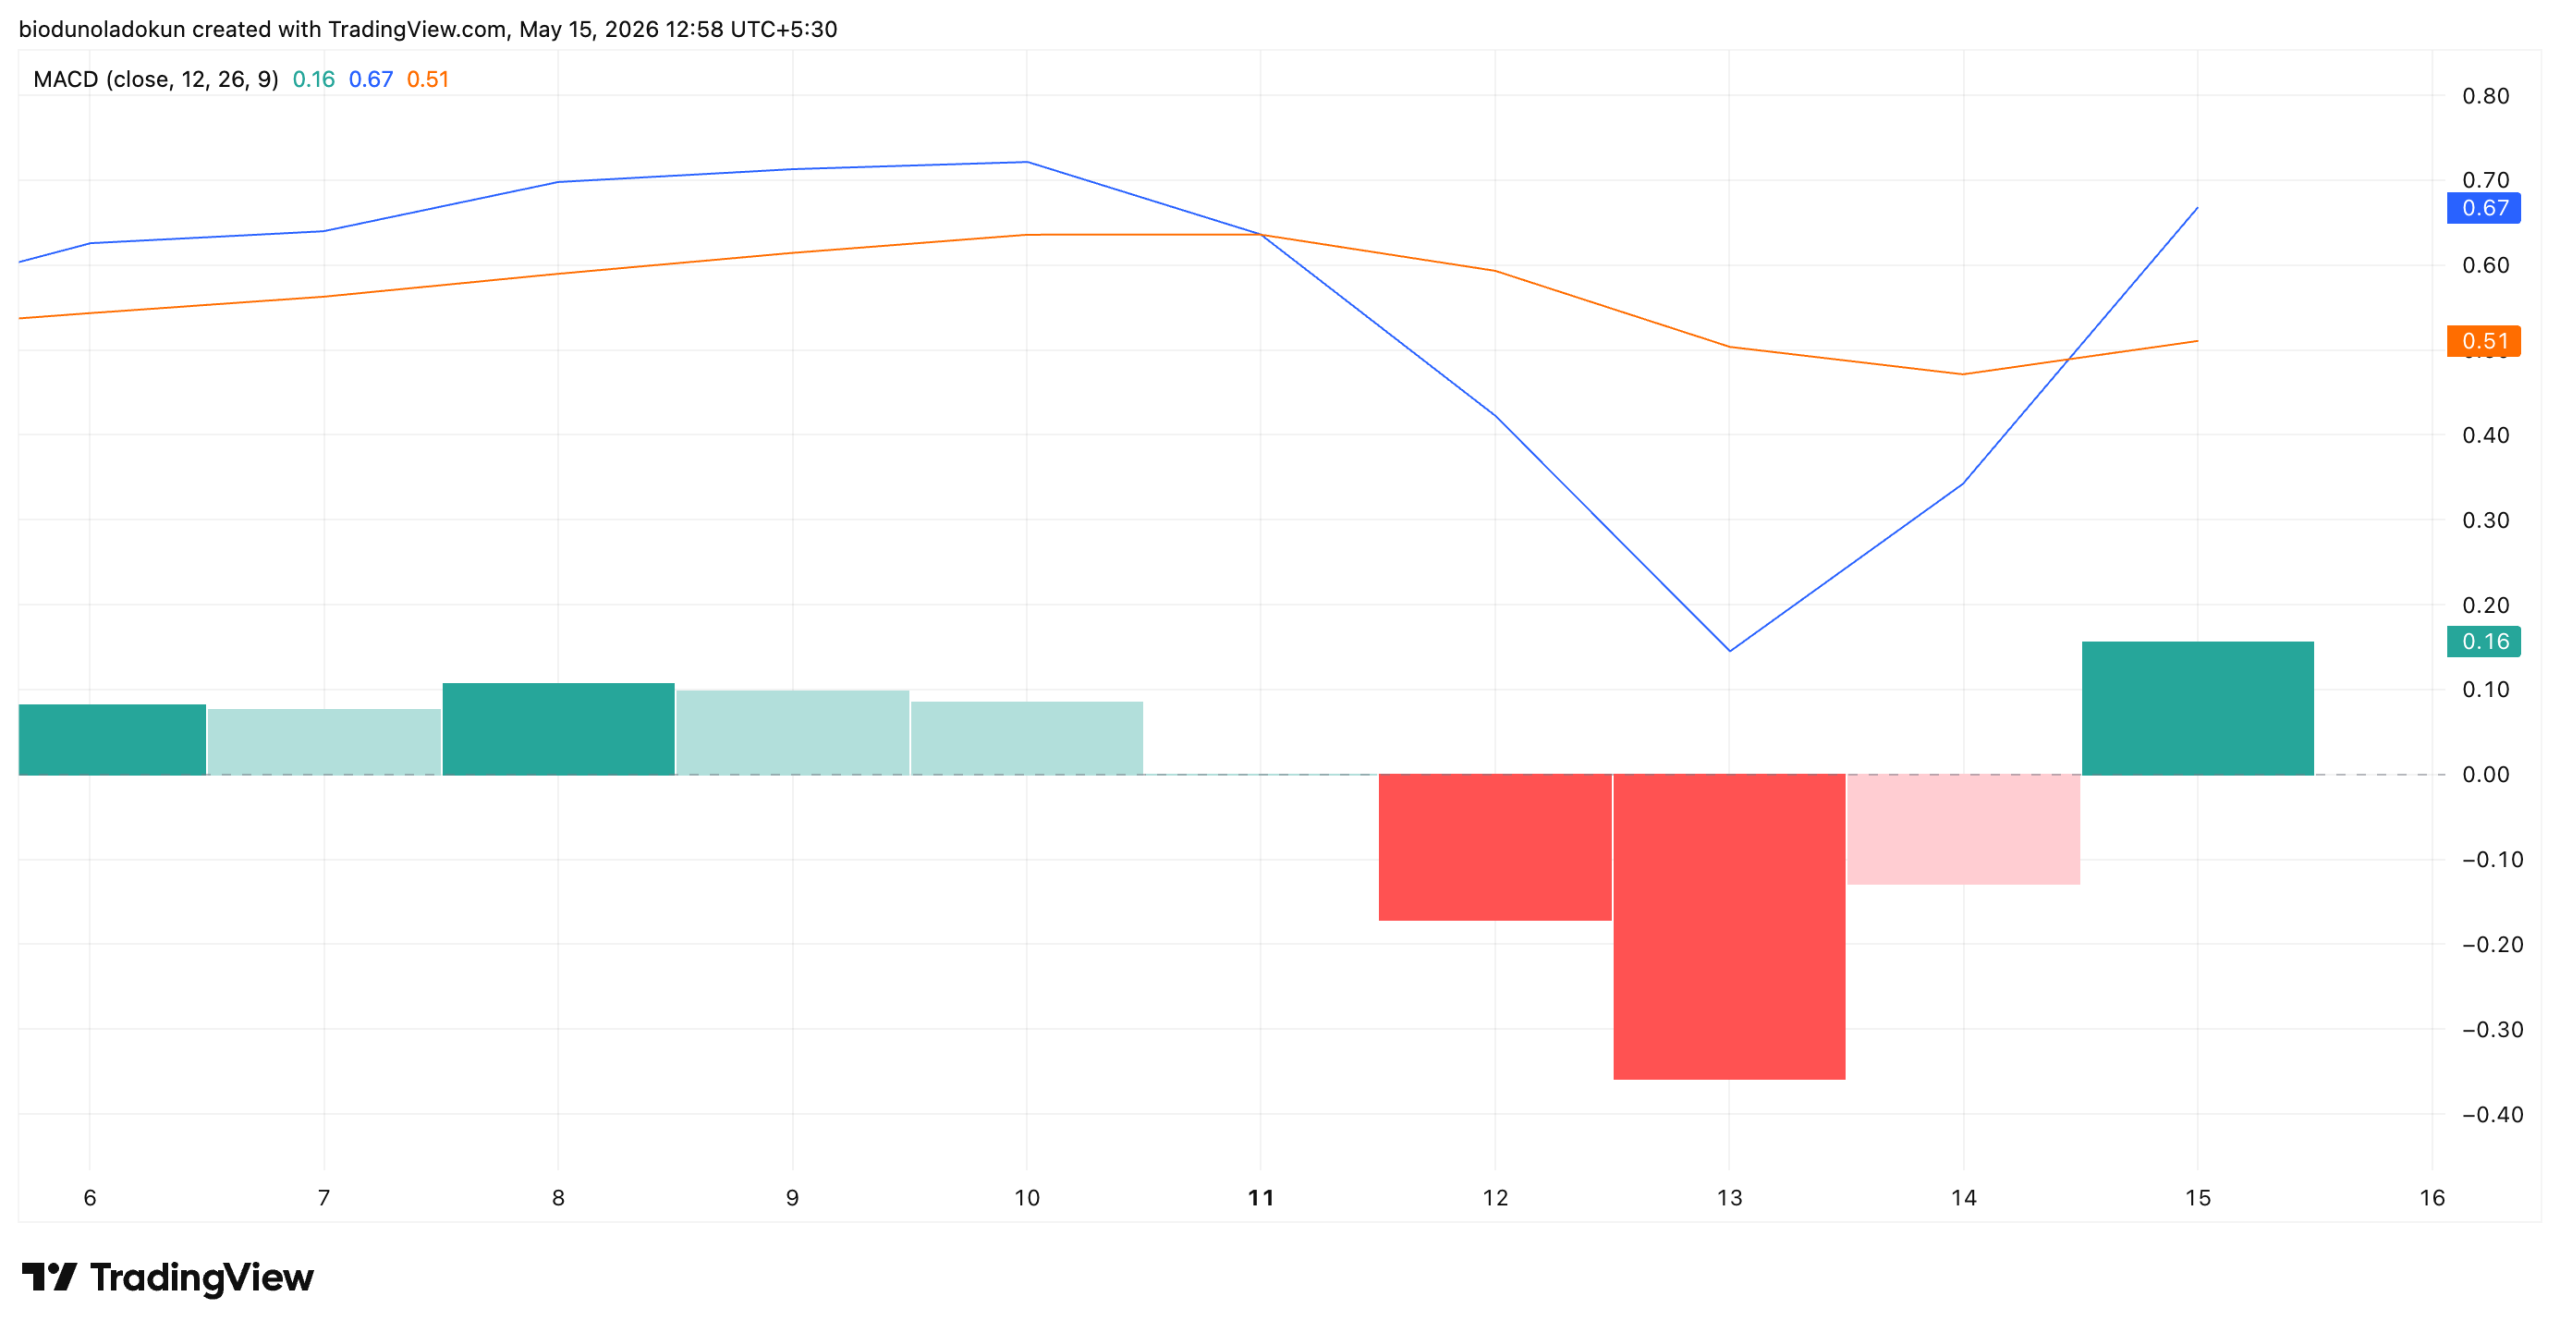
For example, the token’s Moving Average Convergence Divergence (MACD) has formed a bullish crossover today, confirming the uptick in buy-side pressure.
At press time, the MACD line (blue) is above the signal line (orange), and the indicator has printed its first green histogram bar over the past three sessions.
This can be taken as an early indication that HYPE bulls are regaining control and are attempting to push prices higher.
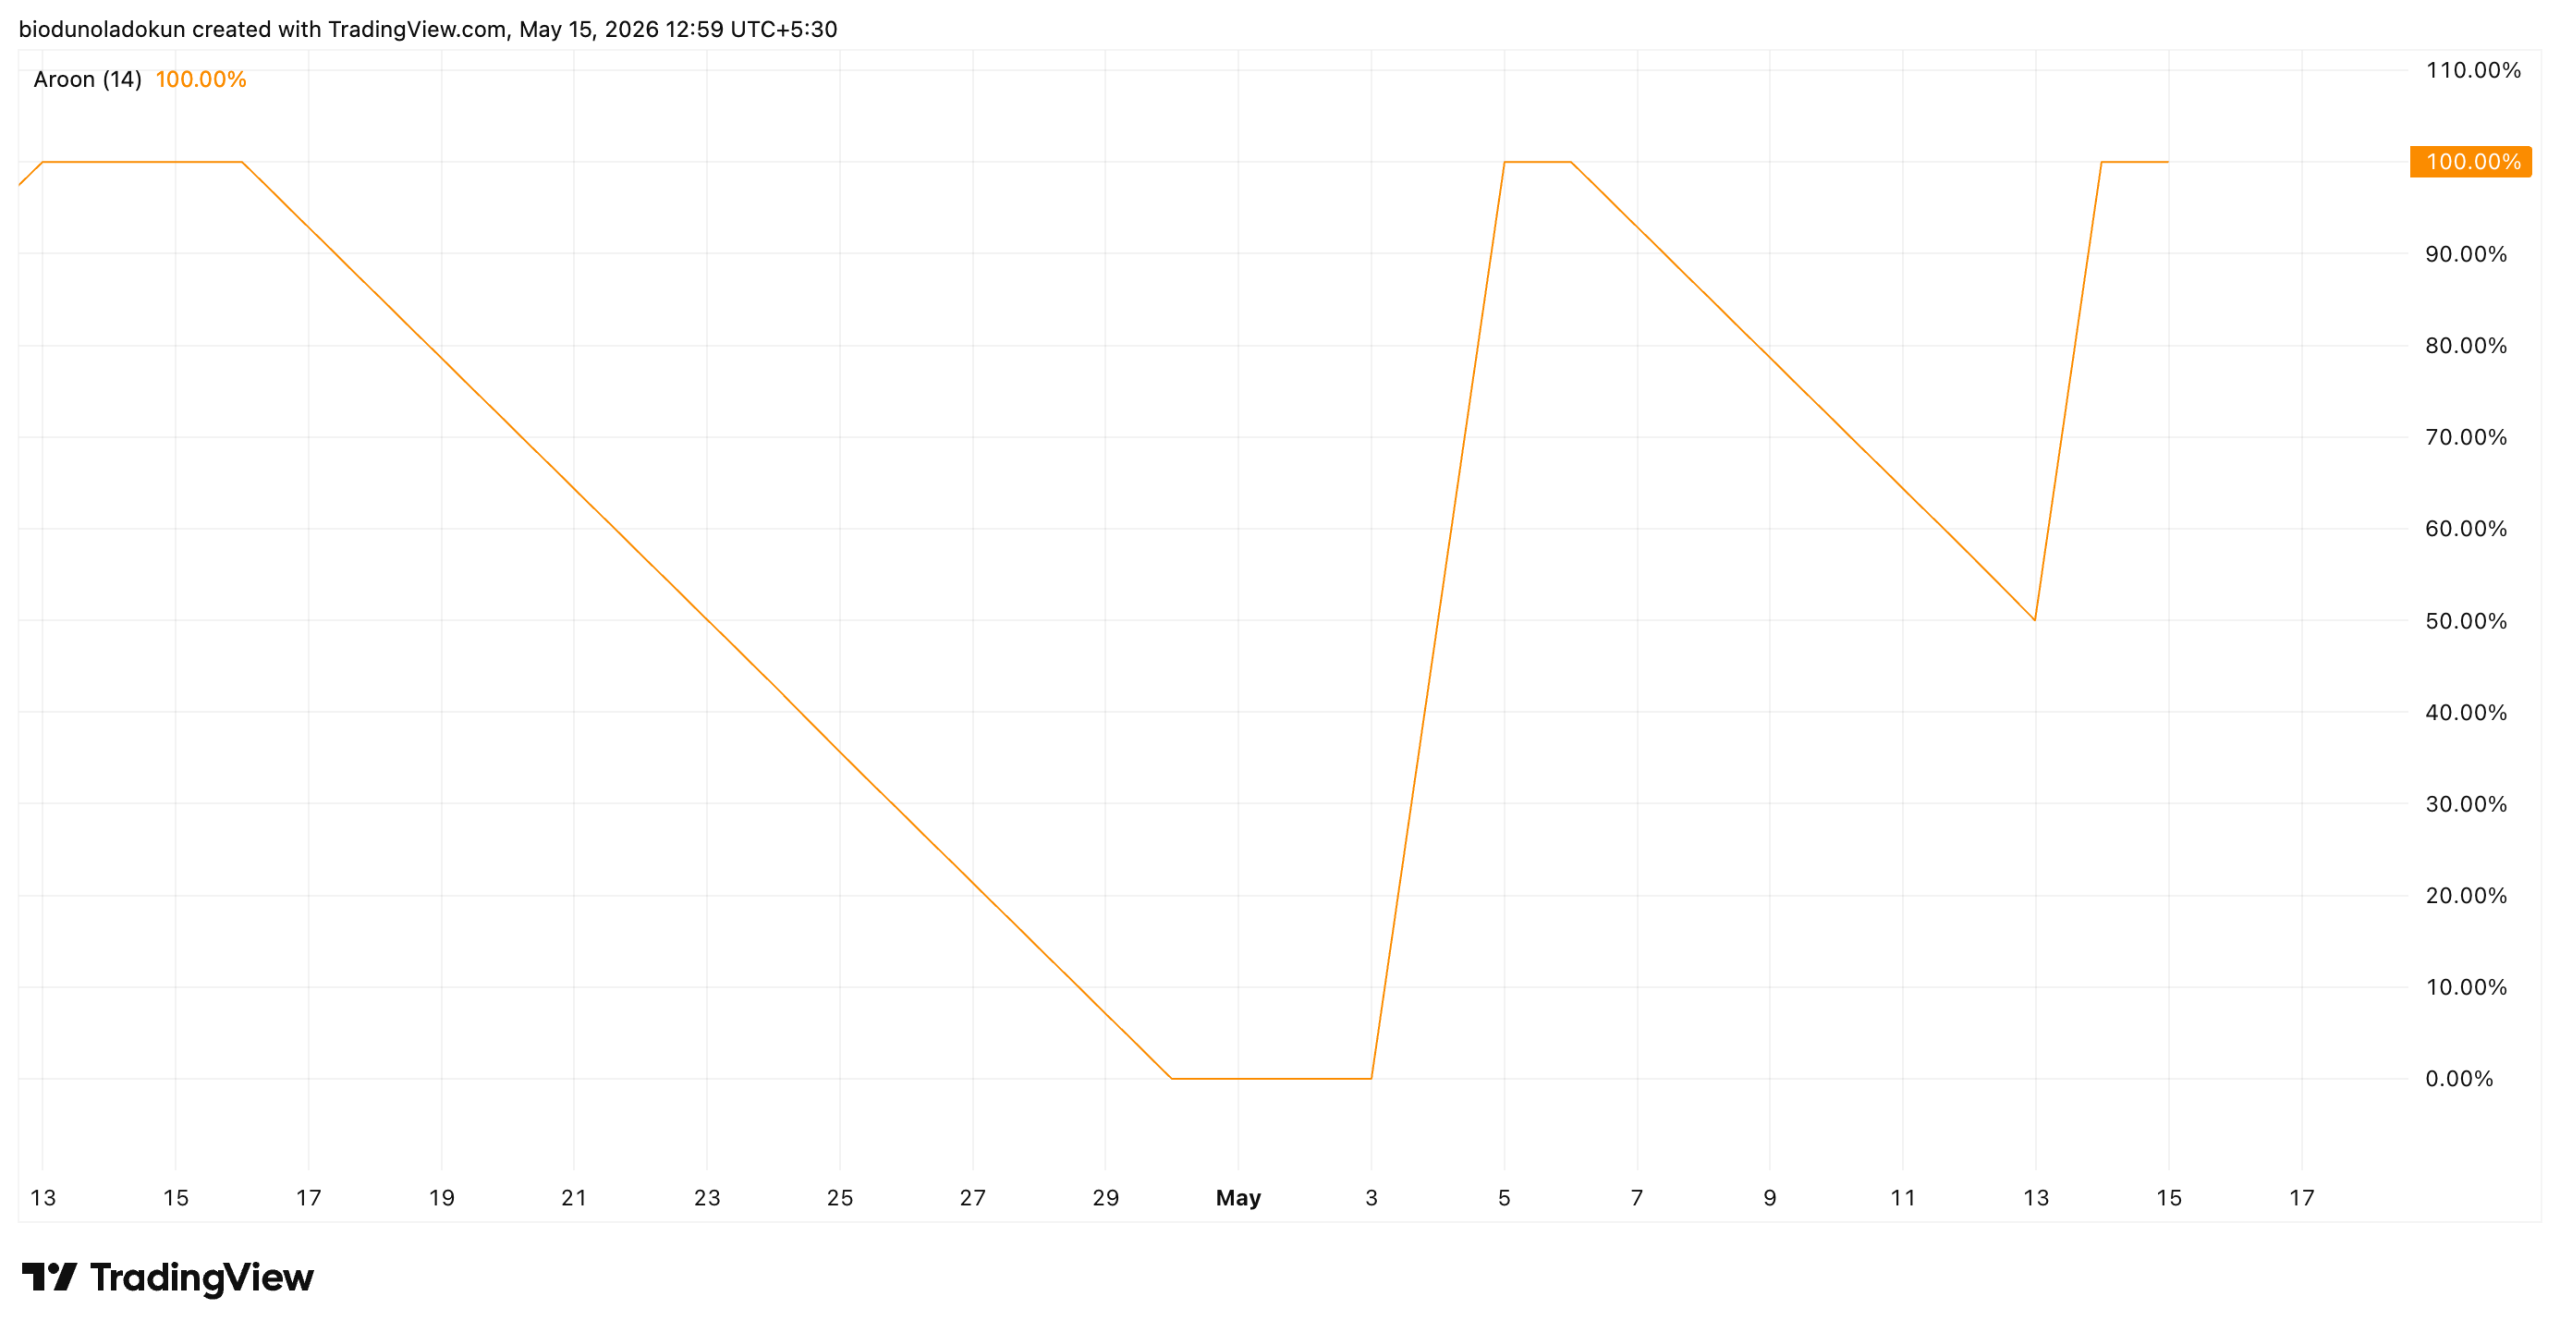
Moreover, HYPE’s Aroon Up Line is at 100% at the time of writing, confirming the strength of its current uptrend.
The Aroon indicator measures the strength and direction of a trend by analyzing the time since an asset’s recent highs (Aroon Up) and lows (Aroon Down).
When an asset’s Aroon Up line is at 100%, it indicates that demand is high and that its most recent high was reached very recently.
This is true for HYPE, which briefly traded at a seven-month high of $46.99 during Friday’s early morning session before re-coiling towards $45 by press time.
Futures Traders Flip Long
Among HYPE’s derivatives traders, sentiment has also improved over the past day.
According to Coinglass, the token’s long/short ratio flipped back above 1 yesterday, following 9 consecutive sessions in the red.
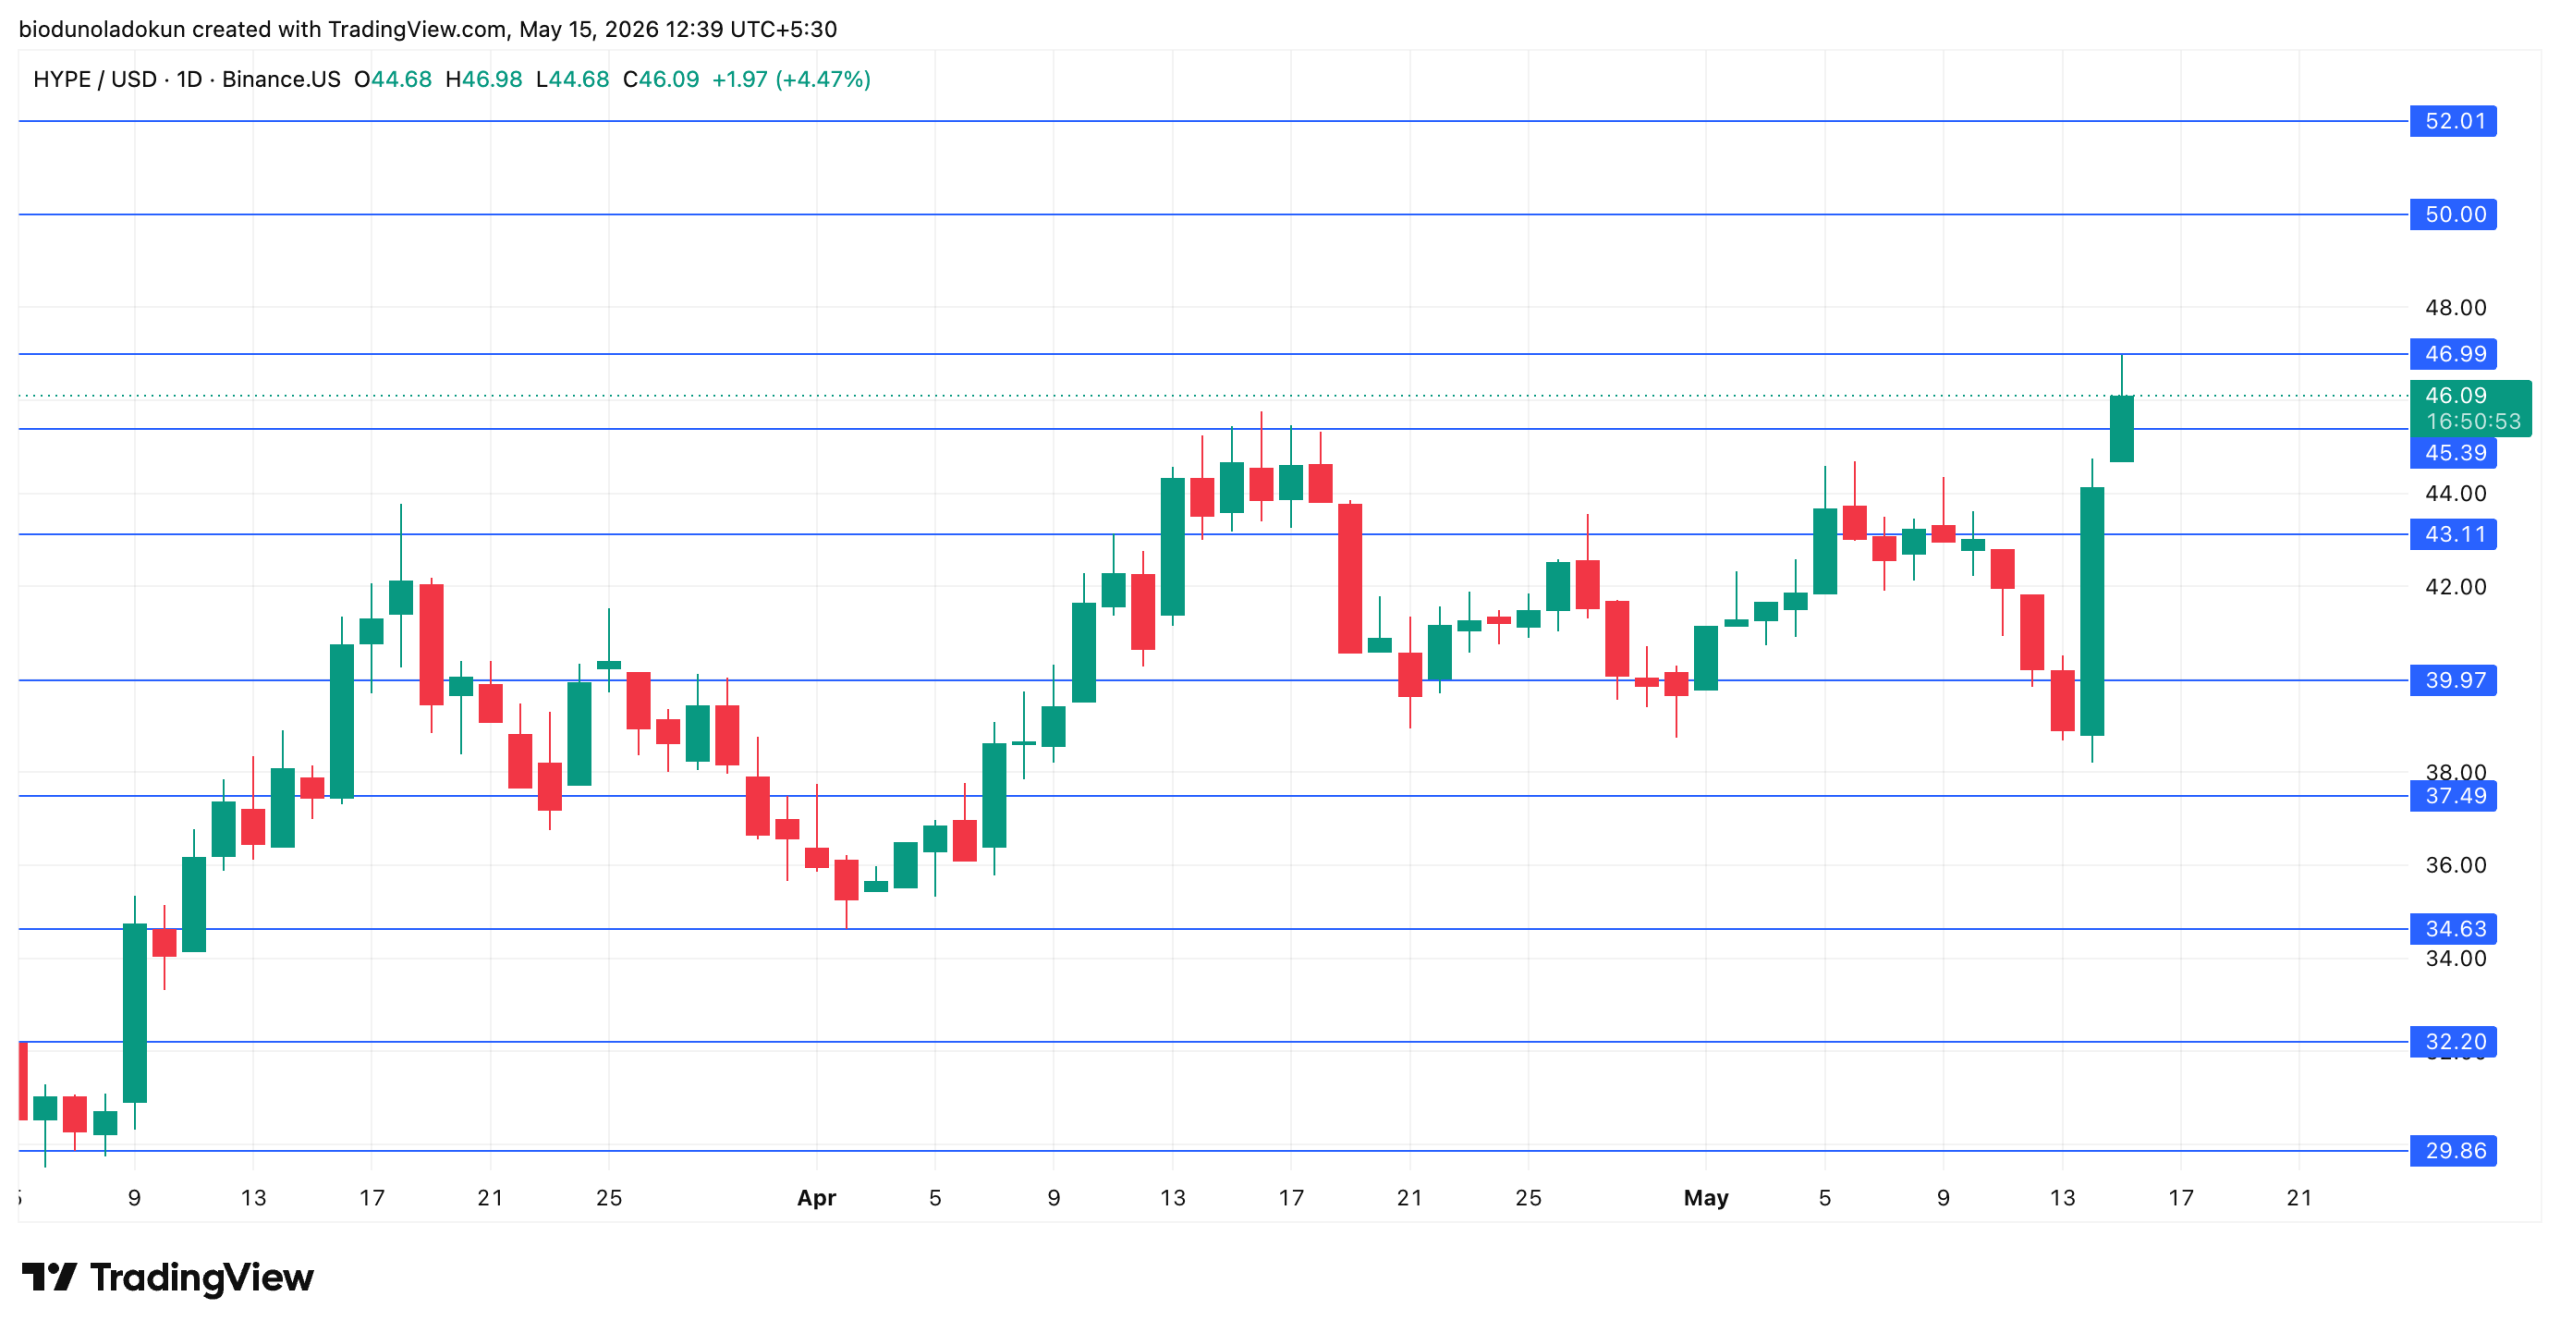
At press time, HYPE trades at $46.09, having broken decisively above the $43.11 resistance that had capped price action since mid-April.
If the Coinbase news continues to drive both spot and derivatives demand, the next immediate test sits at $46.99.
A daily close above this level would strengthen the breakout and open the door to $50.00, a key psychological resistance level that was last reached in October 2025.
However, if profit-taking returns to the market, HYPE may shed some of its recent gains.
It may fall below its current support at $45.39 and attempt to retest the breakout line at $43.11.
Disclaimer:
The information provided in this article is for informational purposes only. It is not intended to be, nor should it be construed as, financial advice. We do not make any warranties regarding the completeness, reliability, or accuracy of this information. All investments involve risk, and past performance does not guarantee future results. We recommend consulting a financial advisor before making any investment decisions.
Abiodun Oladokun is a Research Analyst at CCN, where he covers cryptocurrency markets with a focus on on-chain analysis, technical assessments, and emerging trends across decentralized finance (DeFi), real-world assets (RWA), artificial intelligence (AI), decentralized physical infrastructure networks (DePIN), Layer 2s, and meme coins.
Prior to CCN, he served as a Senior On-Chain Analyst at BeInCrypto, producing market reports spanning diverse crypto sectors.
Before that, he conducted technical analysis and market assessments of various altcoins at AMBCrypto, where he also contributed long-form quarterly research papers on DeFi, NFTs, DAOs, and scaling architectures, leveraging on-chain platforms including Messari, Santiment, DefiLlama, and Dune Analytics.
He began his crypto career as a research analyst at SixthSense DAO, developing blockchain forensic tools to trace the history of stolen assets.
Abiodun is a lawyer called to the Nigerian Bar and the founder of Ilé Ijó, a Lagos-based electronic dance music collective.