Hyperliquid’s user activity and perpetual transactions are declining, signaling that the platform’s active traders have sharply stepped back.
HYPE’s MACD has printed its first bearish crossover since February 9, signaling an uptick in bearish convictions.
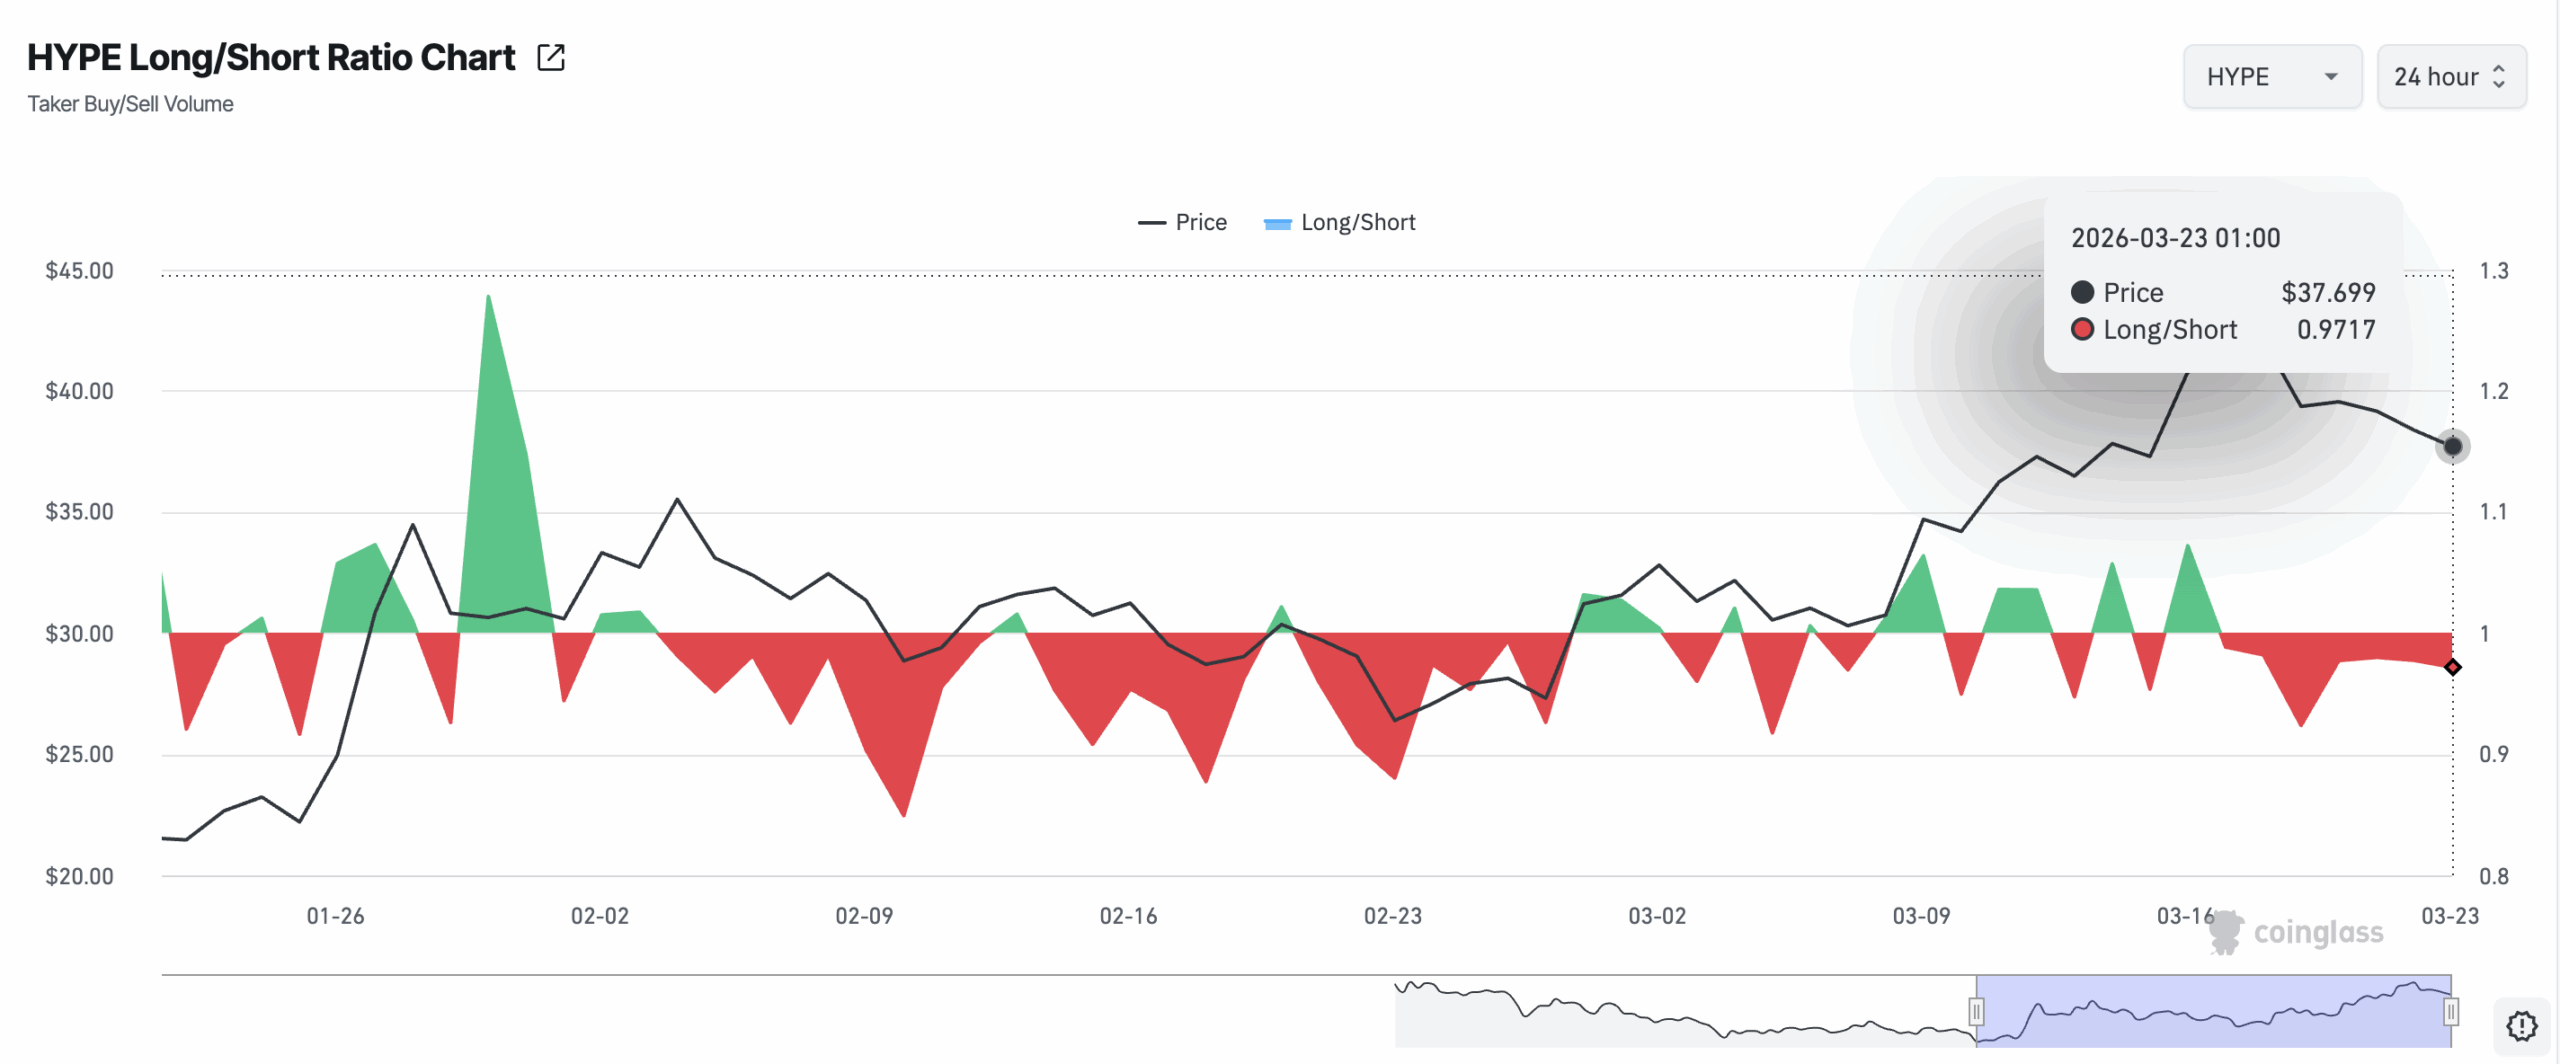
The long/short ratio has fallen to 0.97, reflecting a derivatives market increasingly positioned for further downside.
User activity on the decentralized exchange (DEX) HyperLiquid is declining, and the drop in engagement is now weighing on demand for its native token, HYPE.
With broader market sentiment turning bearish again after last week’s attempted recovery, the token risks plunging below $35 if current trends hold.
Falling Engagement on Hyperliquid Is Draining Demand for HYPE
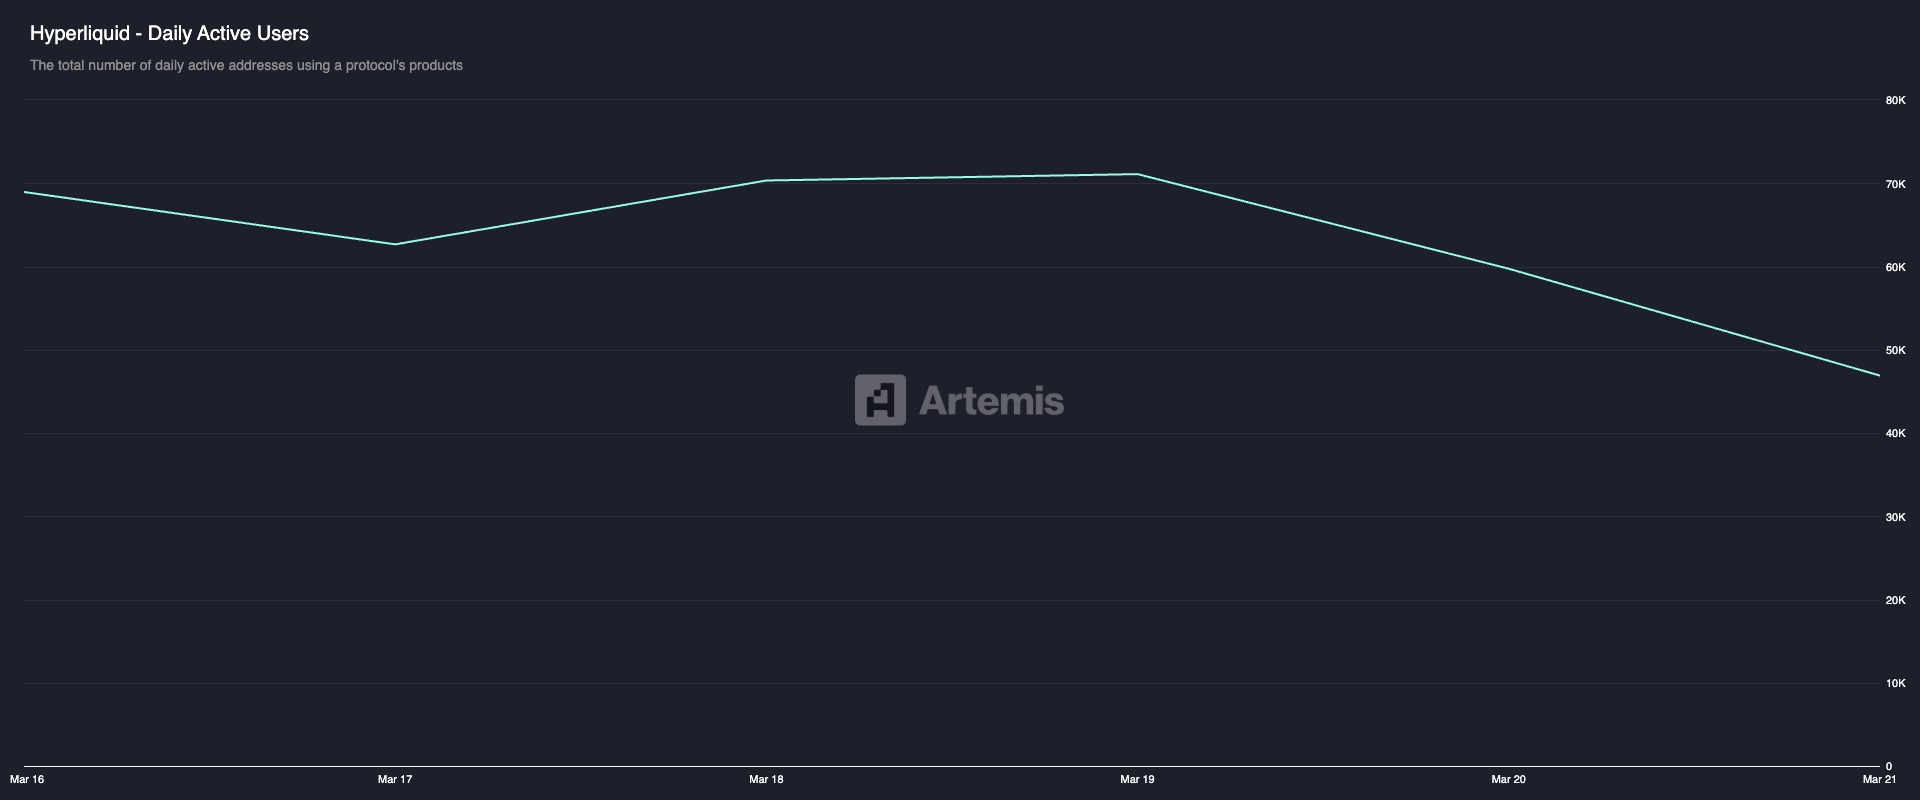
According to Artemis data, Hyperliquid’s Daily Active Users dropped 29% between March 16 and March 21.
In practical terms, roughly one in three active traders stopped using the DEX over that seven-day window.
When the active number of daily users on a protocol shrinks, it means that the engagements driving its ecosystem, like open positions, vault deposits, and liquidity provisioning, are contracting in real time.
Trends like this result in fewer transactions, lower fees, and reduced organic demand for HYPE, which is already affecting the token’s price.
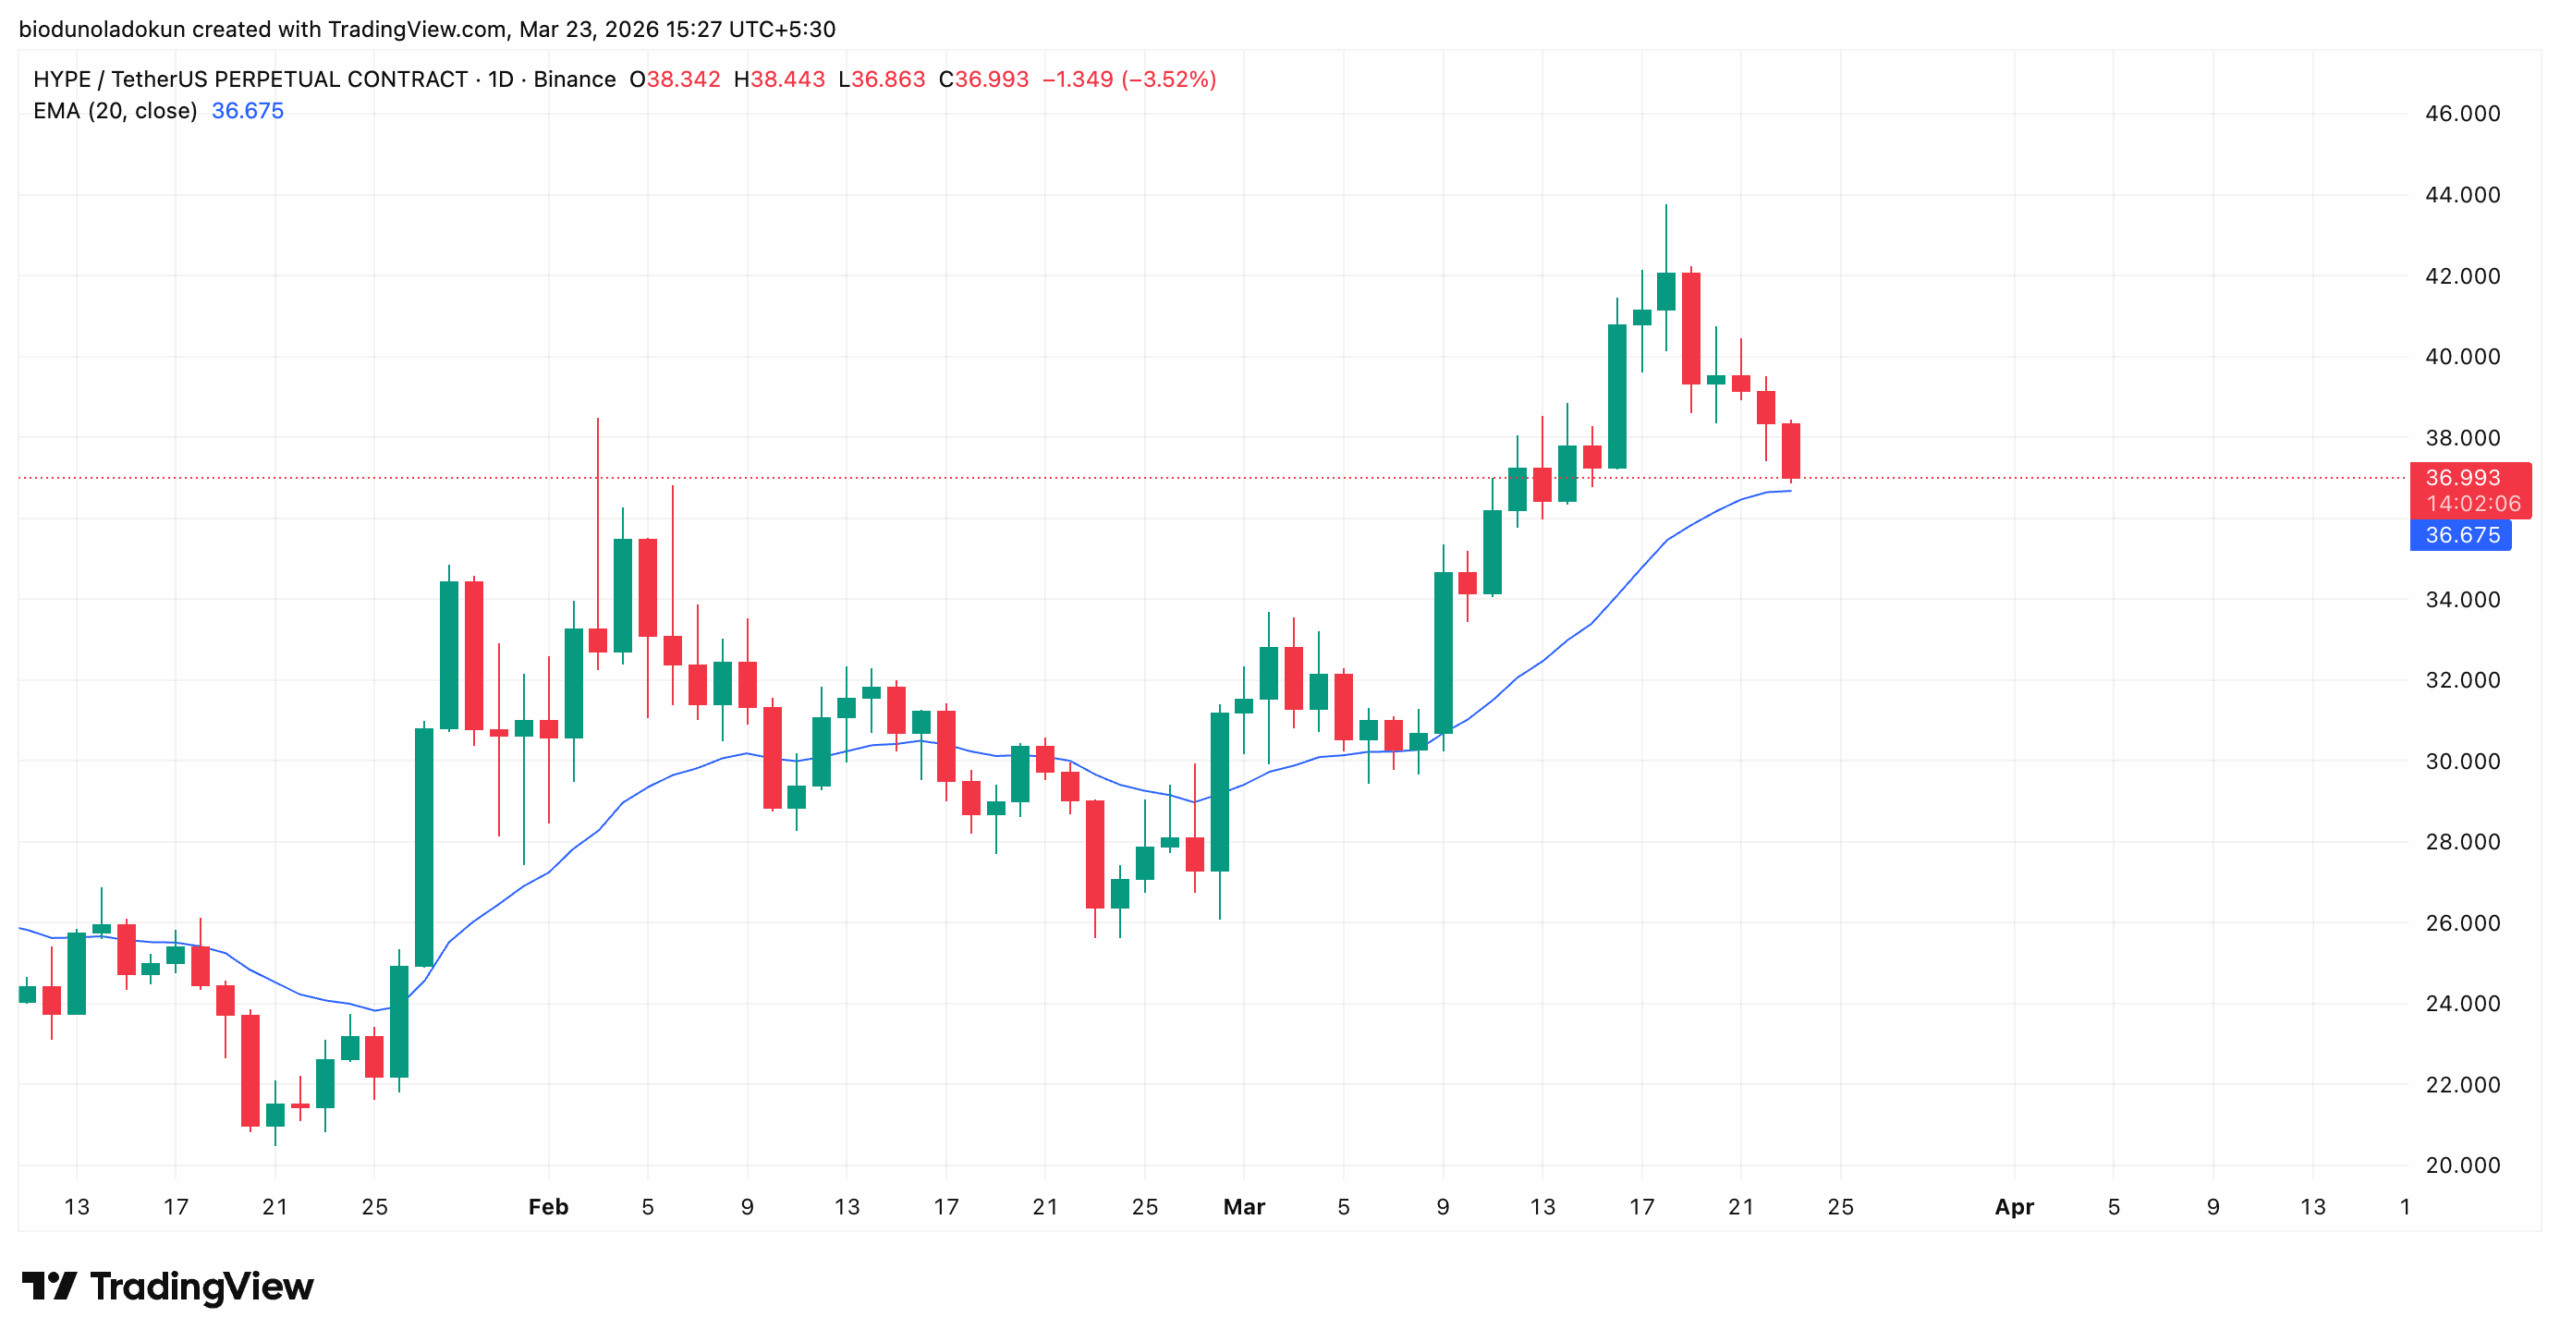
Trading at $37.07 at press time, the altcoin is down 15% since reaching a cycle high of $43.75 on March 18.
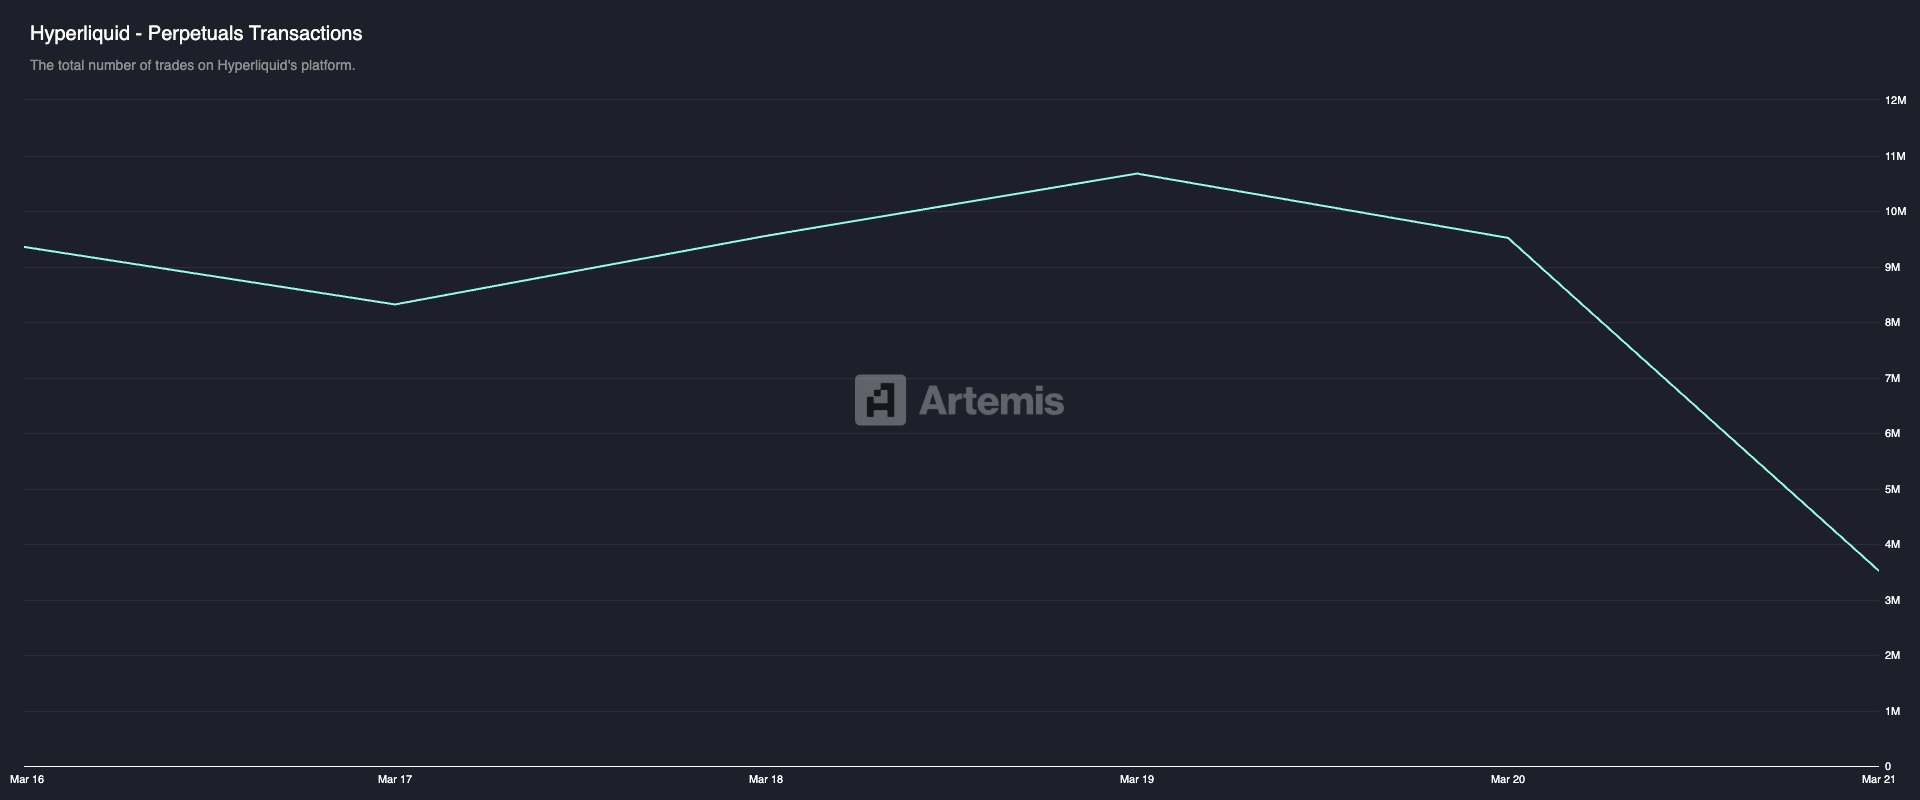
As the active user base fell, the daily count of perpetual transactions on the protocol collapsed 62% over the same period.
Together, the falling user count and declining transaction activity paint a bearish picture for HYPE, whose price is now struggling amid falling demand.
Bearish Momentum Builds on the Spot Market
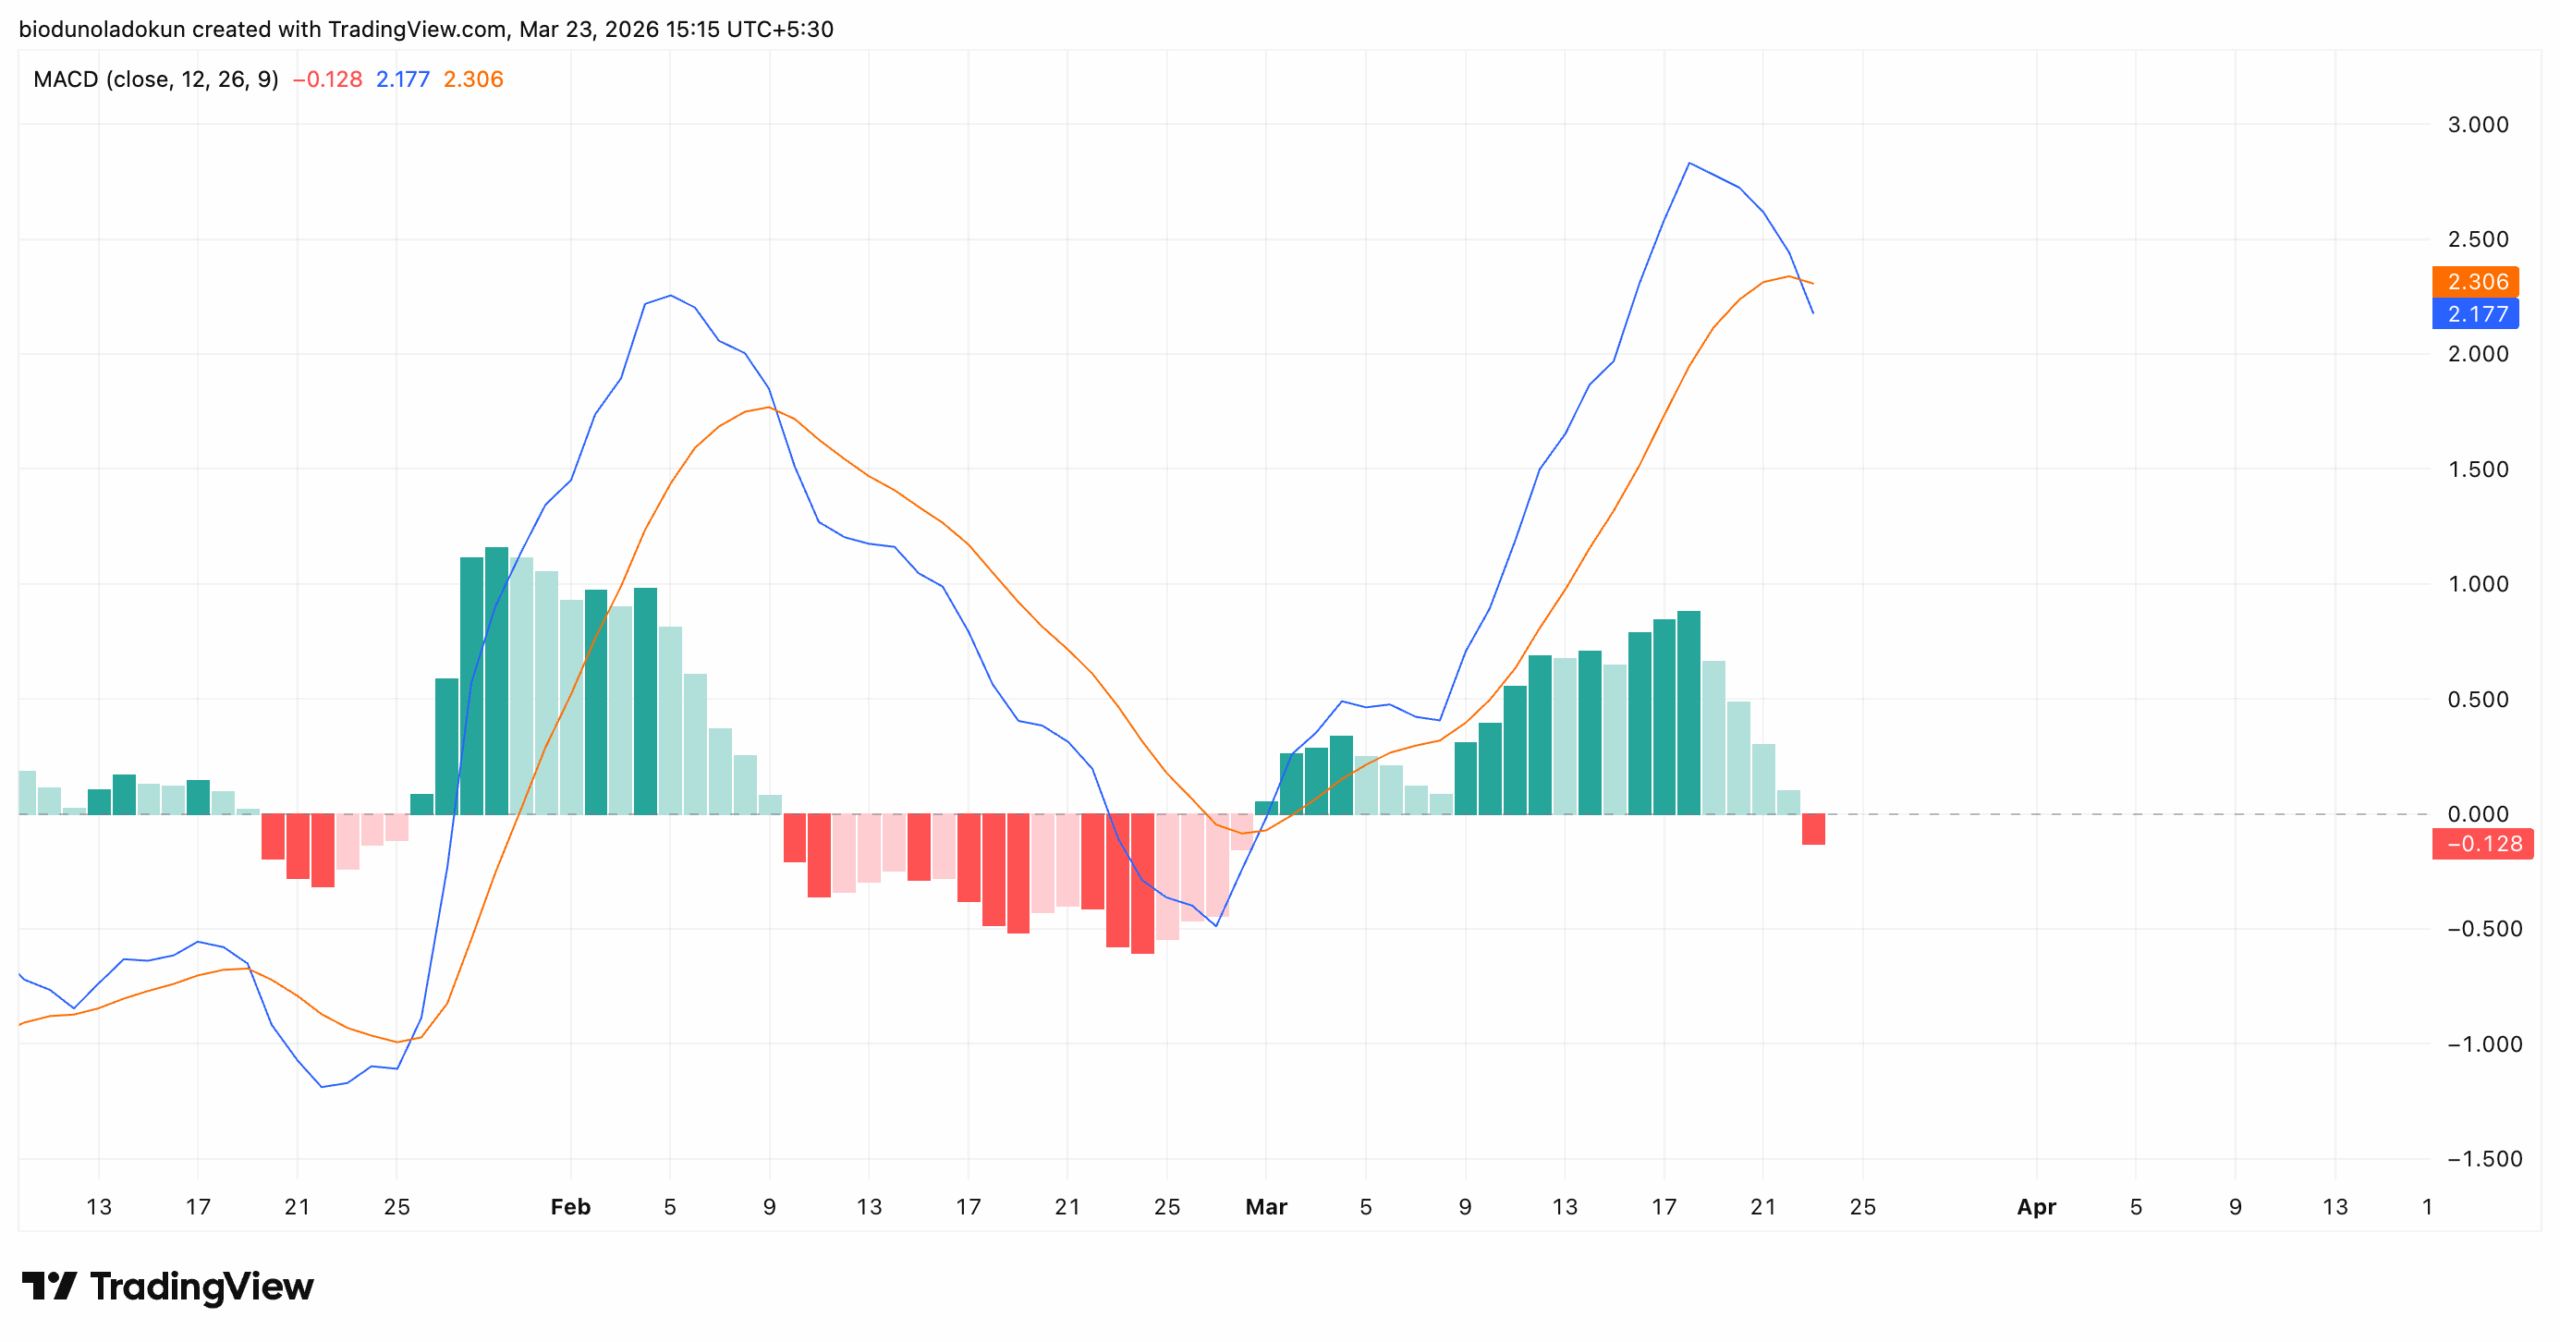
A series of bearish signals on HYPE’s daily chart confirms this outlook. Readings from the Moving Average Convergence Divergence (MACD) indicator show that the MACD line (blue) has crossed below the signal line (orange), marking the first time this has occurred since February 9.
Alongside this crossover, the histogram has printed its first red bar since March 1, confirming that bulls have officially handed control back to the bears.
The MACD is a trend and momentum indicator that helps traders identify shifts in market direction through the relationship between its two lines.
When the MACD line crosses below the signal line, and the histogram turns red, it signals that downward momentum is building and that sellers are beginning to overpower buyers.
The last time this exact crossover occurred was in early February, pushing HYPE’s price downward for nearly three weeks before any recovery materialized.
Furthermore, HYPE trades at $37, hovering near its 20-day Exponential Moving Average (EMA), poised to break below it. At press time, the 20-day EMA is providing support at $36.67.
This key moving average measures an asset’s average price over the past 20 days, giving more weight to recent prices.
When the price stays above it, the near-term trend is considered bullish and intact. On the other hand, when the price breaks below, it signals that momentum has shifted against the asset, and the bears now have control.
If demand weakens and HYPE’s price falls further, a close below its 20-day EMA could cause it to shed some of its recent gains.
Short Sellers Are Piling Into HYPE
In the derivatives market, HYPE’s long/short ratio has shifted decisively, with demand for short positions surging since its price decline began on March 18. Per Coinglass, this sits at 0.97 as of this writing.
This ratio tracks the balance between traders betting on price increases (longs) versus those betting on declines (shorts).
When the ratio is above 1, it indicates that long positions dominate. However, a ratio below 1, like HYPE’s, signals that short positions are in greater demand, suggesting bearish expectations.
Sub-$35 Is the Target for HYPE Bears
With Hyperliquid usage declining and indicators pointing to waning demand for HYPE, the token risks breaking below its 20-day EMA.
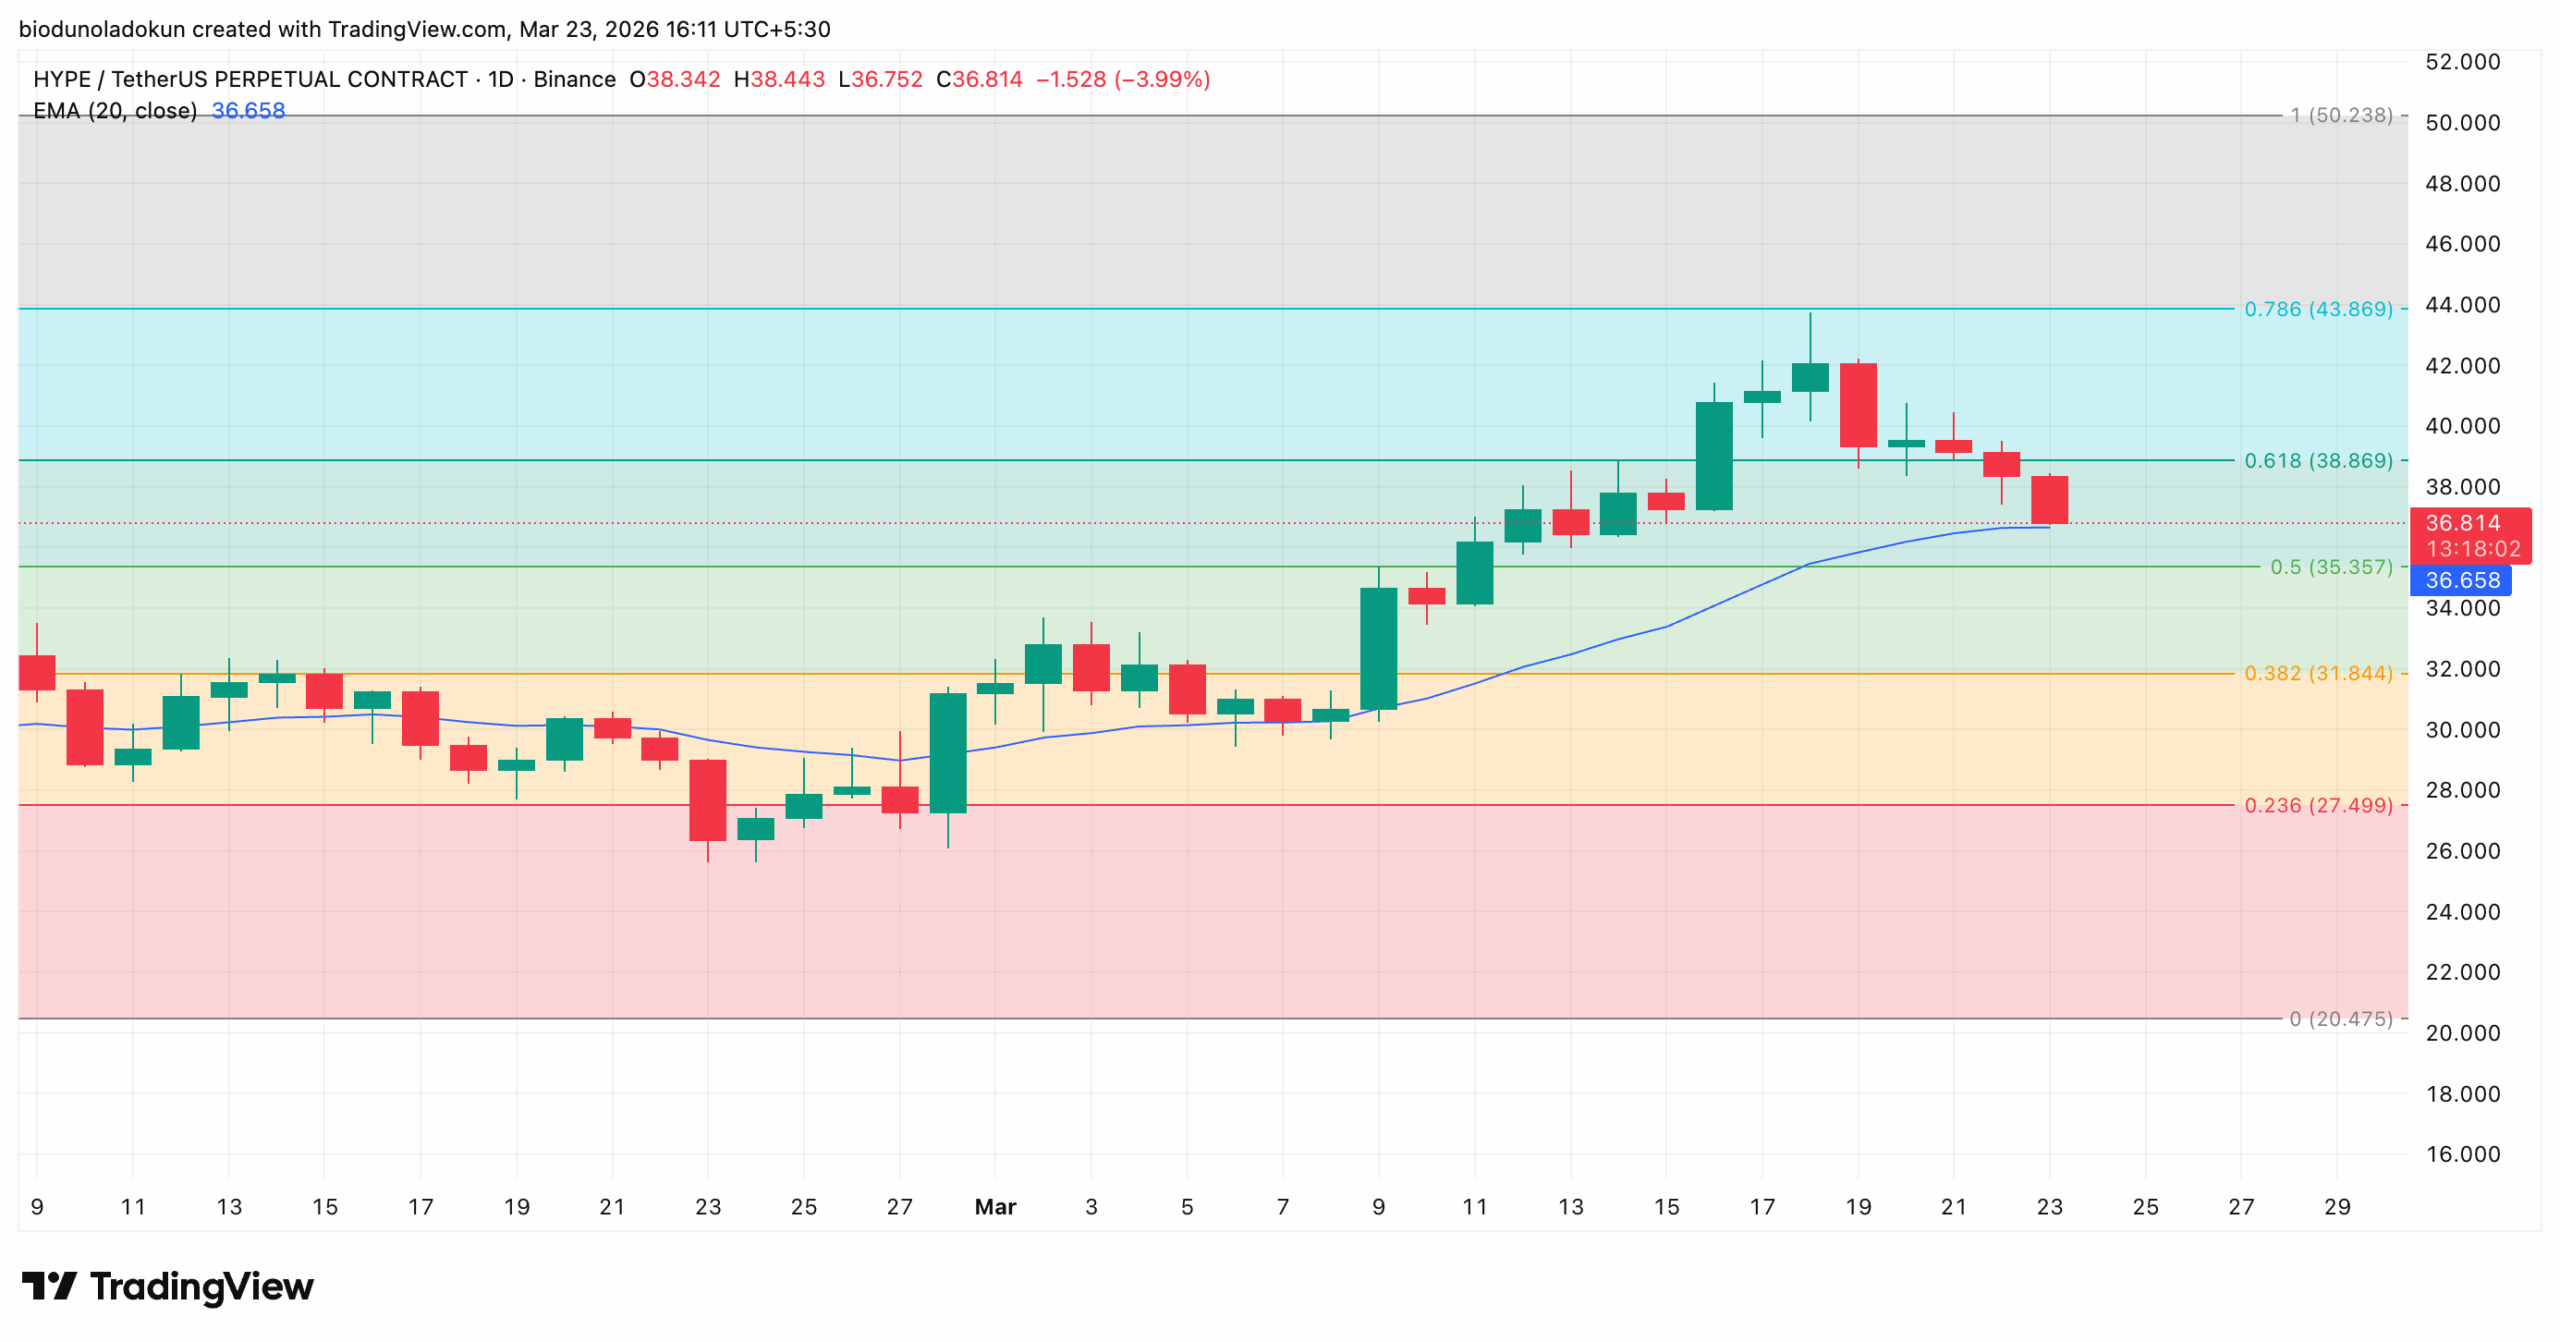
A break below the floor at $36.67 could lead to a steeper dip to the 0.5 Fibonacci retracement level at $35.35.
Should the bulls fail to defend this level, HYPE could fall towards $31.84.
However, if Hyperliquid’s user activity improves and drives up HYPE’s demand, the token could reverse its downtrend and attempt to climb above $38.86.
Disclaimer:
The information provided in this article is for informational purposes only. It is not intended to be, nor should it be construed as, financial advice. We do not make any warranties regarding the completeness, reliability, or accuracy of this information. All investments involve risk, and past performance does not guarantee future results. We recommend consulting a financial advisor before making any investment decisions.
Abiodun Oladokun is a Research Analyst at CCN, where he covers cryptocurrency markets with a focus on on-chain analysis, technical assessments, and emerging trends across decentralized finance (DeFi), real-world assets (RWA), artificial intelligence (AI), decentralized physical infrastructure networks (DePIN), Layer 2s, and meme coins.
Prior to CCN, he served as a Senior On-Chain Analyst at BeInCrypto, producing market reports spanning diverse crypto sectors.
Before that, he conducted technical analysis and market assessments of various altcoins at AMBCrypto, where he also contributed long-form quarterly research papers on DeFi, NFTs, DAOs, and scaling architectures, leveraging on-chain platforms including Messari, Santiment, DefiLlama, and Dune Analytics.
He began his crypto career as a research analyst at SixthSense DAO, developing blockchain forensic tools to trace the history of stolen assets.
Abiodun is a lawyer called to the Nigerian Bar and the founder of Ilé Ijó, a Lagos-based electronic dance music collective.