BTC is likely to remain in consolidation | Credit: Hameem Sarwar
Share
Key Takeaways
On March 18 and 19, U.S. spot Bitcoin ETFs recorded back-to-back trading volumes of $21.4 billion and $21.1 billion.
Despite the high volume, the seven-day inflow streak ended on March 18 with a $163.5 million net outflow for Bitcoin ETFs.
On-chain data shows that BTC is positioned between its 1.0x Realized Price ($54,355) and its 2.4x band ($130,453).
$21 billion on March 18, and another $21 billion on March 19.
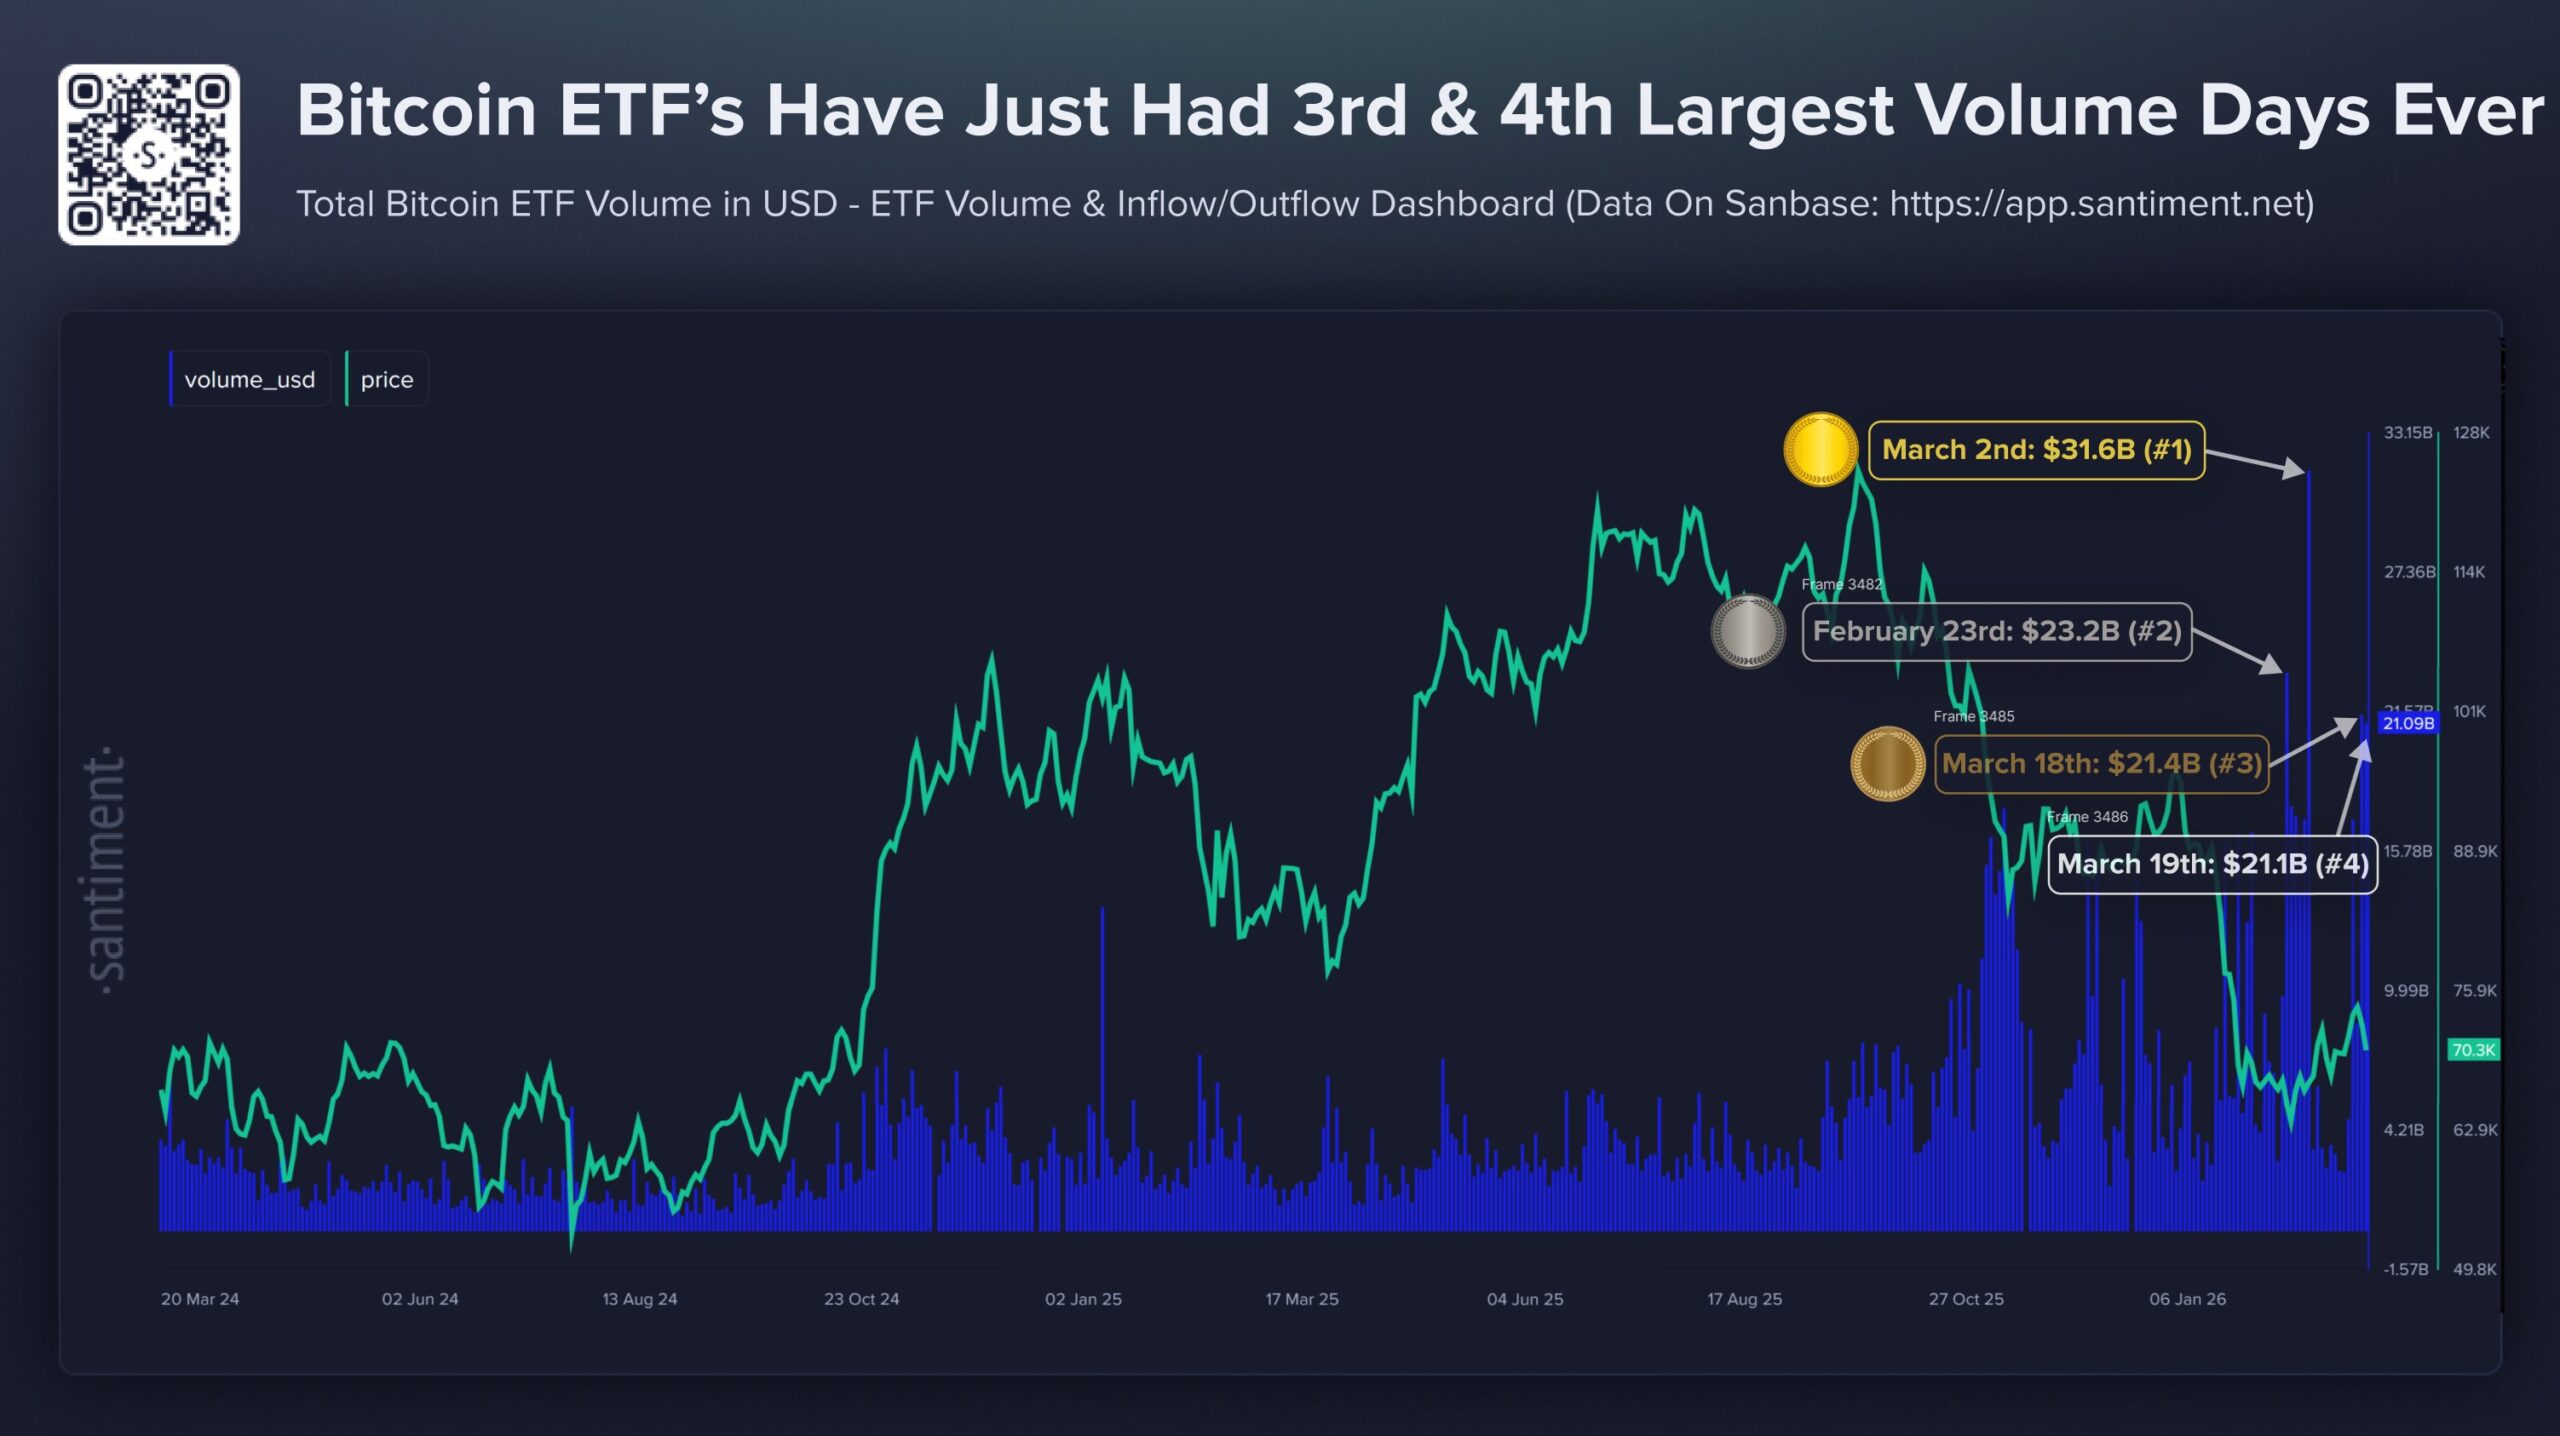
Those are not ordinary numbers. They represent the third- and fourth-largest single-day trading volumes since the launch of spot Bitcoin ETFs in the U.S.
Yet Bitcoin’s (BTC) price is lagging. But why, and what does this imply for Bitcoin’s price?
The Historic Context — Where These Numbers Rank
First, let’s establish the full picture. The four largest Bitcoin ETF trading volume days since inception now read as follows.
March 2 holds the record for the single-largest day of ETF activity in the instrument’s history, at $31.6 billion.
February 23 sits second at $23.2 billion.
March 18 is now third at $21.4 billion.
March 19 is fourth at $21.1 billion.
Consequently, three of the four largest Bitcoin ETF trading days ever have occurred within the last few days.
That concentration of extraordinary volume activity in such a compressed timeframe is not coincidental.
It is a direct response to the geopolitical and macro volatility that has defined the market since the escalation of the Middle East conflict.
However, volume and Bitcoin’s price direction are not the same thing, and that distinction is at the heart of this situation.
Why High Volume Does Not Always Mean Higher Prices
The instinctive assumption is that massive ETF volume equals massive buying pressure, which in turn equals a higher Bitcoin price.
According to CCN’s findings, this is largely because Bitcoin ETFs played a major role as the coin hit its all-time high.
For context, shortly after launch, Bitcoin’s price broke out to $40,000 in Q1 2024.
But that assumption contains a critical error.
ETF trading volume measures total activity (buying and selling combined). It does not distinguish between capital entering and exiting the market.
So, a $21 billion volume day could represent $10.5 billion of buying and $10.5 billion of selling. The price impact of that period would be negligible despite the extraordinary headline number.
But beyond the Bitcoin ETFs volume, on-chain data also shows why BTC is lagging.
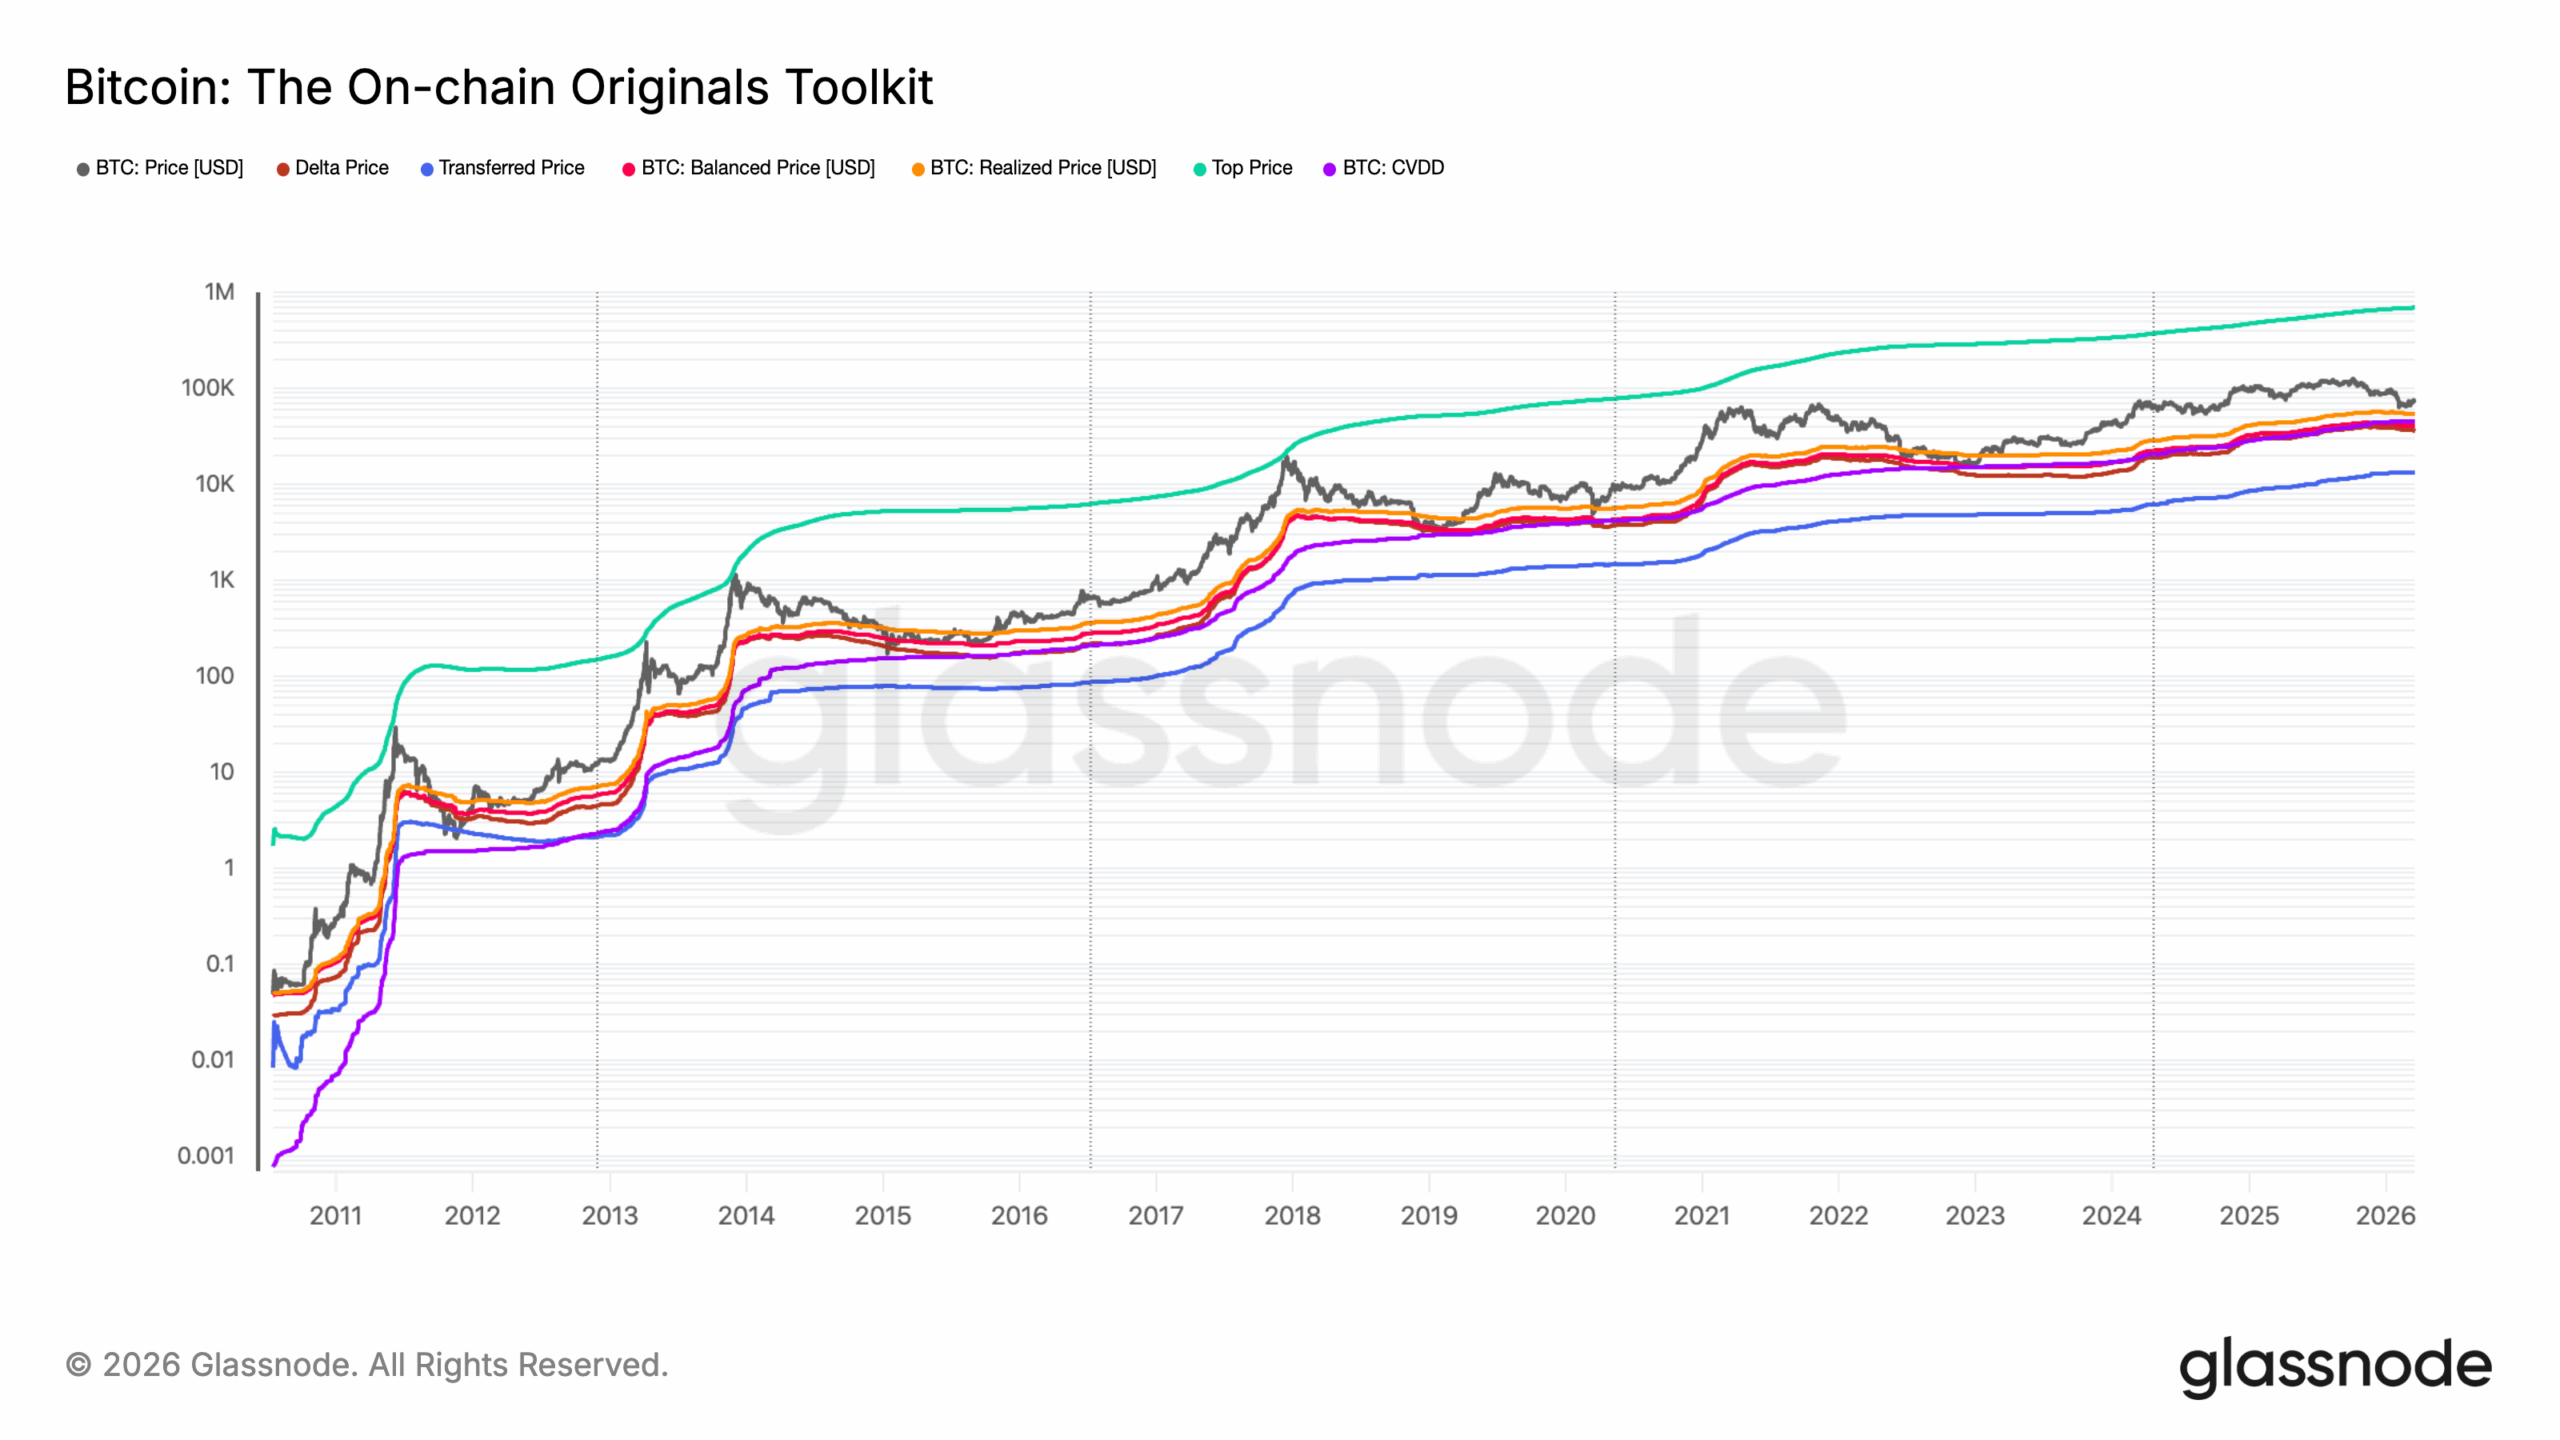
According to Glassnode’s The On-Chain Originals Toolkit (plotted on a logarithmic scale from 2010 to 2026), the BTC price sits well within a historically mid-range zone, with significant implications.
Currently trading around $70,000, Bitcoin clusters tightly around the Realized Price and Balanced Price models.
Historically, price compressing near these two levels signals a transitional phase. In past cycles, tops only formed when the price stretched aggressively toward the Top Price model.
Meanwhile, the CVDD and Delta Price models remain far below the current Bitcoin price. This suggests the market is nowhere near deep value territory either. Instead, BTC occupies a mid-cycle sweet spot.
Bitcoin: The On-chain Originals Toolkit | Credit: Glassnode
The Transferred Price (blue) sits around $10,000, reinforcing that long-term on-chain cost basis remains deeply below spot.
What’s striking, however, is the trajectory of every model. So, as it stands, Bitcoin’s price might not experience a notable correction, but a short-term BTC breakout is off the table.
BTC Price Outlook: Where It Stands
Further assessment of on-chain data shows that Bitcoin is sending a familiar signal.
According to Glassnode’s Realized Price multiples chart, BTC closed at $69,922 on March 19, 2026. At that time, it sat squarely between the 1.0x Realized Price at $54,355 and the 2.4x Realized Price at $130,453.
That position matters enormously. In every previous cycle, price trading between these two bands represented the mid-bull accumulation zone.
Historically, cycle tops only printed when BTC pushed above the 3.2x Realized Price, currently sitting at $173,937. Price hasn’t come close to that level yet.
Meanwhile, the 0.8x Realized Price at $43,484 now acts as critical support. This level has historically marked deep bear market capitulation zones. The fact that BTC trades well above it reinforces that the bear market floor is firmly behind us.
What’s particularly striking is the current price positioning. BTC sits closer to the 1.0x band than to the 2.4x band, suggesting the market has not yet priced in the full bull-cycle premium.
There’s meaningful upside before historically overbought territory begins.
Furthermore, each cycle’s 3.2x top band has risen above the previous one, reflecting network growth. This cycle’s equivalent ceiling sits nearly $104,000 above spot price.
The model doesn’t guarantee outcomes. However, on a historical basis, the risk/reward still favors bulls at current levels.
Disclaimer:
The information provided in this article is for informational purposes only. It is not intended to be, nor should it be construed as, financial advice. We do not make any warranties regarding the completeness, reliability, or accuracy of this information. All investments involve risk, and past performance does not guarantee future results. We recommend consulting a financial advisor before making any investment decisions.
Victor Olanrewaju is a crypto analyst and reporter at CCN with deep roots in on-chain research and technical analysis. His crypto journey began in 2017, but it was the 2020 Uniswap airdrop that sparked a full-time pivot into the space.
With a foundation in copywriting, Victor honed his craft creating high-converting content for leading crypto brokers — most notably an XRP price prediction that ranked #1 on Google during the 2021 bull run.
He later joined AMBCrypto in 2022, where he combined storytelling with technical and on-chain analysis to cover key market narratives.
In 2024, he expanded his expertise at BeInCrypto, collaborating with analysts and using tools like Glassnode, Santiment, and IntoTheBlock to break down Bitcoin and altcoin trends.
At CCN, Victor covers the top cryptocurrencies, memecoins, macro shifts, blending real-time insights with deep-dive metrics.
He holds a Bachelor’s degree in Physics from the University of Ibadan, equipping him to simplify complex data for a wide audience. Follow his work or connect on LinkedIn or X.