Stock Market Erases Trump Bloodbath But S&P 500 Hits Alarming Milestone


The Dow plummeted 660 points as the first main yield curve inversion since 2007 ignited panic on Wall Street. | Source: Drew Angerer / Getty Images / AFP
By CCN.com: The US stock market has reclaimed all of Monday’s massive Trump-induced trade war selloff, returning valuations to previous highs that are utterly unsustainable over the long-term.
President Trump triggered a 3% market selloff on Monday, after saying that he would effectively double down on the China trade war.
American manufacturers oppose tariffs because they have drawn an equivalent Chinese response – hence the term “trade war” – reducing foreign demand for American-made products. They also lead to increased costs for US consumers.
Yet the stock market roared back over the next three days, culminating in today’s 214.66 point Dow Jones Industrial Average rally. What’s going on?
Investors Wisen Up to Trump’s Jawboning
There are two reasons for this bounce-back.
First, the market is starting to realize that Donald Trump is playing the long game with China. Trump is no idiot. He’s a master strategist who understands the negative impact that a trade war creates on US manufacturers and consumers.
Trump’s trade war strategy is part of a holistic foreign relations policy with China.
Geopolitics is a game of intersecting webs, where pressure in one area – such as tariffs – can induce an opponent to behave differently in other areas. China is such a powerful global presence that merely viewing the trade war in a vacuum misses that Trump likely has a broader strategy in play.
The market figured this out, and after the emotional selling burst on Monday, cooler heads prevailed
FOMO: Why the Market Keeps Going Up
There’s another factor in this market recovery: FOMO. This fear of missing out on a big rally drives hedge funds and institutions right back into the market after a selloff.
That’s because the overall US economy is booming. GDP has increased an average of 3% over the past five quarters, the labor force participation rate has been stable as unemployment has declined, small business optimism remains high, and wages are rising.
With all that going for America, investment dollars are more likely to get back into the market than sit on the sidelines.
Yet it’s surprising – and dangerous – that money continues to flow into equity markets considering how insanely overpriced it remains.
Stock Market Now Second Most Expensive in History
The Schiller P/E Ratio, which measures the price-to-earnings ratio based on average inflation-adjusted earnings from the previous 10 years, remains at its second highest in history, at 30.2.

The only other time the market has been more overvalued was during the 1999 dot-com bubble when the Schiller P/E ratio hit 44. The other high water mark was on Black Tuesday in 1929, when it hit 30.
How out of whack is the Schiller P/E ratio at 30.2? The mean is 16.6, meaning the market is almost twice as high as the average since 1870.
The Stock Market’s Dirty Secret: Growth Is Driven by Debt
Hiding behind all this liquidity flooding into both the economy and the market is a dirty little secret. Huge chunks of this money have been borrowed.
With the Fed holding rates at historic lows for much of the past decade, cheap capital has been drawn down by everyone from institutions to the American consumer.
This chart shows the relationship between the amount of margin debt on Wall Street and the S&P 500. They are highly correlated. While margin debt is not at the $670 billion level it hit last year, it remains high at $580 billion.

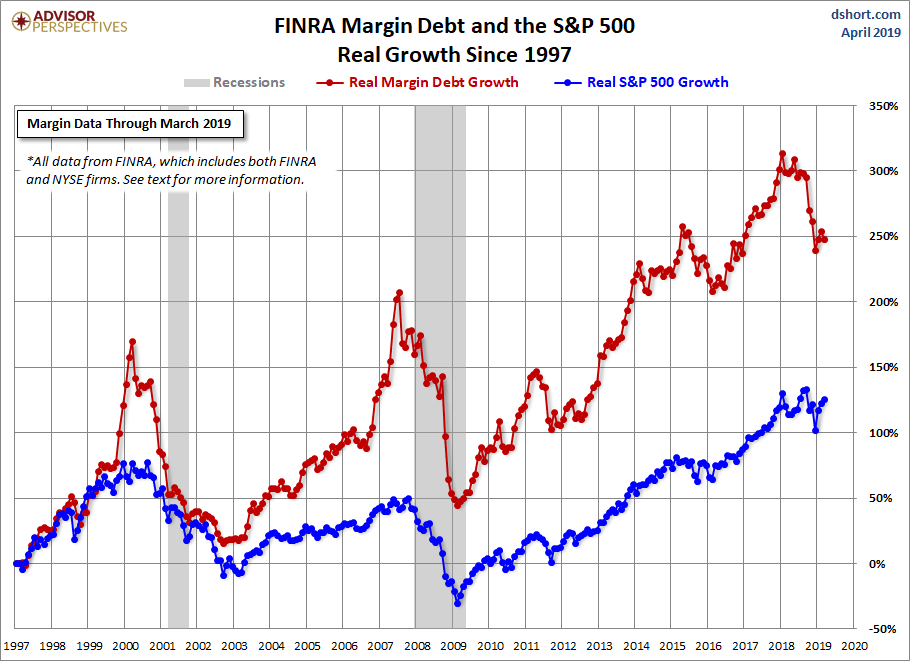
Even more alarming is this chart, which shows real growth in debt and market value. The market is up 125% since 1997, on the back of a whopping 250% increase in debt.
This all points to a crash at some point. Invest wisely.
Disclaimer: The views expressed in the article are solely those of the author and do not represent those of, nor should they be attributed to, CCN.com.
