Bitcoin's 2026 Crash Was Written Into the Halving Calendar — Here's the Evidence
Share
Key Takeaways
Bitcoin’s 27.7% drop in 2026 closely mirrors the post-halving bear market pattern seen in previous cycles.
Historical data shows Bitcoin peaks roughly 12–18 months after each halving before entering a prolonged correction.
If the cycle repeats, Bitcoin could reach a market bottom around October 2026, though ETF adoption may alter the pattern.
Bitcoin’s 2026 looks like a disaster. The price has fallen 27.7% since January, sliding from $87,520 to around $63,255, and it now sits 49% below the record high set last October. Headlines call it a crash, but the data calls it a schedule.
Strip the panic away, and the decline maps almost perfectly onto a rhythm Bitcoin has repeated after every one of its halvings, the roughly four-year supply cuts that have anchored its boom and bust cycles since 2012. Seen through that lens, the 2026 selloff is not a shock. It is the bear phase of a clockwork cycle, arriving close to on time.
Bitcoin’s Halving Cycle Continues to Follow a Predictable Pattern
The evidence starts with timing. Bitcoin’s mining reward halves about every 4 years, and each halving has been followed by a blow-off top about a year later. Working only from daily prices, the two halvings inside the modern record line up with uncanny precision.
The May 2020 halving gave way to a cycle peak on November 9, 2021, exactly 18.0 months later, at $67,617. The April 2024 halving led to a record of $124,774 on October 7, 2025, just 17.6 months later. Two supply cuts, two peaks, spaced within two weeks of each other.
Stretch back further, and the rhythm holds.
The 2016 halving preceded the December 2017 top by about 17.3 months, and the first halving in 2012 led to a peak roughly 12 months on. Four cycles, four peaks, each landing between 12 and 18 months after its supply cut. That is not the signature of a market lurching at random, but it is closer to a metronome.
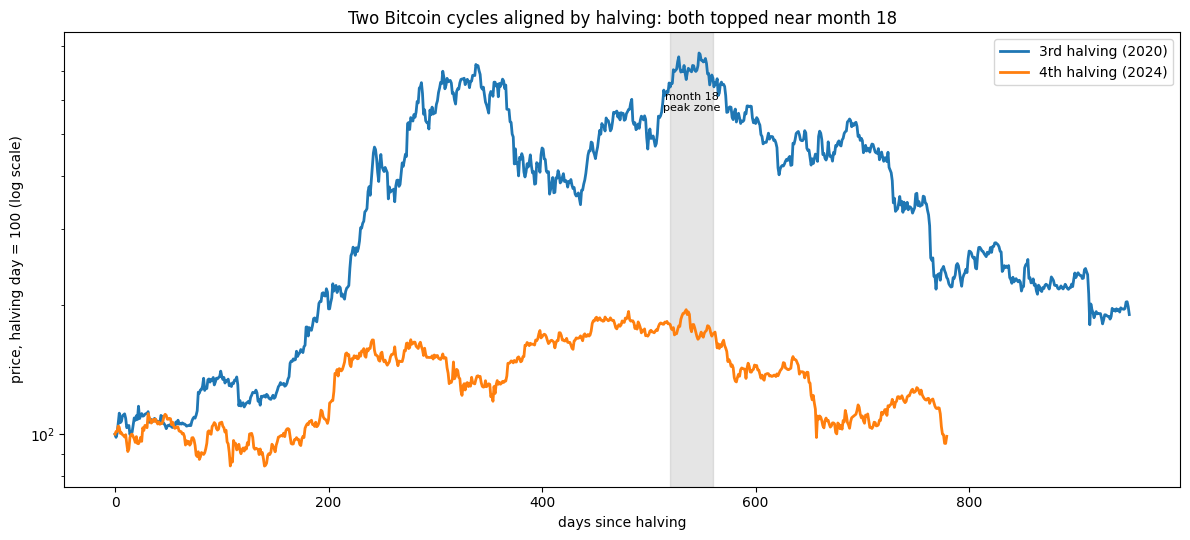
Two Bitcoin cycles aligned by halving, both topped near month 18. | Credit: Dr. Guneet Kaur (created via Python)
Where Bitcoin Sits in the Cycle Now
Overlay the last two cycles on a single axis, indexed to the day of each halving, and the shape is almost the same drawing twice. Both climb steadily, accelerate into a peak around month 18, then roll over into a long decline.
At the time of writing, Bitcoin sits 25.6 months past the April 2024 halving and 8 months past the October peak. On the aligned chart, that places the current cycle firmly in the post-peak downslope, exactly where the 2020 cycle was bleeding through the back half of 2022.
In other words, the moment that feels like a market breaking down is, on this map, the market doing precisely what it did last time at the same point on the calendar.
2026 Decline Fits the Template
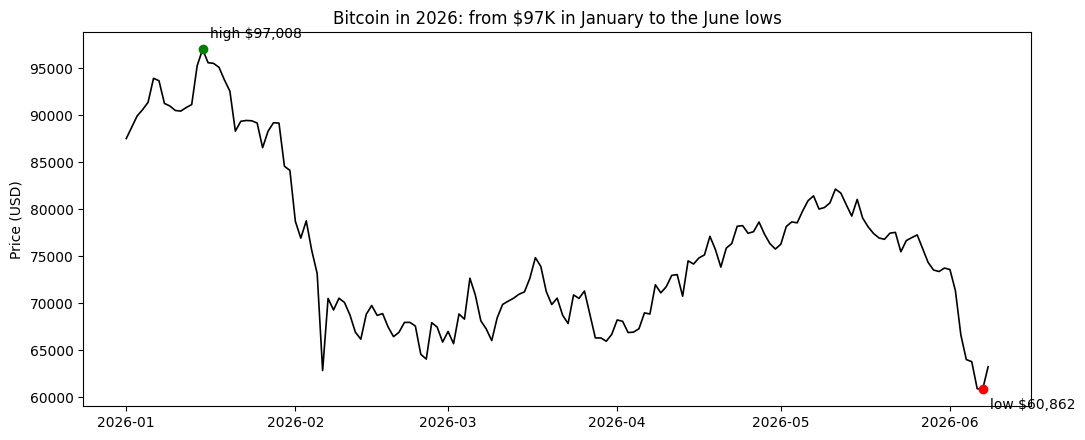
Zoom into this year and the fit gets sharper. Bitcoin opened 2026 near $87,520, spiked to its yearly high of $97,008 on January 15, then never saw that level again. The damage came in two waves. February collapsed 21.7%, including a single 14.1% drop.
A spring rally lifted prices 13.6% in April but stalled near $82,000, fully 15% below the January high. June then delivered the second leg down, off 14.2%, dragging Bitcoin to a year low of $60,862. The result is 84 down days against 74 up days and roughly $24,266 erased from every coin.
Bitcoin in 2026, from $97K in January to the June lows. | Credit: Dr. Guneet Kaur (created via Python)
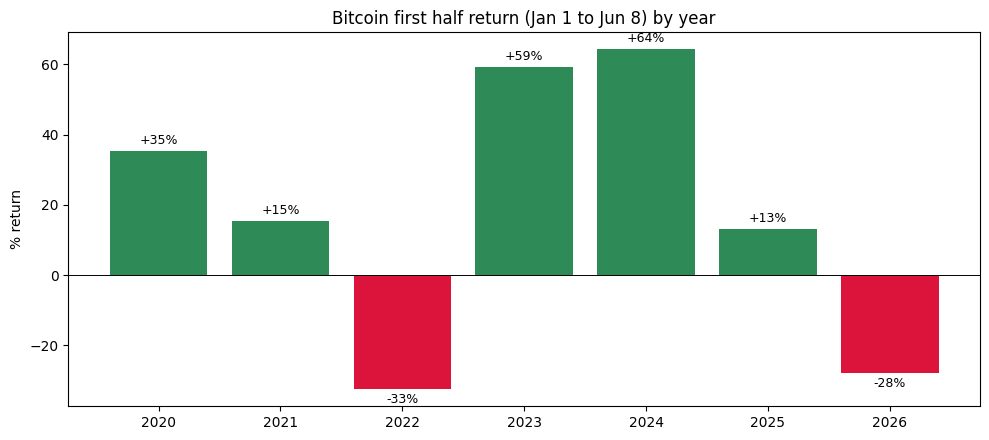
Set against history, the year stands out for the wrong reasons. Measured from January 1 to June 8, Bitcoin’s 27.7% loss is its second-worst first half on record, beaten only by the 2022 collapse. In the modern dataset, every other year was positive over the same window, several of them sharply so.
Yet that comparison is the point. The only prior year that looked this grim, 2022, was itself the post-peak phase of the previous halving cycle. History is not just rhyming. It is repeating the same verse.
Bitcoin first-half returns by year, 2020 to 2026. | Credit: Dr. Guneet Kaur (created via Python)
What the Calendar Points to Next
If the cycle is running to form, the obvious question is: when will the pain end? Here, the last cycle offers a marker:
Bitcoin peaked on November 10, 2021, and bottomed exactly 365 days later, in November 2022.
Apply the same peak-to-trough interval to the October 7, 2025, high, and the model points to a cycle low arriving around October 2026, roughly 4 months from now.
That is a projection drawn from a pattern, not a forecast, and it should be read as a rough signpost rather than a date to trade around.
What it does suggest is that the worst of the calendar-driven weakness may be a matter of months rather than years, a sharply different message from the panic in the headlines.
Why Bitcoin’s Historical Cycle Pattern Could Still Break
No cycle repeats perfectly, and Bitcoin’s historical pattern comes with important caveats. The strongest alignment in the data relies on just two fully documented halving cycles, while earlier cycles occurred before reliable daily price records were widely available. Four observations can reveal a trend, but they are far from enough to guarantee future outcomes.
There are also reasons to believe this cycle could unfold differently.
The approval of spot Bitcoin ETFs in 2024 introduced a new wave of institutional capital, bringing in larger, potentially more patient investors. Many analysts argue that this shift could reduce the sharp boom-and-bust dynamics that characterized earlier, retail-driven cycles.
Signs of that change are already visible. Bitcoin’s volatility has declined across successive cycles, and bear-market drawdowns have become less severe. The current decline of roughly 49% is significant, but far smaller than the 77% collapse seen during the 2022 bear market.
As Bitcoin matures, the influence of the four-year halving cycle may gradually weaken. For now, however, the 2026 downturn continues to track the historical pattern remarkably closely.
Methodology
This analysis uses daily Bitcoin closing prices in US dollars from the CoinGecko Pro API, covering January 1, 2020 through June 8, 2026, about 2,351 observations. Halving dates are deterministic and publicly recorded. Cycle peaks for the 2020 and 2024 halvings were identified as the maximum closing price in the 24 months following each halving, and the interval was measured in calendar months.
The peak to trough interval uses the November 2021 high and its lowest subsequent close. Pre 2020 halving and peak dates are included as external historical reference and should be independently verified before citation. Returns are simple percentage changes between closes, and the cycle overlay rebases each path to 100 on its halving day. Patterns drawn from a small number of cycles are descriptive, not predictive, and none of the above is investment advice.
Disclaimer:
The information provided in this article is for informational purposes only. It is not intended to be, nor should it be construed as, financial advice. We do not make any warranties regarding the completeness, reliability, or accuracy of this information. All investments involve risk, and past performance does not guarantee future results. We recommend consulting a financial advisor before making any investment decisions.
Dr. Guneet Kaur is a senior editor at CCN.com and a Science Fellow at Exponential Science. She is a fintech and blockchain expert with extensive experience in digital finance education, blockchain ecosystems, and cryptocurrency markets. She has worked with global media such as Cointelegraph, as well as education and blockchain platforms, to design and lead strategic content and learning initiatives. As an educator and assessor for top-tier executive programs, she bridges real-world fintech trends with academic insight.
Dr. Kaur is also a published researcher and peer reviewer across fintech and data science journals, including Financial Innovation Journal and International Journal of Big Data Intelligence and Applications. Her work spans data-driven analysis, Web3 innovation, and technical content development. With a strong foundation in both industry and academia, she translates complex financial technologies into practical applications, empowering learners, professionals, and institutions across the rapidly evolving digital finance landscape.