In January 2025, Nobel Prize economist Eugene Fama warned that Bitcoin could crash to ‘zero.’ Here’s why he believes its long-term survival is unlikely. | Credit: CCN.com
Share
Key Takeaways
Bitcoin’s drop below $100,000 wasn’t driven by retail panic, but by deeper structural forces across liquidity, institutional flows, and algorithmic trading.
Global liquidity tightening and risk-off sentiment reduced demand for high-volatility assets, leaving fewer buyers to absorb sell pressure.
ETF outflows and weak spot demand played a significant role, with a negative Coinbase Premium Index signaling U.S.-led selling.
A return to $100,000 will likely require ETF inflows, improved liquidity, stronger institutional demand, and supportive macro conditions.
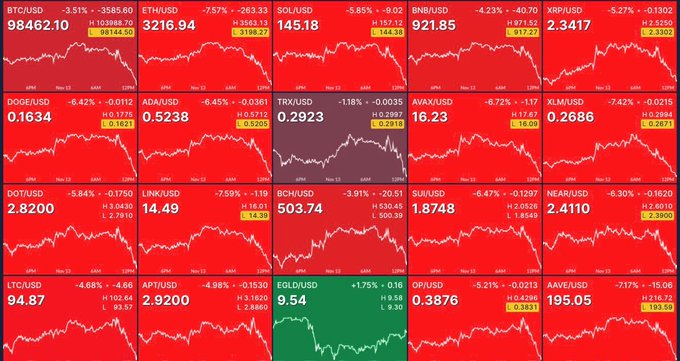
Bitcoin falling under the $100,000 mark signals more than just a price movement; it reflects deeper forces at work in macro-economics, market structure and investor behaviour.
Bitcoin Crash Timeline: How BTC Plunged Below $100K in a Matter of Weeks
It started like every classic bull story – unstoppable rallies, institutional hype, and retail euphoria pushing Bitcoin past $126,000. But what goes vertical often comes crashing back to earth. Within weeks, momentum evaporated, whales blinked, and rumors began to ripple through the market. From record highs to a panic-driven plunge below $100K, every twist told a story of shifting sentiment, leverage, and fear.
Date
What happened
Oct 6, 2025
Bitcoin roars to a new all-time high above $126,000, fueling euphoria across markets.
Late Oct 2025
Institutional inflows slow as tech stocks stumble — the first cracks in the rally appear.
Nov 4, 2025
Bitcoin plunges below $100K for the first time since June, triggering mass liquidations.
Early Nov 2025
Price slides toward $95K, testing key support amid extreme fear and leveraged unwinds.
Mid-Nov 2025
Charts flash red: moving averages snap, sentiment tanks, and whales move to sidelines.
Now, let’s understand the key reasons why Bitcoin fell under $100K.
1. Liquidity Drain and Risk-Off Market Sentiment
The first and most obvious driver of Bitcoin’s decline is the shift in global market sentiment toward risk aversion. Over the past several weeks, investors have been pulling capital out of high-risk assets such as cryptocurrencies, tech stocks, and growth equities.
When global liquidity tightens, due to central banks maintaining higher interest rates or reducing balance sheets, traders tend to move capital into safer instruments like bonds, the U.S. dollar, or gold.
Bitcoin, despite being promoted as “digital gold,” still behaves like a risk asset during these macroeconomic tightening cycles. The liquidity squeeze has simply left fewer buyers on the market, amplifying every downward move.
2. Weak Spot Demand and ETF Outflows
Another major factor behind Bitcoin’s slide is reduced demand from both retail and institutional investors. Spot Bitcoin trading volumes have declined notably, and some exchange-traded funds (ETFs) that previously drove consistent inflows have begun seeing outflows.
This combination of falling demand and increased short-term selling created a perfect storm. Even though long-term holders (“HODLers”) continue to accumulate, the immediate market impact of fewer active buyers means less support when large sell orders hit the market. Without enough demand at critical levels, Bitcoin’s price naturally gravitates lower.
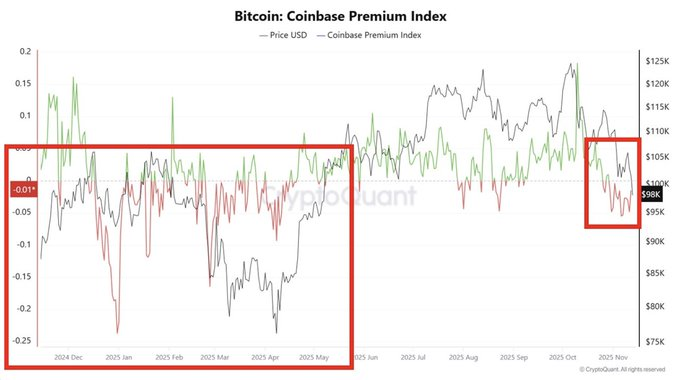
The below chart compares Bitcoin’s price with the Coinbase Premium Index, the price gap between BTC on U.S. exchange Coinbase and global venues. When the premium is negative (red), U.S. demand is weaker than overseas and U.S. participants are likely selling or hedging, creating extra downward pressure.
Bitcoin’s decline driven by U.S. liquidity stress. | Credit: CryptoQuant X profile
The large red stretch in late-2024 to spring-2025 shows a prolonged U.S.-led risk-off phase that capped upside. After a neutral/positive lull in mid-2025, the premium turned negative again in Oct–Nov 2025, just as BTC slid below $100K, implying renewed U.S. institutional/ETF outflows and thin bid liquidity.
In short, the repeated negative premium signals that the latest drop was U.S.-driven, not retail panic globally; a durable rebound likely needs this premium to move back to neutral/positive, indicating restored U.S. buy pressure.
3. Institutional Flow Reversals and Whale Movements
Here’s where the market dynamics shift dramatically. In recent weeks, several large institutional players, including hedge funds and proprietary trading desks, have rebalanced or reduced exposure to Bitcoin. These institutional flow reversals carry far more weight than retail selling.
When whales or funds unload significant amounts of BTC, automated trading systems across exchanges react instantly. Since the market’s liquidity depth at key price levels has thinned, these large transactions create outsized effects. This institutional repositioning was one of the silent forces that pushed Bitcoin below the six-figure threshold.
4. The Shocking Factor: Broken Support Levels and Algorithmic Cascades
This is the part that caught many investors off guard. The speed and severity of Bitcoin’s drop under $100,000 weren’t driven purely by fundamentals, they were fueled by technical breakdowns and automated trading cascades.
The $100K mark wasn’t just another round number; it was a critical psychological and technical support zone closely watched by traders, institutions, and algorithms alike. When Bitcoin slipped below that threshold, it triggered a chain reaction across exchanges.
2. The setup repeats every time
Bitcoin moves first, alts lag behind.
Then liquidity rotates, and the smaller caps explode.
According to market data, more than $650 million in leveraged positions were liquidated within hours of the breakdown, with over $500 million in long positions wiped out as automated stop-losses and margin calls kicked in. Once these liquidations started, algorithmic trading systems flipped from buy to sell, accelerating the decline even further.
This kind of automated sell-off is typical in modern crypto markets, where quantitative bots and leverage dominate intraday volume. The break below $100K caused thin liquidity and cascading liquidations, turning what could have been a normal correction into a rapid, system-wide downturn.
In short, the crash proved that Bitcoin’s price mechanics are now deeply intertwined with algorithmic trading behavior. When a major support level breaks, technical triggers and liquidations can move the market faster than any macro headline, a stark reminder that in today’s crypto market, code and leverage can drive chaos just as much as sentiment.
5. Macro Headwinds: Interest Rates, Inflation, and Investor Caution
Lastly, Bitcoin’s decline reflects ongoing macroeconomic uncertainty. Central banks around the world, particularly the U.S. Federal Reserve, have signaled caution on rate cuts, keeping interest rates higher for longer. This limits the flow of cheap money into risk assets and raises the opportunity cost of holding non-yielding assets like Bitcoin.
This is not a bitcoin specific sell off. It’s a macro sell off. When the broader market rebounds, so will bitcoin pic.twitter.com/okKOzg7mnP
Persistent inflation and slowing economic growth further compound this effect. Investors prefer defensive positions when uncertainty rises, leading to reduced appetite for volatile assets. These macro headwinds have been weighing on Bitcoin’s momentum for weeks, the recent price action simply made that reality visible.
Saylor, Schiff and the Sell-Off That Wasn’t — But Still Crashed Bitcoin
Just as Bitcoin’s price teetered below the six-figure mark, social media lit up with rumors that Michael Saylor’s firm, Strategy, had quietly sold a chunk of its massive Bitcoin holdings. Screenshots of supposed on-chain movements went viral, sparking fears that one of Bitcoin’s loudest corporate backers had finally lost conviction.
Within hours, Saylor stepped in to refute the claims, calling them pure fiction and reaffirming that the company remains in full accumulation mode and is still buying BTC.
But by then, the damage was done. Markets don’t wait for fact-checks; they react to whispers. Traders interpreted the alleged “sell-off” as a signal that institutional players might be trimming exposure, and sentiment turned sharply risk-off.
The narrative snowballed further when long-time gold advocate Peter Schiff seized the moment, calling Saylor’s Bitcoin-treasury model a “fraud” and publicly challenging him to a debate at Binance Blockchain Week in December 2025. The clash of ideologies, digital gold versus physical, reignited old doubts about the sustainability of corporate Bitcoin leverage.
MSTR’s entire business model is a fraud. Saylor and I will both be speaking at Binance Blockchain Week in Dubai in early December. I challenge @saylor to debate this proposition with me. Regardless of what happens to Bitcoin, I believe $MSTR will eventually go bankrupt. Let’s go!
Even though both the rumor and the rhetoric may prove baseless, their timing amplified the fear. In a market already stretched on leverage and expectation, perception alone can move billions, and this time, it helped tip Bitcoin below the symbolic $100K line.
Do Bitcoin Sell-Offs Help the Network Evolve and Strengthen?
At first glance, every major Bitcoin crash looks like a setback. Prices tumble, headlines turn negative, and traders panic. Yet, historically, Bitcoin’s network has always emerged stronger after every downturn, both technically and structurally.
Here’s why:
1. Miner Consolidation Improves Efficiency
When Bitcoin’s price drops sharply, inefficient miners, those running on high electricity costs or outdated hardware, are forced to shut down operations. This temporary decline in hash rate is followed by a difficulty adjustment, which rebalances the mining ecosystem.
The result: a leaner, more energy-efficient network that’s operated by miners with stronger fundamentals and access to cheaper power. This natural selection strengthens Bitcoin’s long-term security and sustainability.
2. On-Chain Activity Becomes Healthier
Price crashes often flush out speculative or over-leveraged traders, leaving behind users focused on genuine transactions and long-term holding. Historically, after major dips, the ratio of real users to short-term speculators improves.
Network congestion typically drops, fees stabilize, and transaction quality increases, making the blockchain healthier and more functional.
3. Developer Focus Shifts Toward Utility
During bull markets, hype-driven projects dominate attention. In contrast, downturns shift focus back to core innovation, scaling solutions like the Lightning Network, security upgrades, and better privacy tools.
Many of Bitcoin’s most important technical advancements, including SegWit adoption and improvements in wallet infrastructure, gained momentum during bear phases rather than during bull runs.
4. Long-Term Holders Strengthen Market Resilience
Market crashes filter out weak hands and attract long-term believers. As the proportion of “strong hands” increases, price volatility tends to moderate over time. On-chain data consistently shows that long-term holders accumulate heavily during crashes, laying the foundation for the next recovery cycle.
In short, every major Bitcoin crash resets the system, removing inefficiencies, refocusing development, and building a more resilient network for the future.
Try Our Recommended Crypto Exchanges
Sponsored
Disclosure
We sometimes use affiliate links in our content, when clicking on those we might receive a commission at no extra cost to you. By using this website you agree to our terms and conditions and privacy policy.
Bitcoin’s path back to $100,000 depends on a mix of technical, institutional, and macroeconomic factors. After falling below this psychological level, the market is consolidating as liquidity tightens and investor risk appetite remains low. Analysts note that Bitcoin would need sustained ETF inflows, stronger on-chain activity, and renewed institutional demand to regain momentum.
Technically, a clear breakout above the $109,000-$112,000 resistance range could confirm recovery. Macroeconomic shifts, such as lower interest rates or improved global liquidity, would also boost sentiment.
Until these conditions align, Bitcoin may continue fluctuating around the $95K–$100K zone, with gradual accumulation by long-term holders paving the way for its eventual return above the six-figure mark.
Bitcoin dropped below $100K due to a combination of tightening global liquidity, institutional sell-offs, reduced ETF inflows, and the breaking of key technical support levels. It wasn’t just retail panic — deeper structural and macroeconomic forces were at play.
How do interest rates affect Bitcoin’s price?
Higher interest rates reduce liquidity and make risk assets like Bitcoin less attractive compared to safer, yield-generating investments such as bonds or the U.S. dollar. This leads to lower demand and short-term price declines.
Do Bitcoin crashes harm the network?
No. Historically, Bitcoin crashes have strengthened the network. Inefficient miners exit, on-chain activity becomes healthier, and developer focus shifts back to innovation and utility — improving overall efficiency and resilience.
What role do institutions play in Bitcoin’s price movements?
Institutional flows, including hedge fund rebalancing and ETF activity, have a major impact. When large funds reduce exposure, it triggers liquidity gaps and automated sell-offs that can amplify price declines.
Disclaimer:
The information provided in this article is for informational purposes only. It is not intended to be, nor should it be construed as, financial advice. We do not make any warranties regarding the completeness, reliability, or accuracy of this information. All investments involve risk, and past performance does not guarantee future results. We recommend consulting a financial advisor before making any investment decisions.
Dr. Guneet Kaur is a senior editor at CCN.com and a Science Fellow at Exponential Science. She is a fintech and blockchain expert with extensive experience in digital finance education, blockchain ecosystems, and cryptocurrency markets. She has worked with global media such as Cointelegraph, as well as education and blockchain platforms, to design and lead strategic content and learning initiatives. As an educator and assessor for top-tier executive programs, she bridges real-world fintech trends with academic insight.
Dr. Kaur is also a published researcher and peer reviewer across fintech and data science journals, including Financial Innovation Journal and International Journal of Big Data Intelligence and Applications. Her work spans data-driven analysis, Web3 innovation, and technical content development. With a strong foundation in both industry and academia, she translates complex financial technologies into practical applications, empowering learners, professionals, and institutions across the rapidly evolving digital finance landscape.
Giuseppe Ciccomascolo began his career as an investigative journalist in Italy, where he contributed to both local and national newspapers, focusing on various financial sectors.
Upon relocating to London, he worked as an analyst for Fitch's CapitalStructure and later as a Senior Reporter for Alliance News. In 2017, Giuseppe transitioned to covering cryptocurrency-related news, producing documentaries and articles on Bitcoin and other emerging digital currencies. He also played a pivotal role in establishing the academy for a cryptocurrency exchange website. Crypto remained his primary area of interest throughout his tenure as a writer for ThirdFloor.


 Easy
Easy