Bitcoin outlook turns bullish as it reclaims $110,000 | Credit: Derek Fenech
Share
Key Takeaways
Bitcoin bounced above $110,000, breaking out of a falling wedge and signaling bullish momentum.
A breakout above $116,000 could push BTC toward higher liquidity targets near $120,000.
Rising sentiment contrasts with weakening money flow, hinting at short-term volatility ahead.
Bitcoin (BTC) price narrowly dodged a breakdown below the psychological $100,000 mark last week.
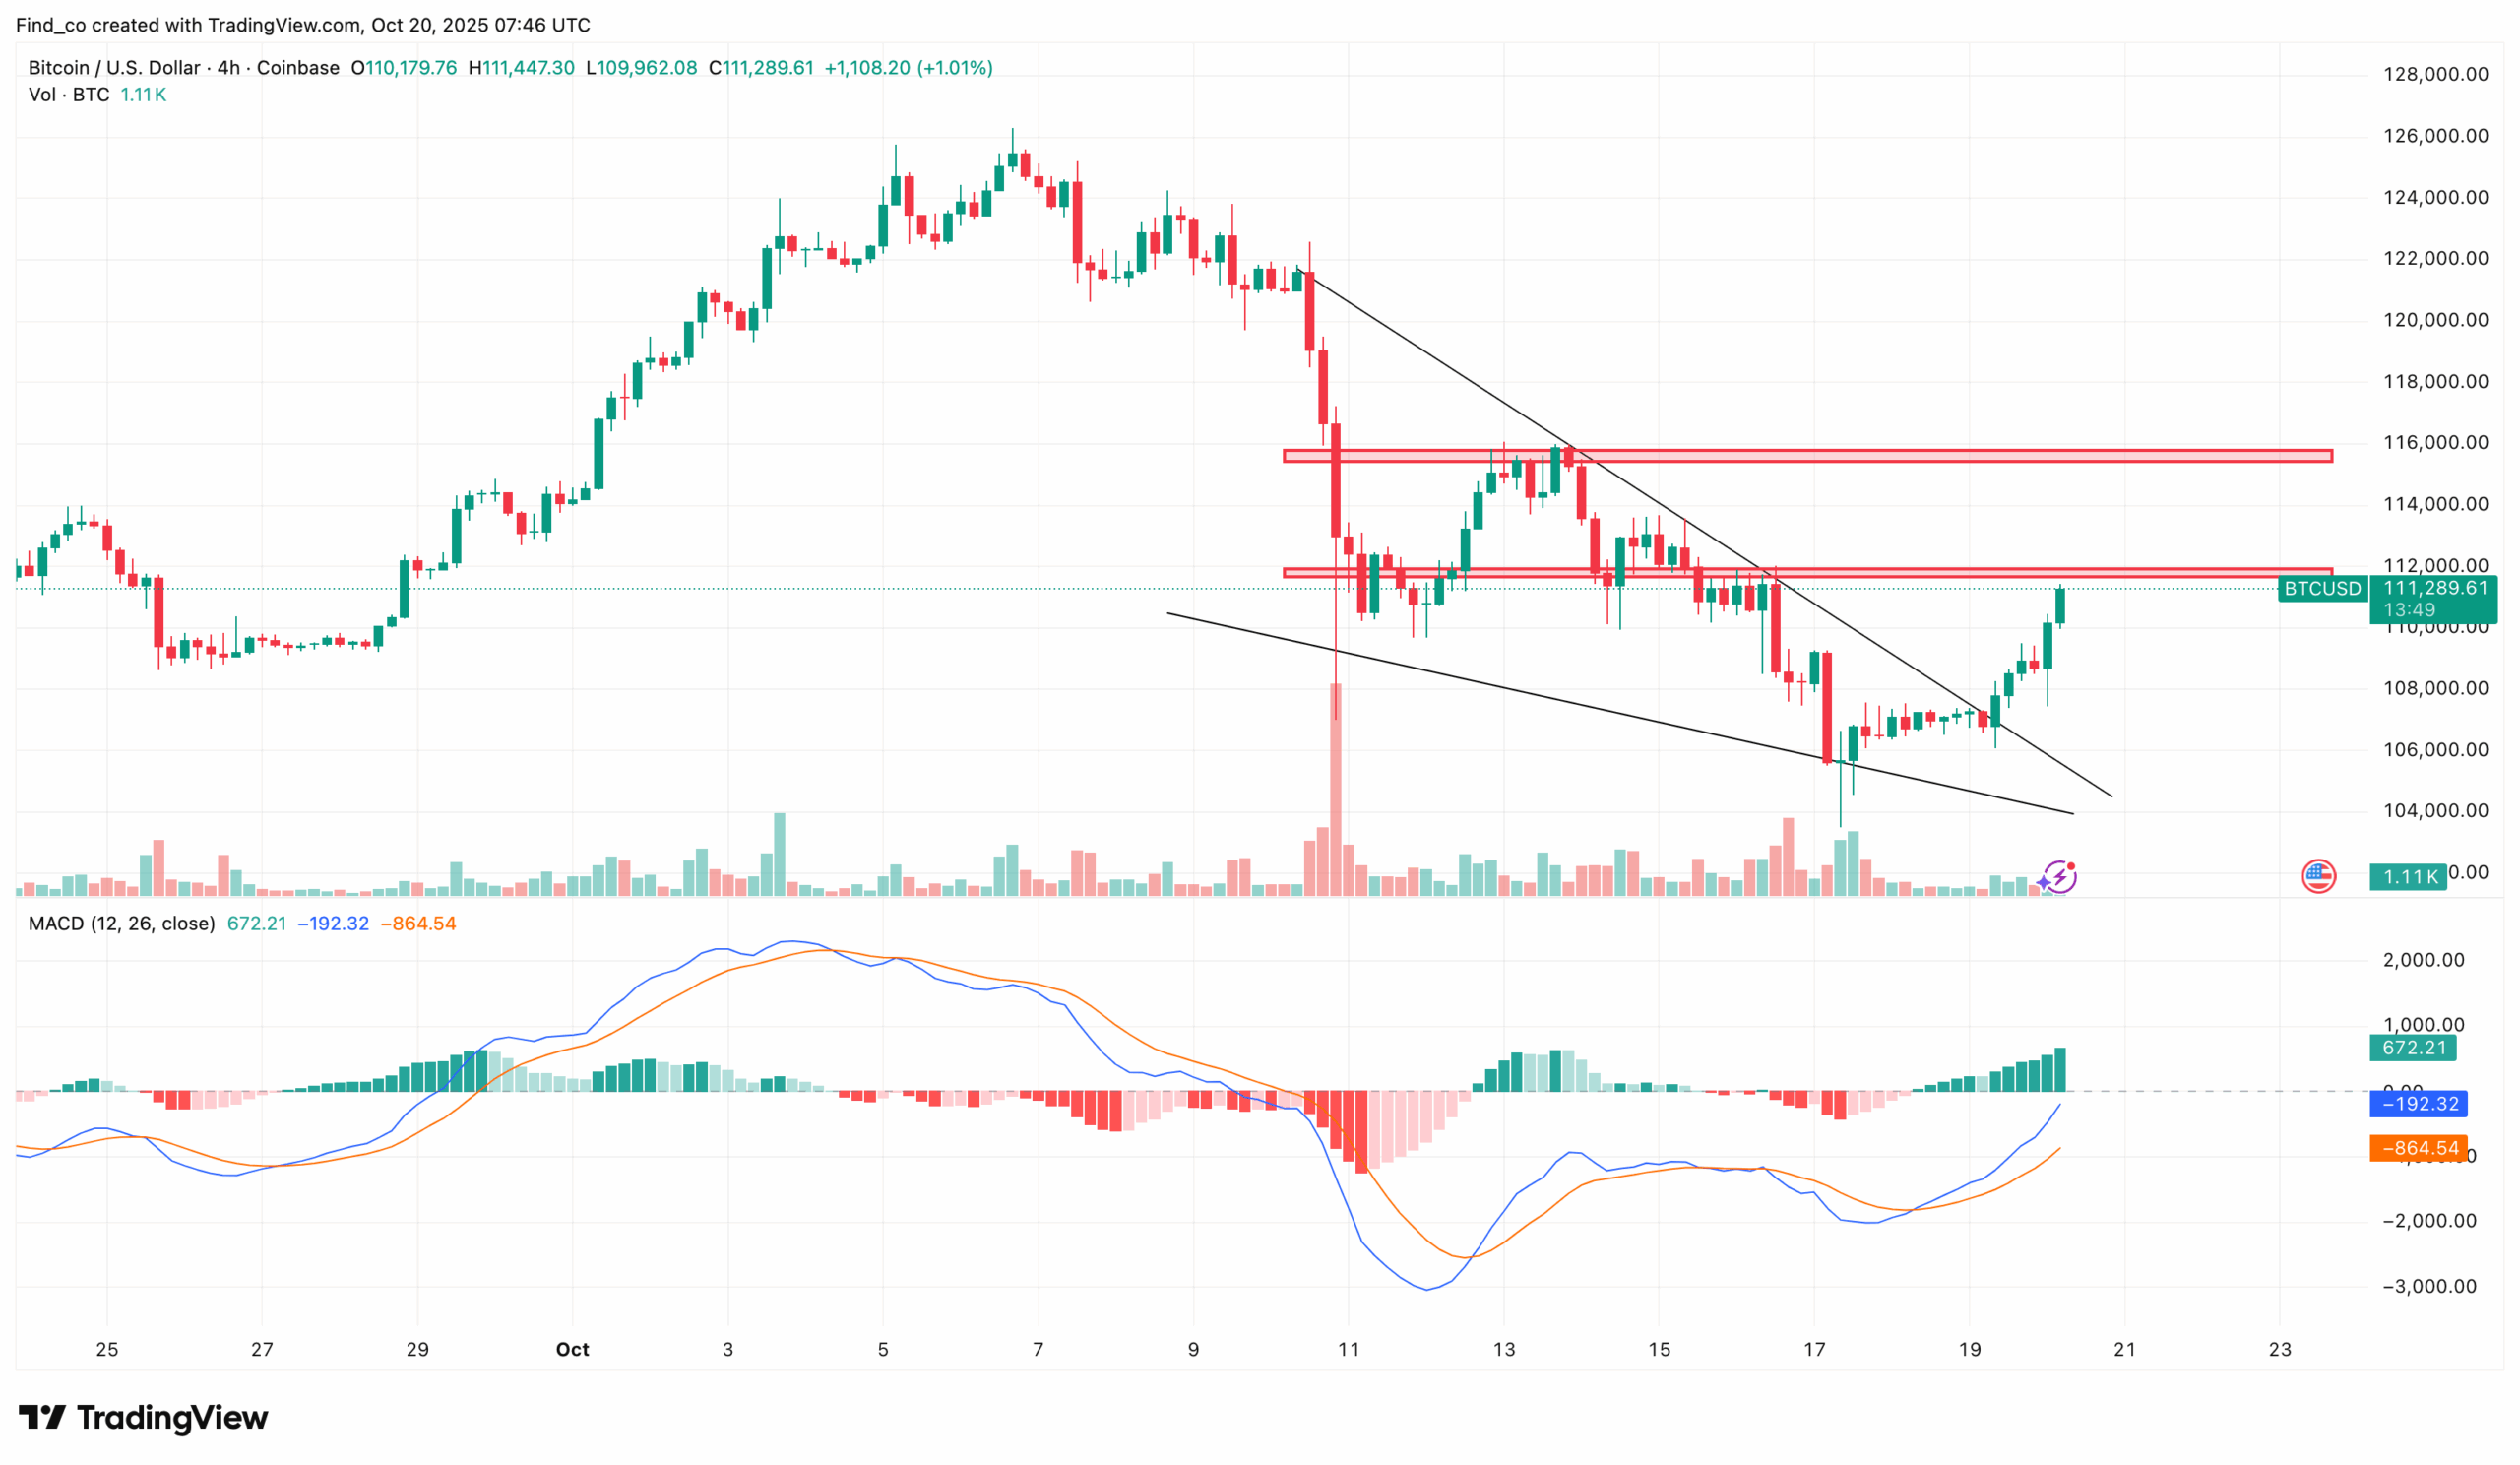
This week, the trend has turned around with BTC breaking above $110,000 for the first time since last Thursday.
As it stands, short-term charts now highlight two critical thresholds. This move shows how a move beyond any of them could set the tone for the rest of the month.
Today, the cryptocurrency has broken above the upper trendline of a falling wedge while printing several green candlesticks.
Following the move, the Moving Average Convergence Divergence (MACD) has formed a bullish crossover. If sustained, BTC will likely breach the resistance at $112,029.
Get These Top Crypto Casino Offers Now!
Sponsored
Disclosure
We sometimes use affiliate links in our content, when clicking on those we might receive a commission at no extra cost to you. By using this website you agree to our terms and conditions and privacy policy.
However, that is not the only area of interest that is key to Bitcoin’s short-term trend.
A closer look at the chart shows that the $115,480 is another point of interest that the coin needs to breach before inching closer to its all-time high.
If successful, Bitcoin’s price might close in on $120,000, and this will only be the case if buying pressure increases.
However, failure to invalidate it risks the cryptocurrency experiencing a pullback.
Furthermore, CCN also analyzed Bitcoin’s liquidity heatmap. In essence, the heatmap highlights price zones where large-scale liquidations are likely to occur.
When potential liquidation levels cluster within a narrow range, it signals that the price could be drawn toward that area.
Over the past three months, BTC shows a dense concentration of liquidation points (yellow) around $117,694, $118,754, and $119,814.
This clustering suggests strong liquidity interest in this zone.
Consequently, if momentum builds toward these areas, Bitcoin’s price may gravitate toward these levels.
Interestingly, some analysts share this bullish outlook. Lennaert Snyde, for example, believes Bitcoin could rally toward $120,000 if it successfully breaks the key resistance at $115,800.
“Bitcoin is pushing against key $111,440 resistance. Why is it key? Because that’s the drop-off point that resulted in the loss of $108,600 in support. Gaining $111,440 triggers longs to $115,800 resistance. Gain $115,800 and Bitcoin is back at the $120,800 “flash crash” dropoff,” Snyde shared on X.
Such a breakout would likely trigger liquidations above that threshold, accelerating BTC toward the highlighted liquidity zones.
Meanwhile, PhilOnChain noted that $116,000 will serve as a crucial pivot point for Bitcoin’s next major move.
A reaction around this level could determine whether the price extends its rally or faces short-term rejection.
“There are two levels we should be watching: Break above $116,000 would put the price above the daily 50 EMA + previous lower high. It would flip structure bullish,” The analyst opined.
BTC Price Prediction: $115,000 or $106,000
On the daily chart, indicators are showing mixed signals.
To begin with, the Money Flow Index (MFI) has declined, suggesting reduced buying pressure and potential weakening of capital inflows.
However, the Holder Sentiment Index has moved above the zero line, indicating a growing sense of optimism.
This divergence between MFI and sentiment suggests market indecision, where weakening liquidity contrasts with improving confidence, potentially leading to short-term volatility before the next clear price direction emerges.
Looking closely, the $115,172 level on this timeframe could be key to Bitcoin’s next move. If bulls push above this resistance, Bitcoin’s price might climb toward $126,234.
Disclaimer:
The information provided in this article is for informational purposes only. It is not intended to be, nor should it be construed as, financial advice. We do not make any warranties regarding the completeness, reliability, or accuracy of this information. All investments involve risk, and past performance does not guarantee future results. We recommend consulting a financial advisor before making any investment decisions.
Victor Olanrewaju is a crypto analyst and reporter at CCN with deep roots in on-chain research and technical analysis. His crypto journey began in 2017, but it was the 2020 Uniswap airdrop that sparked a full-time pivot into the space.
With a foundation in copywriting, Victor honed his craft creating high-converting content for leading crypto brokers — most notably an XRP price prediction that ranked #1 on Google during the 2021 bull run.
He later joined AMBCrypto in 2022, where he combined storytelling with technical and on-chain analysis to cover key market narratives.
In 2024, he expanded his expertise at BeInCrypto, collaborating with analysts and using tools like Glassnode, Santiment, and IntoTheBlock to break down Bitcoin and altcoin trends.
At CCN, Victor covers the top cryptocurrencies, memecoins, macro shifts, blending real-time insights with deep-dive metrics.
He holds a Bachelor’s degree in Physics from the University of Ibadan, equipping him to simplify complex data for a wide audience. Follow his work or connect on LinkedIn or X.