Although it was a rare crypto success story in 2022, Trust Wallet fared less well in the first half 2023.
The platform’s links to Binance saw the TWT token reach a low following the news that the United States Securities and Exchange Commission (SEC) was to sue the world’s biggest crypto exchange in June.
The token rallied after a new kind of Binance listing following a rebrand. 2024 saw the token rise, albeit by less than the overall market, leaving it at about $1.35 on Dec. 17, 2024. What’s next for TWT?
Let’s examine our Trust Wallet price predictions made on Dec. 17, 2024. We will also examine the Trust Wallet price history and discuss what Trust Wallet is and what it does.
Let’s look at the TWT price predictions made by CCN on Dec. 17. We will add and remove 20% from the final targets to create the minimum and maximum TWT price predictions.
Minimum TWT Price Prediction
Average TWT Price Prediction
Maximum TWT Price Prediction
2025
$1.48
$1.84
$2.20
2026
$2.03
$2.54
$3.05
2030
$6.20
$7.80
$9.40
Since the TWT price shows no discernible pattern since its launch, we will use the rate of increase since launch to create the TWT price prediction for 2025, 2026, and 2030.
The TWT price has increased by 405% in the 1,421 days since its launch, for a daily rate of 0.29%.
Projecting this rate of increase forward leads to TWT price predictions of $1.84, $2.54, and $7.80 for the end of 2025, 2026, and 2030, respectively.
Trust Wallet Price Prediction for 2025
Using the daily rate of increase since launch gives a TWT price prediction range between $1.48 and $2.20 for the end of 2025.
Trust Wallet Price Prediction for 2026
Using the daily rate of increase since launch, the TWT price prediction range for the end of 2026 is between $2.03 and $3.05.
Trust Wallet Price Prediction for 2030
Using the daily rate of increase since launch, the TWT price prediction range for the end of 2030 is between $6.20 and $9.40.
Trust Wallet Price Analysis
The weekly time frame TWT chart shows that the price has traded under the $1.60 horizontal resistance area since 2021. The only exception is a brief breakout (black circle) in December 2022, which led to the all-time high price of $2.74. However, the breakout could not be sustained.
The TWT price has made three unsuccessful breakout attempts (black icons) since November 2023, creating long upper wicks. These also validated a descending resistance trend line that has existed for over two years.
Therefore, there is a confluence of resistances between $1.40 and $1.60, suppressing upward movement.
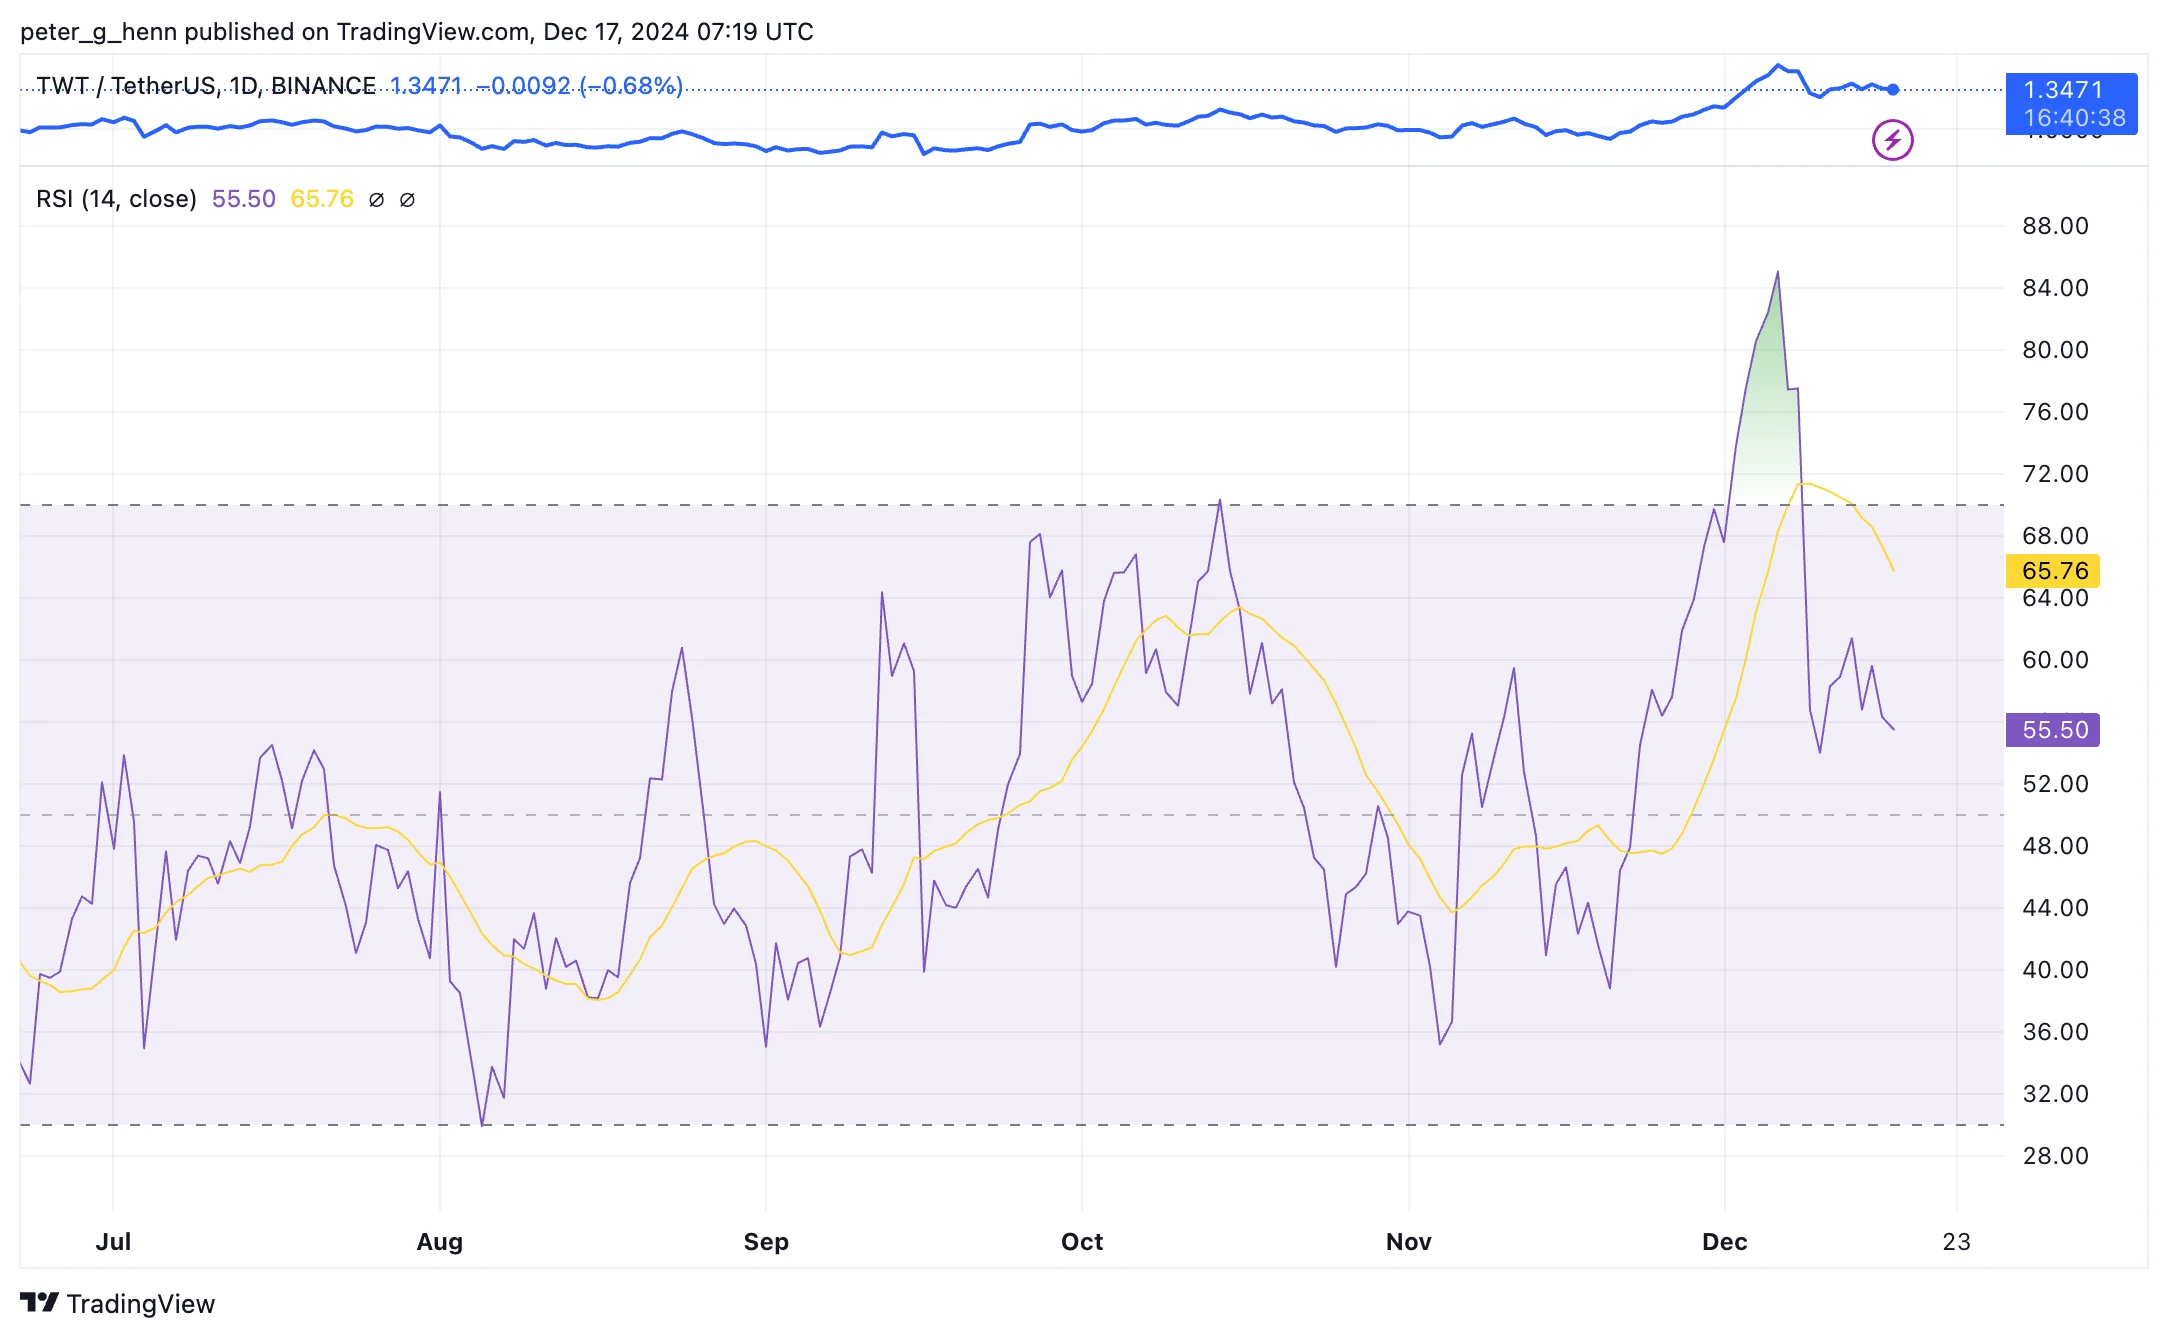
Despite this resistance, technical indicators are bullish. The Relative Strength Index (RSI) and Moving Average Convergence/Divergence (MACD) are increasing and have recently crossed their bullish thresholds at 50 and 0, respectively.
The weekly time frame chart suggests the TWT price will break out from its confluence of resistances. If it does, the next resistance will be at $2.60.
Short-Term Trust Wallet Price Prediction
The TWT price prediction for the next 24 hours is bullish. The price will likely break out from its confluence of resistances and move to a high of $2.60.
Trust Wallet Average True Range (ATR): TWT Volatility
The Average True Range (ATR) measures market volatility by averaging the largest of three values: the current high minus the current low, the absolute value of the current high minus the previous close, and the absolute value of the current low minus the previous close over a period, typically 14 days.
A rising ATR indicates increasing volatility, while a falling ATR indicates decreasing volatility. Since ATR values can be higher for higher-priced assets, normalize ATR by dividing it by the asset price to compare volatility across different price levels.
On Dec. 17 2024, Trust Wallet’s ATR was 0.1097, suggesting average volatility.
Trust Wallet Relative Strength Index (RSI): Is TWT Overbought or Oversold?
The Relative Strength Index (RSI) is a momentum indicator traders use to determine whether an asset is overbought or oversold. Movements above 70 and below 30 show over and undervaluation, respectively. Movements above and below the 50 line also indicate if the trend is bullish or bearish.
On Dec. 17, 2024, the Trust Wallet RSI was at 55, indicating somewhat bullish conditions.
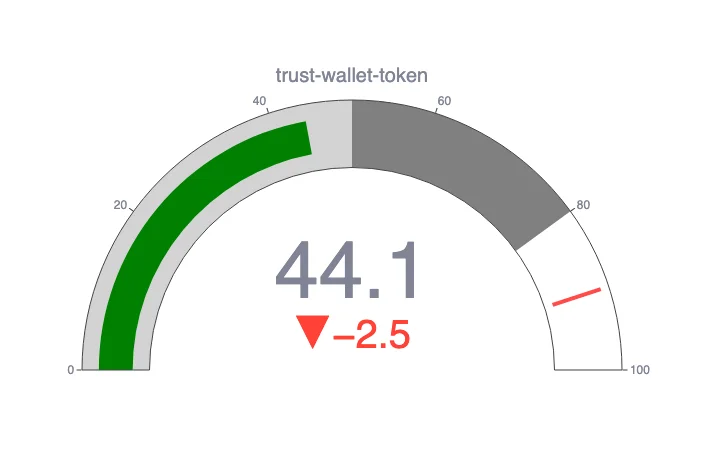
CCN Strength Index
The CCN Strength Index combines an array of advanced market signals to measure the strength of individual cryptocurrencies over the last 30 days.
Every day, it assigns a strength score, ranging from 0 to 100, to the top 500 assets by market capitalization on CoinMarketCap, focusing on both trend direction and the intensity of price movements.
0 to 24: Assets exhibit significant weakness, showing signs of sustained downtrend behavior.
25 to 35: The price tends to move within stable bounds with minimal volatility.
36 to 49: Assets begin a stable uptrend but without strong surges.
50 to 59: Consistent growth with moderate price advances, building momentum.
60+: Sharp price movements and high demand indicate stronger volatility and trend shifts.
The index dynamically adapts to rapid changes. For example, an asset experiencing a 100% increase within a short timeframe would see a sharp jump in its score to reflect the intensity of the rise.
However, should that asset stabilize at this new price level, the score will gradually taper down and align with the dampened momentum as the movement normalizes. The same principle applies to rapid declines: a sudden drop will spike the score downward, but the score will slowly adjust back up as volatility decreases.
On Dec. 17, 2024, Trust Wallet scored 44.1 on the CCN Index, suggesting average momentum.
TWT CCN Index | Credit: CCN
Trust Wallet Price Performance Comparisons
Trust Wallet is, as its name suggests, a wallet token. It is also an account abstraction crypto. Let’s compare it with other cryptocurrencies in the same category.
We took a look at the Trust Wallet price history and found the best times to buy TWT.
Day of the Week
Saturday
Week
33
Month
August
Quarter
Third
TWT Price History
Let’s now look at some of the key dates in the Trust Wallet price history. While past performance should never be taken as an indicator of future results, knowing what the coin has done can help give us some very useful context when it comes to either making or interpreting a Trust Wallet price prediction.
Trust Wallet price history for the last 12 months | Credit: CoinMarketCap
Time period
TWT price
Last week (Dec. 10, 2024)
$1.35
Last month (Nov. 17, 2024)
$0.9978
Three months ago (Sept. 17, 2024)
$0.8421
One year ago (Dec. 17, 2023)
$1.17
Launch price (July 31, 2020)
$0.006631
All-time high (Dec 11, 2022)
$2.72
All-time low (July 31, 2020)
$0.006478
Trust Wallet Market Cap
The market capitalization, or market cap, is the sum of the total number of TWT in circulation multiplied by its price.
Trust Wallet market cap for the last 12 months | Credit: CoinMarketCap
On Dec. 17, 2024, Trust Wallet’s market cap was $561 million, making it the 152nd-largest crypto by that metric.
Who Owns the Most Trust Wallet
On Dec. 17, 2024, one wallet held 30% of the TWT supply.
0x8808390062ebca540ff10ee43db60125bb061621. This wallet held 300,000,008 TWT, or 30% of the supply.
0xa0a3cfdbc585e13a8b65d2993e9964fd9e86d39a. This wallet held 150,000,003 TWT, or 15% of the supply.
0x9a649092067d165e69d86cbcd6d3b7b7077d1771. This wallet held 120,000,002 TWT, or 12% of the supply.
0x5029f49585d57ed770d2194841b5a0be06bfc2ed. This wallet held 87,759,084 TWT, or 8.78% of the supply.
0x5a52e96bacdabb82fd05763e25335261b270efcb. This wallet held 54,700,417 TWT, or 5,47% of the supply.
Trust Wallet Supply and Distribution
Supply and distribution
Figures
Total supply
999,668,148
Circulating supply (as of Dec. 17, 2024)
416,649,900 (41.67% of total supply)
Holder distribution
Top 10 holders owned 83.93% of supply as of Dec. 17, 2024
Trust Wallet (TWT) Explained
Crypto wallets are a crucial part of blockchain-based finance. As more new coins and tokens come onto the market, the idea that there is a place where someone can store and keep track of their crypto holdings is essential for traders.
Trust Wallet is one of many crypto wallets on the market. It is based on the Binance (BNB) blockchain.
Binance bought the platform in 2018. In March 2022, Radchenko stepped down as CEO for family reasons and was replaced by former Binance marketing chief Eowyn Chen.
Trust Wallet is supported by its eponymous crypto token, which goes by the ticker handle TWT.
How Trust Wallet Works
Trust Wallet is a mobile phone app that allows people to hold cryptos based on various blockchains, including Ethereum (ETH), Binance, and Tron (TRX).
Users have their private keys to Trust Wallet. On one hand, this means that the platform is more secure, but it does come with the disadvantage that, if someone forgets their password, they lose access to their crypto.
People with Trust Wallet can also stake a range of coins and tokens. The system offers them interest rates of up to 11%.
Holders of TWT can get discounts when trading on exchanges linked to Trust Wallet. People with TWT can vote on proposals regarding the platform, and TWT can also be bought, sold, and traded on exchanges.
Is Trust Wallet a Good Investment?
It is difficult to tell. TWT struggled in 2023. Although it has done much better in 2024, it is not out of the woods yet. It will need to spend a significant period above the dollar.
The platform’s links to Binance, at a time when the world’s largest crypto exchange is facing legal action, will not have helped its token’s price.
Furthermore, there is no Trust Wallet whitepaper. That means that investors do not have an official place to find out exactly what Trust Wallet is or what it does.
On the other hand, we have to remember that TWT was a top performer in 2022, doubling in price when the overall market more than halved.
As ever with crypto, you must do your research before deciding whether or not to invest in TWT.
Will Trust Wallet go up or down?
No one can tell right now. While the Trust Wallet crypto price predictions are largely positive, price predictions have a well-earned reputation for being wrong. Keep in mind that prices can and do go down and up.
Should I invest in Trust Wallet?
Before you decide whether or not to invest in Trust Wallet, you will have to do your research, not only on TWT, but on other related coins and tokens such as Internet Computer (ICP) and 1inch (1INCH). Either way, you will also need to ensure you never invest more money than you can afford to lose.
Technical analysis by Valdrin Tahiri.
FAQs
How Many Trust Wallet Tokens are there?
On Dec. 17, 2024, 416.6 million TWT were in circulation, out of a total supply of just under one billion.
Will Trust Wallet Reach $10?
Our Trust Wallet price predictions, based on technical analysis, suggest TWT won’t reach $10 until at least the 2030s, if it ever does.
Keep in mind that TWT has never traded at more than $10. Its highest ever price, $2.71, came in December 2022.
What is the Trust Wallet token used for?
The TWT token is used to give users discounts on exchanges and votes on the future of the Trust Wallet platform. People can also buy, sell, and trade it on exchanges.
Disclaimer:
The information provided in this article is for informational purposes only. It is not intended to be, nor should it be construed as, financial advice. We do not make any warranties regarding the completeness, reliability, or accuracy of this information. All investments involve risk, and past performance does not guarantee future results. We recommend consulting a financial advisor before making any investment decisions.
Peter Henn has been a journalist since 2005. In that time, he has written for a variety of publishers including the Mail on Sunday and the Daily Express. He has previously covered the world of cryptocurrency for Currency.com and Capital.com, and has also written for ECigIntelligence.com and CBD-Intel.com. A graduate of the University of Liverpool, he is based in the United Kingdom. His hobbies include music, horse racing and performance art.