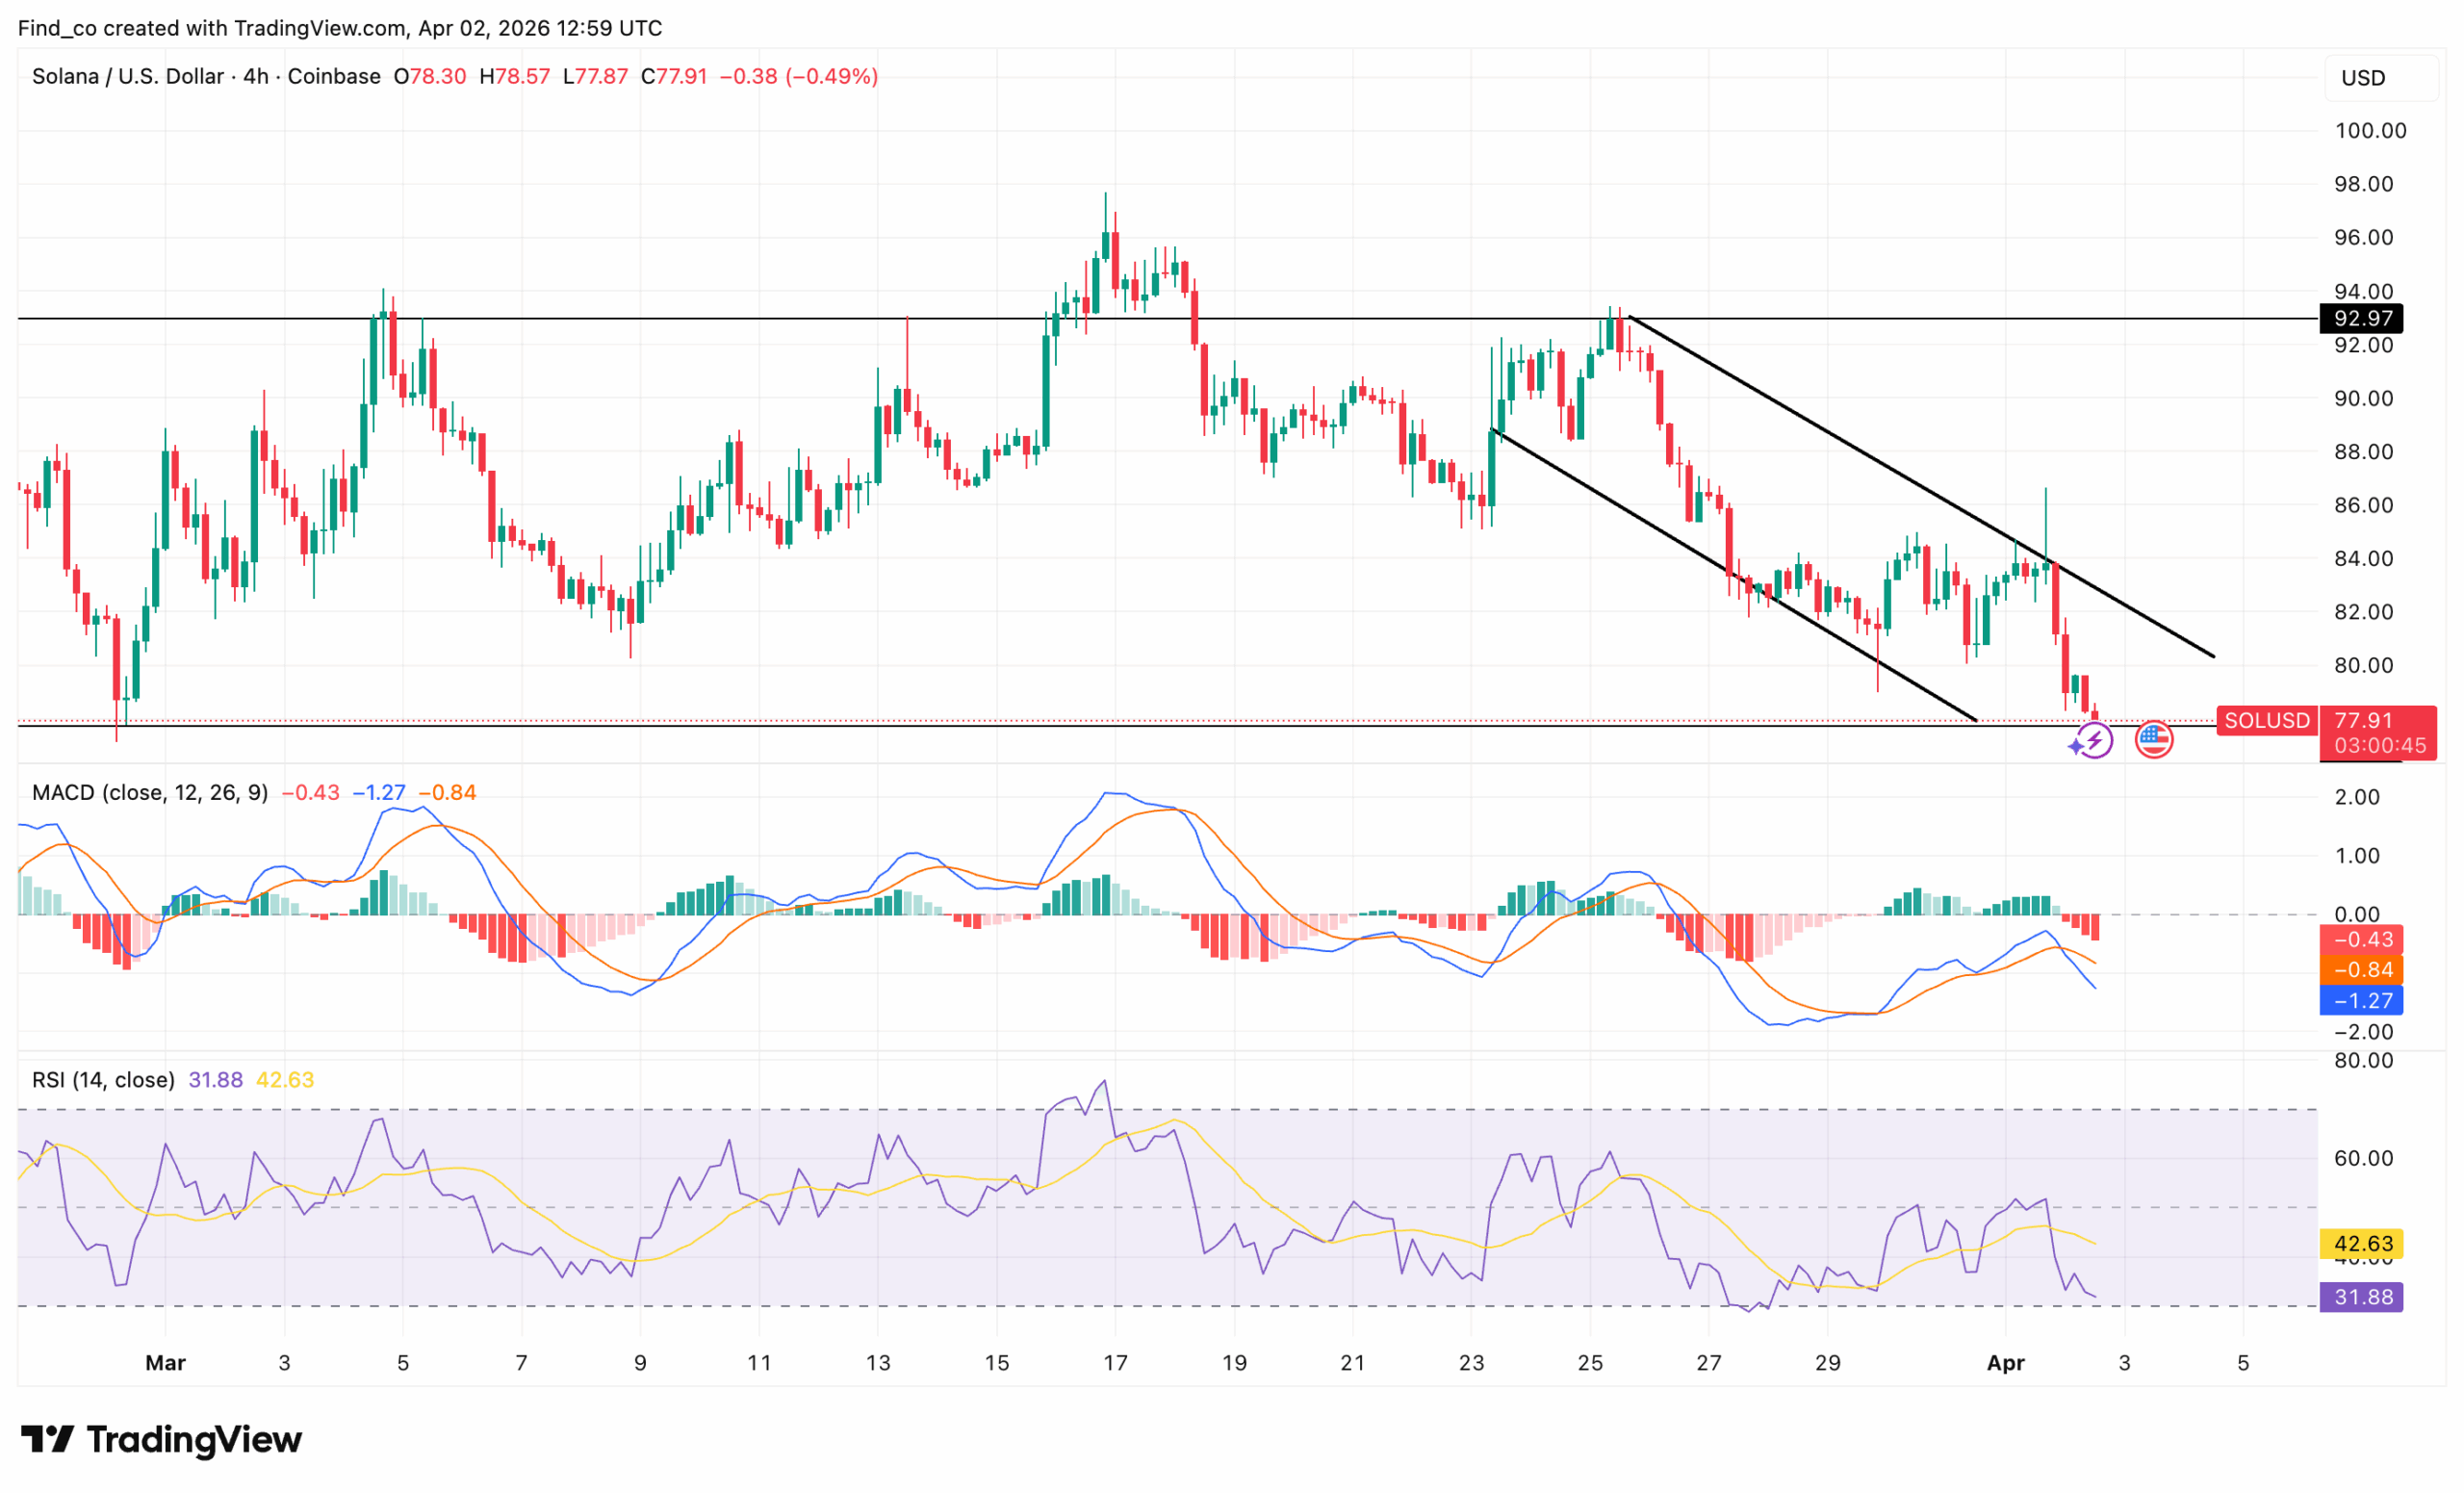
Momentum indicators on the 4-hour chart now align with the downside.
The Moving Average Convergence Divergence (MACD) has crossed bearish and continues to expand in negative territory. This signals growing selling pressure. At the same time, the histogram remains red, reinforcing the trend.
Meanwhile, the RSI sits around 35, approaching oversold conditions. However, it has not yet reached extreme levels. This suggests there is still room for further downside before a meaningful bounce occurs.
The market has shifted into a short-term downtrend. Lower highs and weaker bounces confirm this.
In addition, recent price action shows a lack of strong buying interest. If $77 fails, downside acceleration is likely. As such, sellers may push SOL’s price into lower-liquidity zones.
Long Liquidations Dominate Market
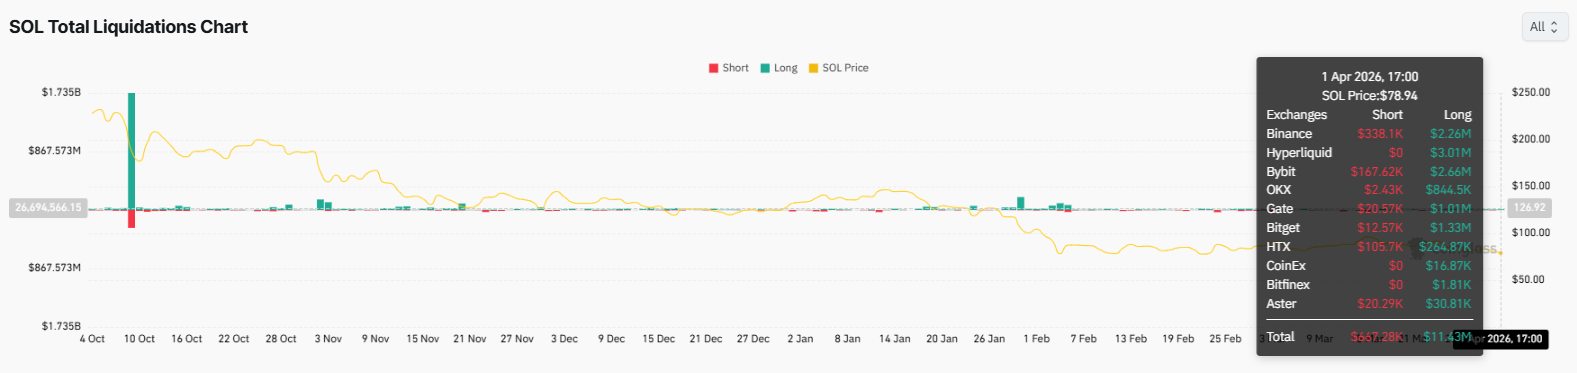
From the derivatives perspective, Solana shows a clear long-heavy liquidation profile as the price hovers near $78.94.
On April 1, total long liquidations across exchanges reached $11.43 million, compared with just $667,000 in shorts, highlighting a significant imbalance in trader positioning.
Binance and Bybit led the longs, posting $2.26 million and $2.66 million. However, smaller exchanges like Gate and HTX contributed $1.01 million and $264,000.
With such heavy exposure, Solana’s price faces elevated downside risk. If support around $78–$80 doesn’t hold, further liquidation cascades could trigger sharper declines in the near term.
SOL Price Forecast: Bearish Setup
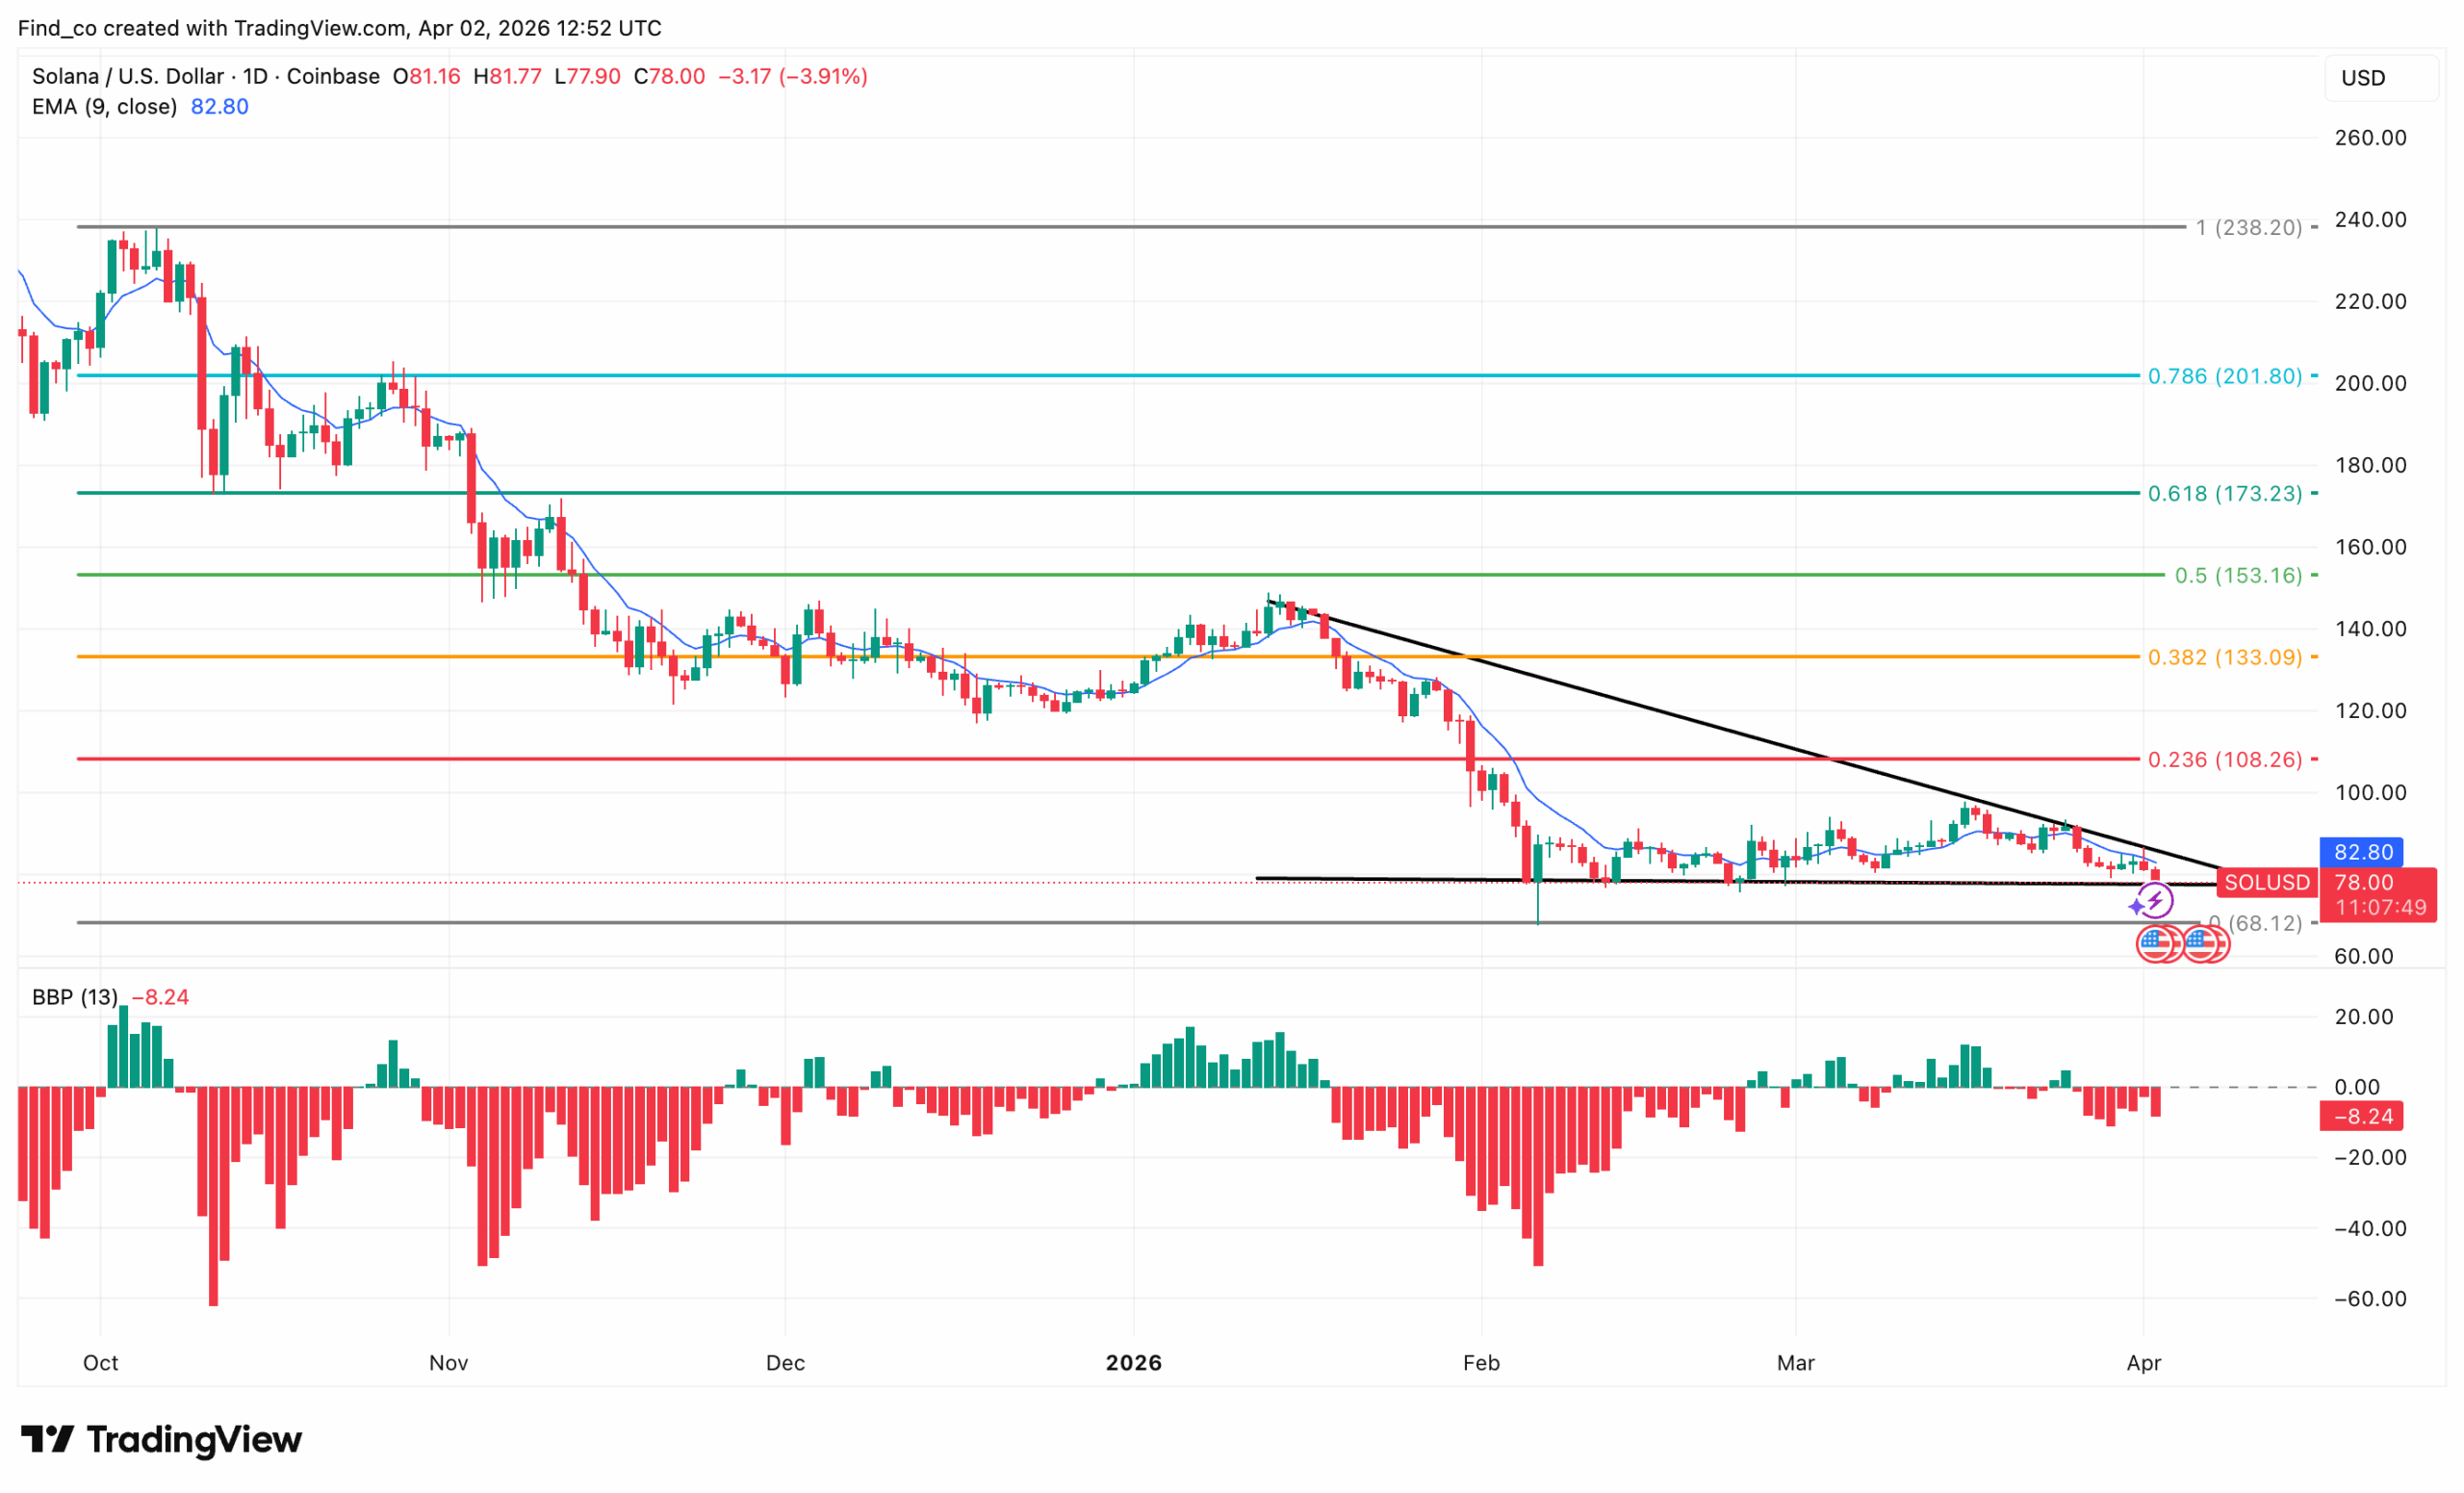
On the daily chart, SOL continues its downtrend, trading near $78.96 after failing to hold above the 20-day Exponential Moving Average (EMA) at $85.21.
The price now approaches a critical support zone around $67, following a series of lower highs and lower lows over the past several months.
SOL has been caught in a descending channel since early 2026. Attempts to reclaim $85 and higher resistance levels around $98 have repeatedly failed.
The breakout to the upside remains elusive as momentum wanes. The Bull Bear Power (BBP) indicator shows persistent negative pressure, confirming the bearish bias.
Fibonacci retracement levels suggest potential relief around $111 (0.236) and $138 (0.382) if buying volume increases.
However, continued weakness below $78-$80 could trigger a test of the $67 floor.
A break below $67 would confirm further downside, while a rebound above $85 could signal a potential short-term corrective move.
SOL May Test $60 Support
Meanwhile, technical analyst Crypto Patel explained that SOL is currently in its correction phase, and reaching $1000 during this period would be unrealistic without first consolidating at lower levels.
“Retail gets emotionally attached to big targets… Smart money waits for discounts. Deep corrections shake out weak hands before the next expansion,” Patel said.
He highlighted that key support between $70 and $50 will likely serve as an accumulation zone, while liquidity below $60 is a high-probability sweep area.
Besides that, the analyst added that patience is critical. So, these corrections allow stronger hands to build positions, setting the stage for a more sustainable rebound and preparing the market for SOL’s next significant upward move.
Disclaimer:
The information provided in this article is for informational purposes only. It is not intended to be, nor should it be construed as, financial advice. We do not make any warranties regarding the completeness, reliability, or accuracy of this information. All investments involve risk, and past performance does not guarantee future results. We recommend consulting a financial advisor before making any investment decisions.
Victor Olanrewaju is a crypto analyst and reporter at CCN with deep roots in on-chain research and technical analysis. His crypto journey began in 2017, but it was the 2020 Uniswap airdrop that sparked a full-time pivot into the space.
With a foundation in copywriting, Victor honed his craft creating high-converting content for leading crypto brokers — most notably an XRP price prediction that ranked #1 on Google during the 2021 bull run.
He later joined AMBCrypto in 2022, where he combined storytelling with technical and on-chain analysis to cover key market narratives.
In 2024, he expanded his expertise at BeInCrypto, collaborating with analysts and using tools like Glassnode, Santiment, and IntoTheBlock to break down Bitcoin and altcoin trends.
At CCN, Victor covers the top cryptocurrencies, memecoins, macro shifts, blending real-time insights with deep-dive metrics.
He holds a Bachelor’s degree in Physics from the University of Ibadan, equipping him to simplify complex data for a wide audience. Follow his work or connect on LinkedIn or X.