Is the StakeStone rally a liquidity trap? | Credit: Hameem Sarwar
Share
Key Takeaways
STO surged 2810% to a new all-time high, driven by aggressive demand and strong momentum.
Despite that, a whale has moved 12.43% of the total supply to an exchange after initially buying.
Analysis shows that the StakeStone token is overbought, and a pullback could be ahead.
STO, native to decentralized liquidity infrastructure protocol StakeStone, has hit an all-time high.
Notably, this happened within a few days. At some point, the STO price hit $1.60 before pulling back below the $1 psychological level.
What the rising market value does not capture is that the same window that produced a 2810% surge also documented a single wallet executing one of the large-scale distribution patterns visible in the current crypto market.
So, what does this mean for StakeStone’s price?
StakeStone Token Explodes
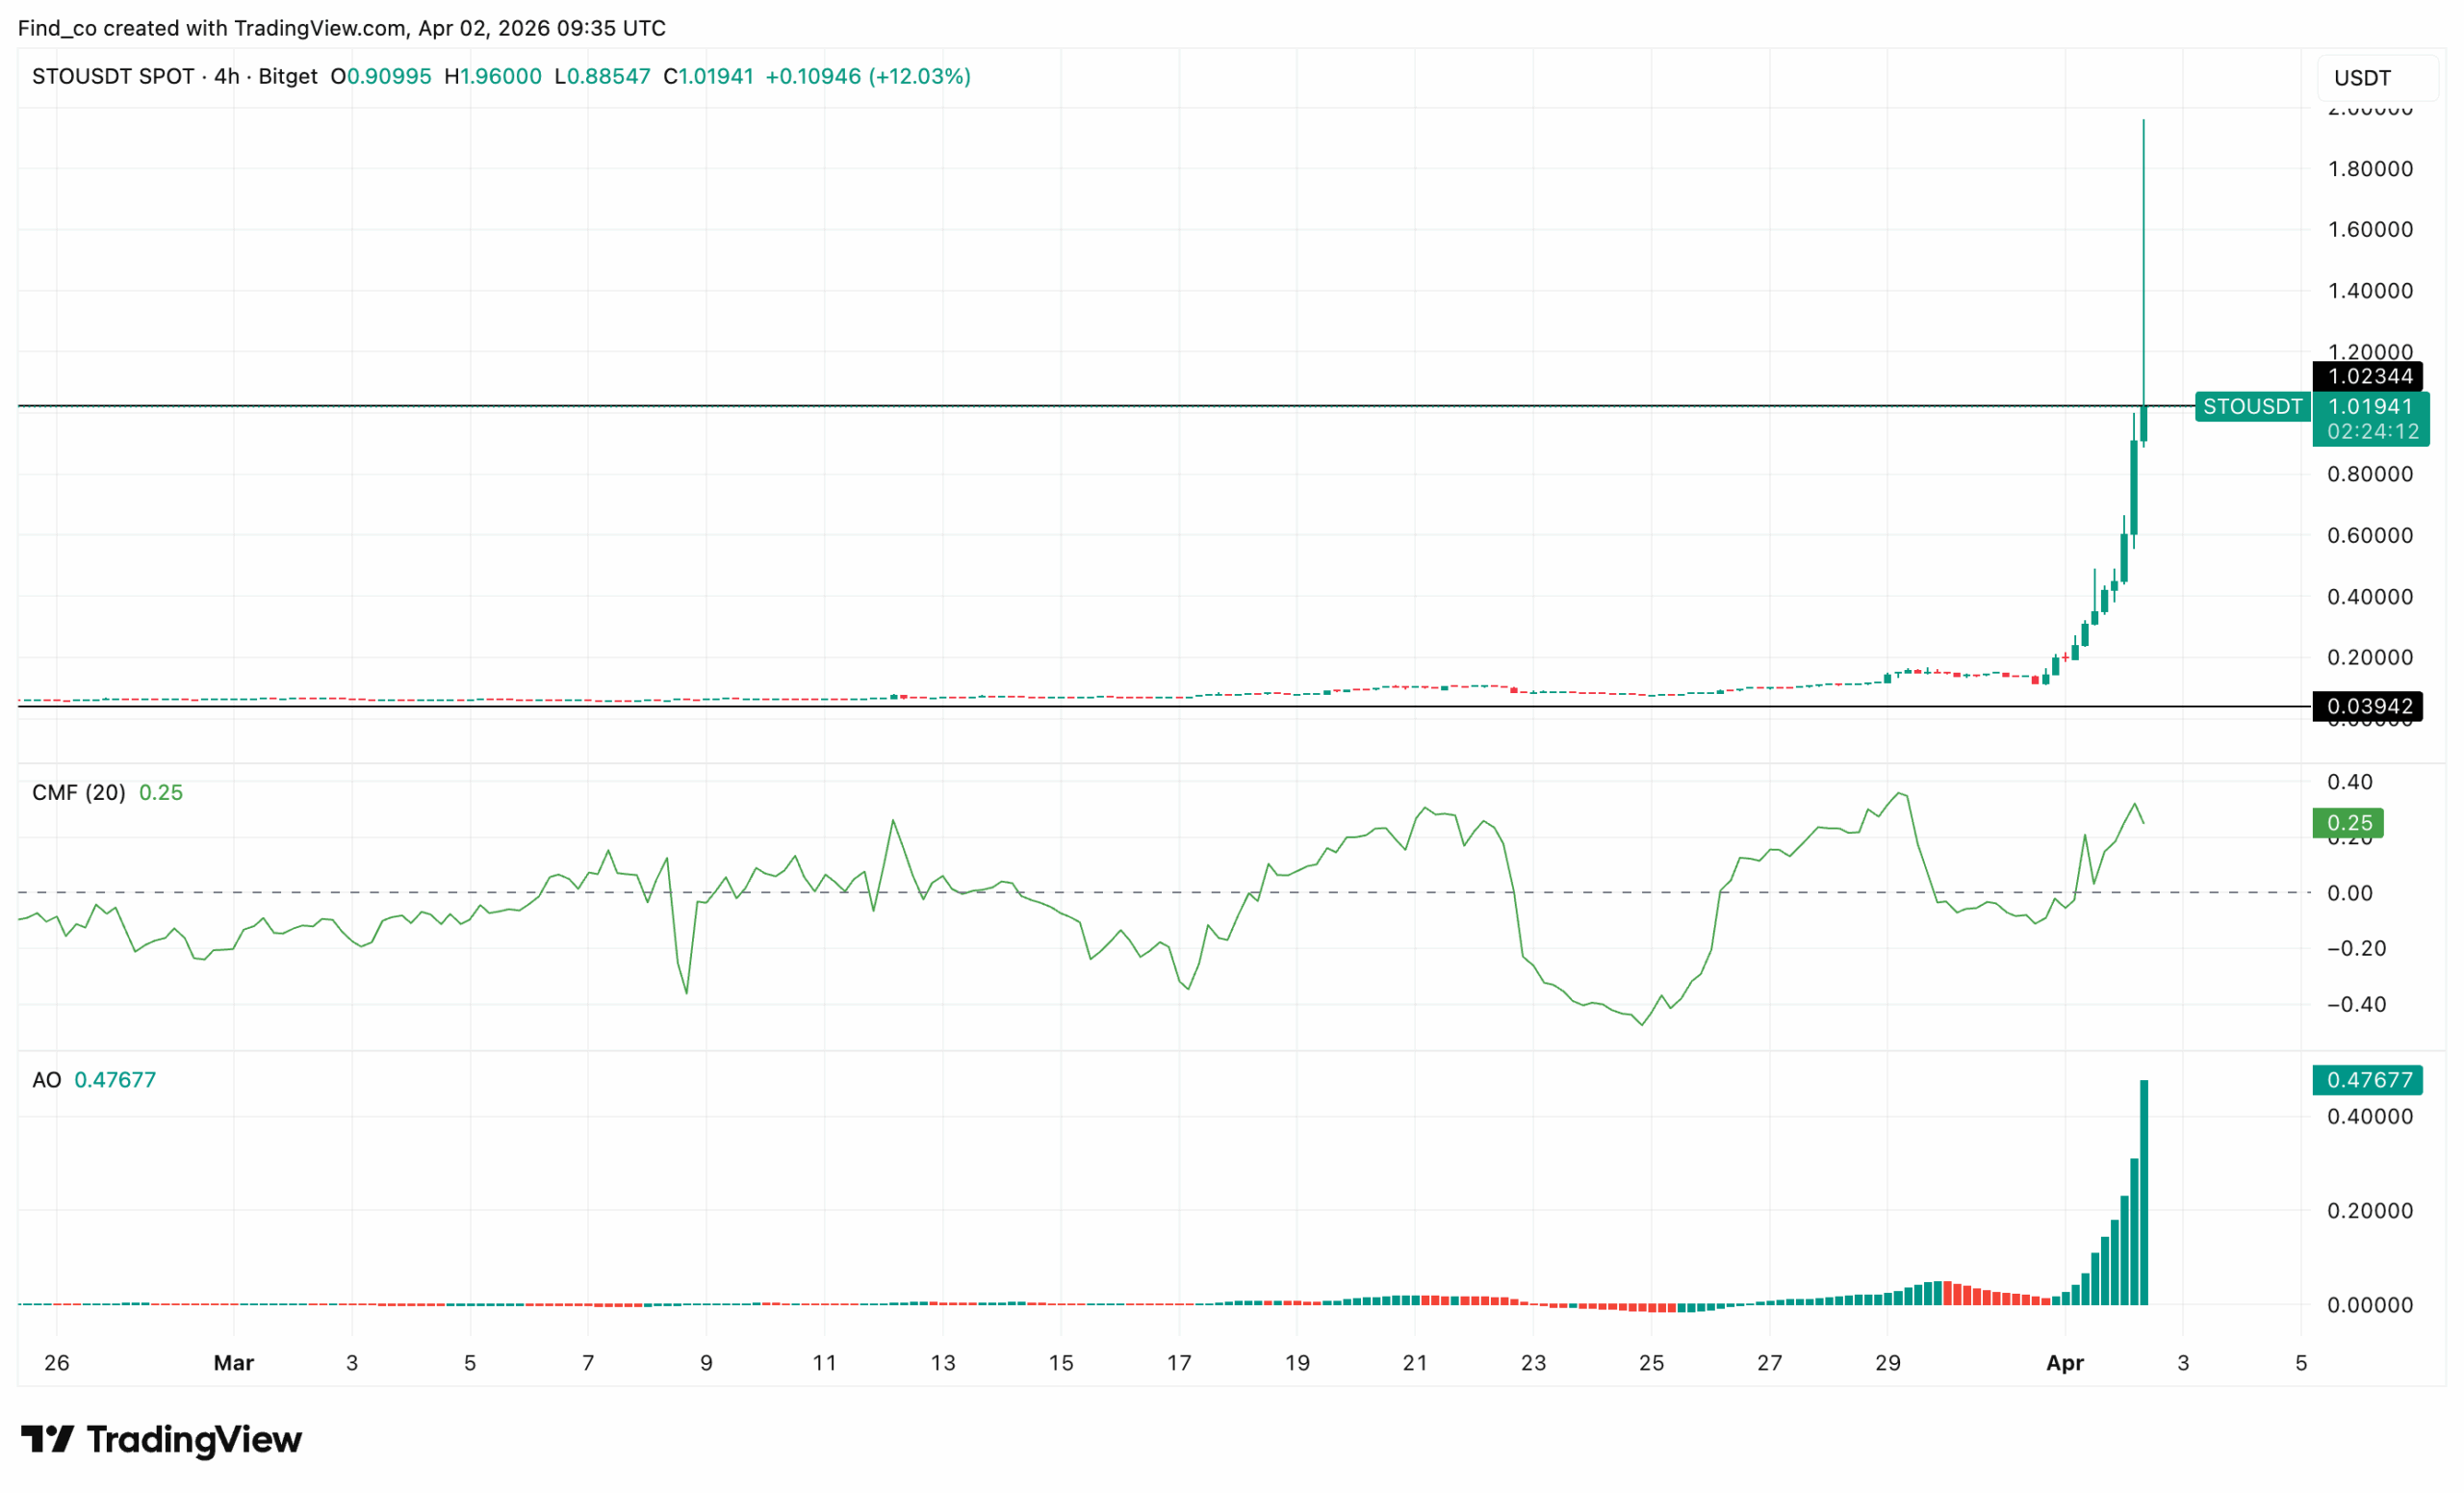
From a technical perspective, the 4-hour chart shows that StakeStone’s price has entered a phase of vertical expansion.
The price surged aggressively and is now testing a critical resistance zone near $0.95. Momentum remained strong.
However, the structure suggests a decision point is approaching.
The rally accelerated after a prolonged consolidation. But buyers stepped in, driving the altcoin’s price higher.
Get These Top Crypto Casino Offers Now!
Sponsored
Disclosure
We sometimes use affiliate links in our content, when clicking on those we might receive a commission at no extra cost to you. By using this website you agree to our terms and conditions and privacy policy.
As a result, the price printed a series of strong bullish candles with minimal pullbacks. This signals aggressive demand and potential FOMO-driven entries.
Momentum indicators on the 4-hour chart confirm the bullish bias. The Chaikin Money Flow (CMF) sits at 0.32, indicating sustained capital inflows. This shows that buyers are not just present; they are dominant.
At the same time, the Awesome Oscillator (AO) is expanding upward with growing green histogram bars. This reflects increasing bullish momentum.
More importantly, the expansion phase suggests the trend is still active, not exhausted.
If buyers sustain pressure, the rally could extend further. However, since the StakeStone price appears to be approaching overvalued territory, it could decline.
Pump and Dump Scheme for STO?
Within the period, STO surged from $0.11 to $1.60, and a newly created wallet withdrew 25.5 million STO tokens, valued at roughly $4.85 million, from Binance.
That single transaction accounted for 11.32% of STO’s circulating supply.
A fresh wallet pulling more than 11% of a token’s supply from a major exchange is not normal accumulation.
It is the kind of position construction that precedes coordinated price action — either a genuine institutional buy or a deliberate pump-and-distribute operation.
However, not long ago, the same wallet deposited all 28 million tokens (now worth $10.12 million) to Gate exchange.
The arithmetic is stark: $4.85 million withdrawn, $10.12 million deposited, $5.27 million in unrealized profit generated on a position representing 12.43% of circulating supply.
A Gate deposit of that magnitude does not signal long-term conviction.
It signals preparation to pass along the price surge driven by retail demand. As it stands, the StakeStone price may soon undergo a severe correction.
Network Usage Fails to Match Surge
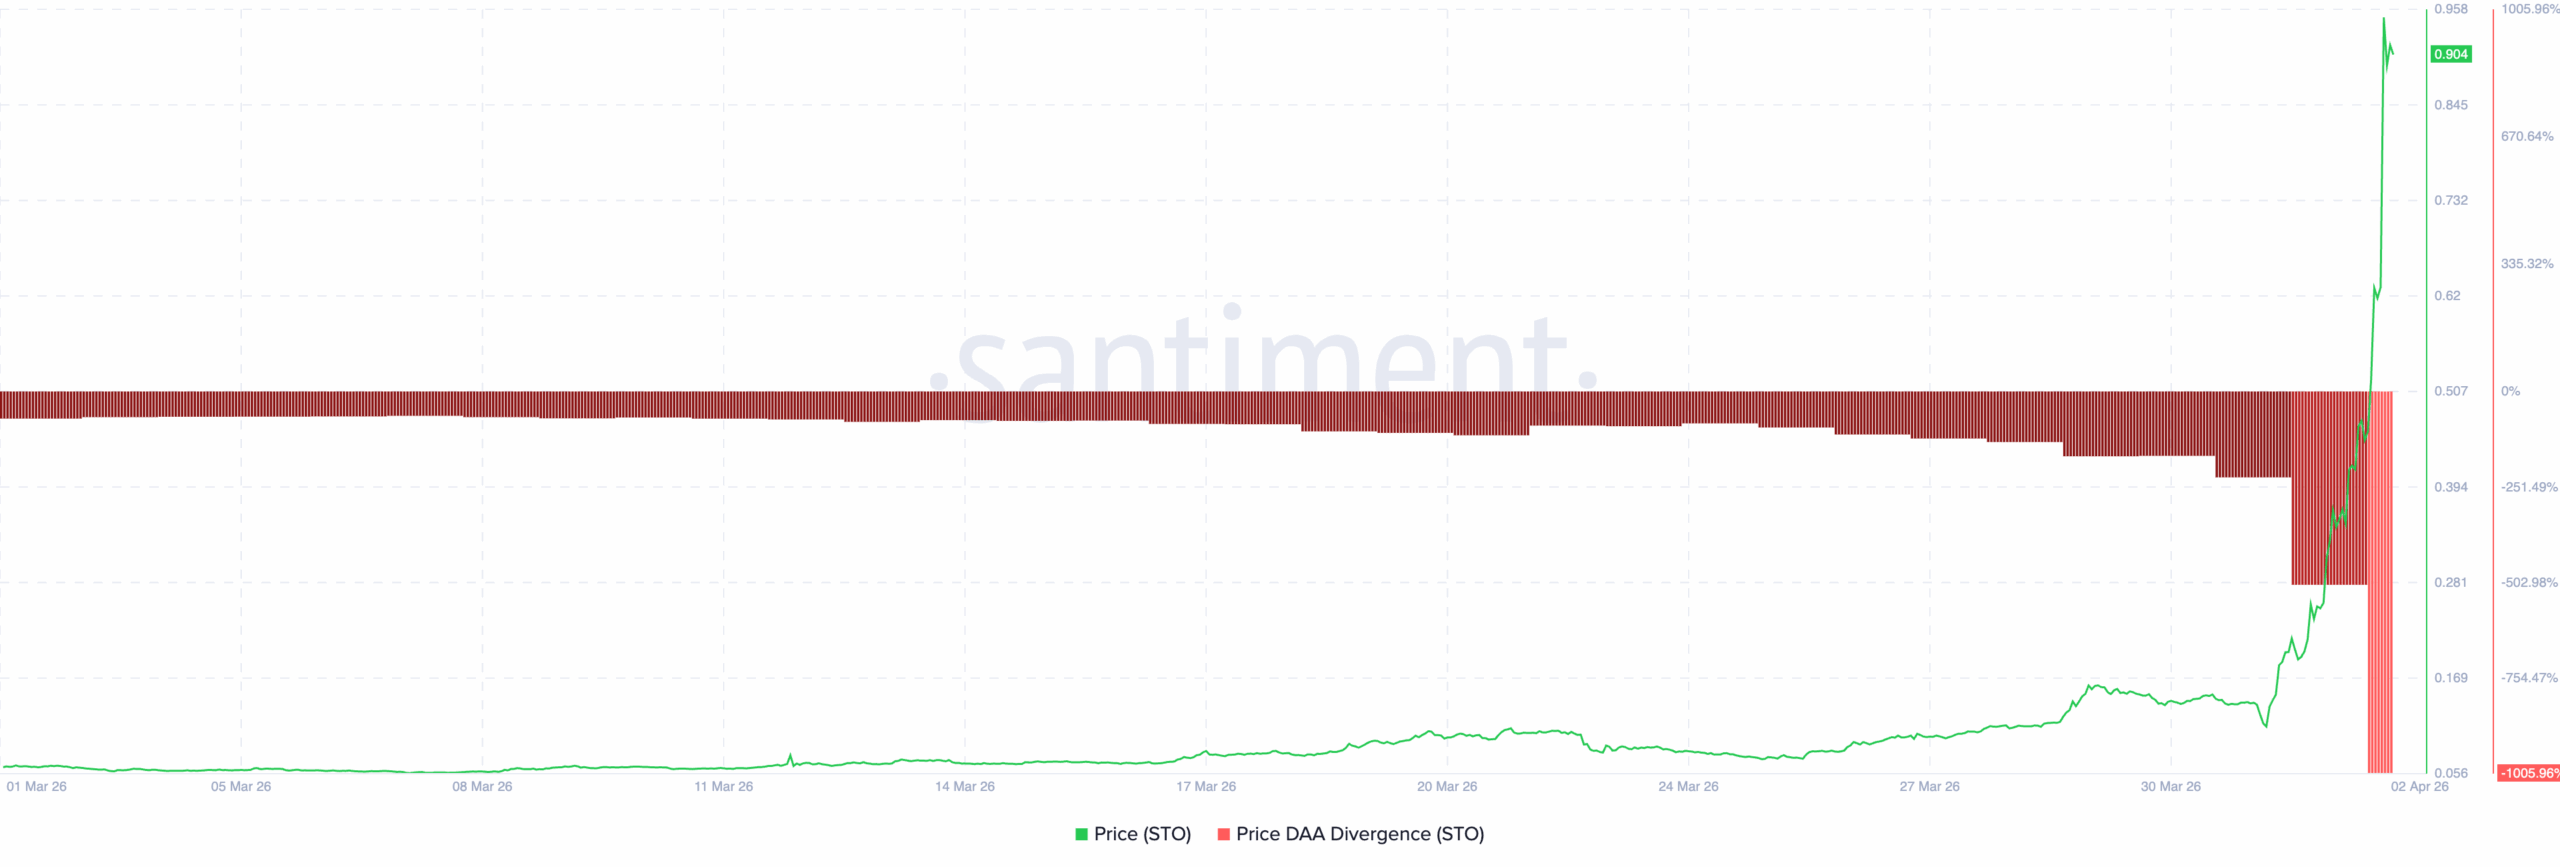
From an on-chain perspective, Santiment’s STO Price Daily Active Addresses (DAA) Divergence reveals a textbook case of price detaching dangerously from network reality.
Throughout March, the price climbed steadily from $0.058 to $0.450, suggesting a legitimate rally.
However, the DAA Divergence remained persistently negative throughout. This indicates that fewer unique wallets were engaging with the network even as the STRO price rose.
Today, the StakeStone price briefly spiked to $0.96 before collapsing back toward $0.090.
Amid that, the DAA Divergence simultaneously crashed to -1005.98%, reflecting a complete disconnect between price action and actual user activity.
If sustained, this means that the cryptocurrency’s overall health is at risk. Hence, it is likely that the altcoin’s market value will erase much of its recent gains.
STO Price Prediction: Decline Ahead
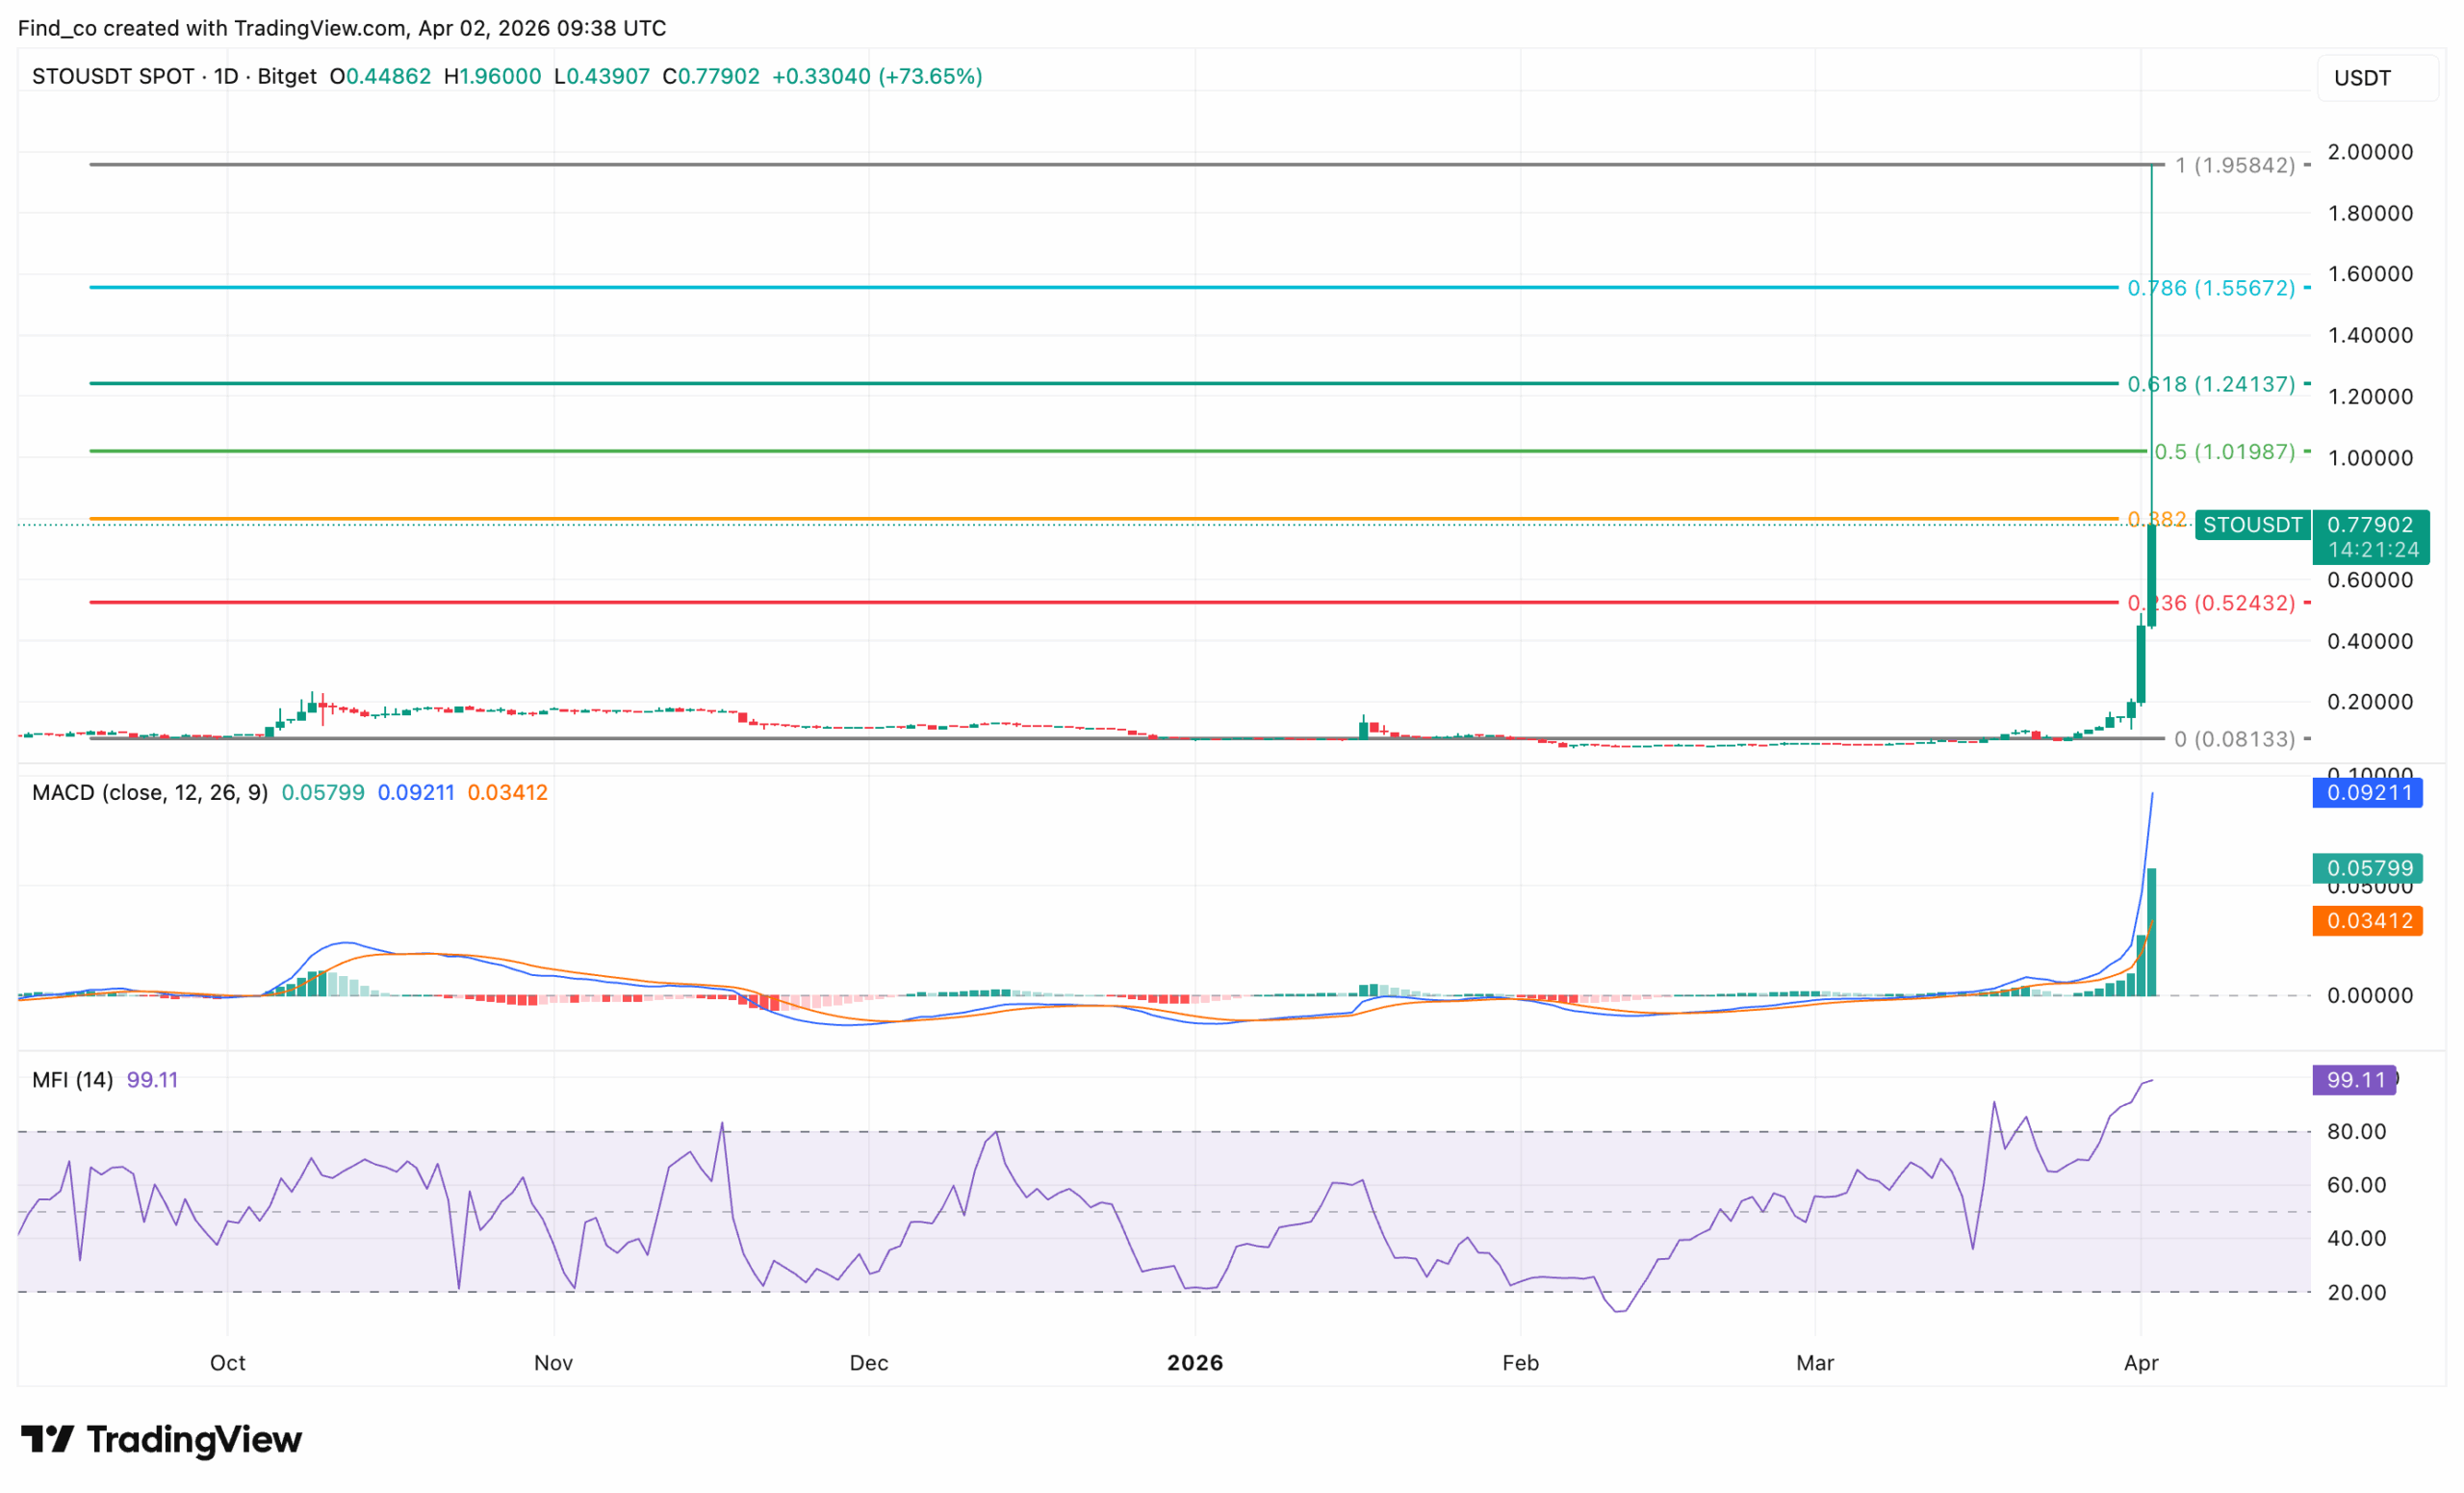
On the daily chart, STO’s price has surged into the $1.60 range, posting a triple-digit gain after months of sideways trading between $0.05 and $0.17.
Buyers stepped in steadily through March, forming higher lows before a sharp breakout accelerated momentum.
Furthermore, StakeStone’s price pierced through key Fibonacci levels without hesitation, extending toward $0.81 and now pressing the upper boundary near $1.01.
Besides that, the Moving Average Convergence Divergence (MACD) reflects strong bullish momentum, but the Money Flow Index (MFI) is near 98, signaling overbought conditions.
The breakout confirms a shift from accumulation to expansion. As long as STO’s price holds above $0.64-$0.81, buyers control the market.
A loss of momentum could push the price back to $0.64 or $0.53. However, a clean break above $1.01 may trigger another leg higher if fresh demand appears.
Disclaimer:
The information provided in this article is for informational purposes only. It is not intended to be, nor should it be construed as, financial advice. We do not make any warranties regarding the completeness, reliability, or accuracy of this information. All investments involve risk, and past performance does not guarantee future results. We recommend consulting a financial advisor before making any investment decisions.
Victor Olanrewaju is a crypto analyst and reporter at CCN with deep roots in on-chain research and technical analysis. His crypto journey began in 2017, but it was the 2020 Uniswap airdrop that sparked a full-time pivot into the space.
With a foundation in copywriting, Victor honed his craft creating high-converting content for leading crypto brokers — most notably an XRP price prediction that ranked #1 on Google during the 2021 bull run.
He later joined AMBCrypto in 2022, where he combined storytelling with technical and on-chain analysis to cover key market narratives.
In 2024, he expanded his expertise at BeInCrypto, collaborating with analysts and using tools like Glassnode, Santiment, and IntoTheBlock to break down Bitcoin and altcoin trends.
At CCN, Victor covers the top cryptocurrencies, memecoins, macro shifts, blending real-time insights with deep-dive metrics.
He holds a Bachelor’s degree in Physics from the University of Ibadan, equipping him to simplify complex data for a wide audience. Follow his work or connect on LinkedIn or X.