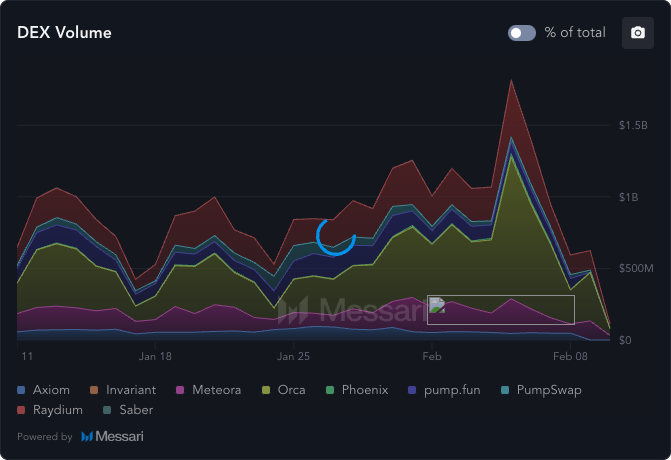
Solana DEX Volume Sees Major Decline
The headline numbers look dramatic, but context is everything. In January 2026, Solana recorded a monthly DEX volume of $117.7 billion, averaging nearly $3.8 billion per day.
Against that, today’s activity signals a near-total evaporation of speculative flow. Daily DEX volume on Feb. 9 fell to roughly $112 million, a level last seen in the opening stages of the 2024 bull run.
This collapse matters because liquidity is sometimes fuel for Solana’s price. With traders and market makers stepping back, even modest sell pressure can push SOL lower, while rallies struggle to gain traction.
Therefore, until volume returns in a sustained way, Solana’s price is likely to remain prone to sharp swings and vulnerable to another leg down rather than a durable recovery.
4-Hour Chart Remains Bearish
Technically, the chart offers little comfort. The $100 zone, once a powerful support, has now flipped into heavy resistance.
As seen below, Solana’s price trades within a broader bearish structure. Notably, after breaking down from the $120 region, the price completed a near 40% drawdown, finding temporary acceptance around $80.
Since then, Solana’s price has stopped trending and begun forming a tight symmetrical triangle.
Structurally, this triangle is forming below the 50 EMA ($92), which keeps the higher-timeframe bias bearish.
That said, momentum tells a subtler story. For instance, the Awesome Oscillator (AO) has been making higher lows, even as Solana’s price moved sideways.
As it stands, if SOL’s price breaks down from the triangle, the $80 support zone becomes critical.
Losing it might reopen downside toward the $75, aligning with broader bear-market continuation.
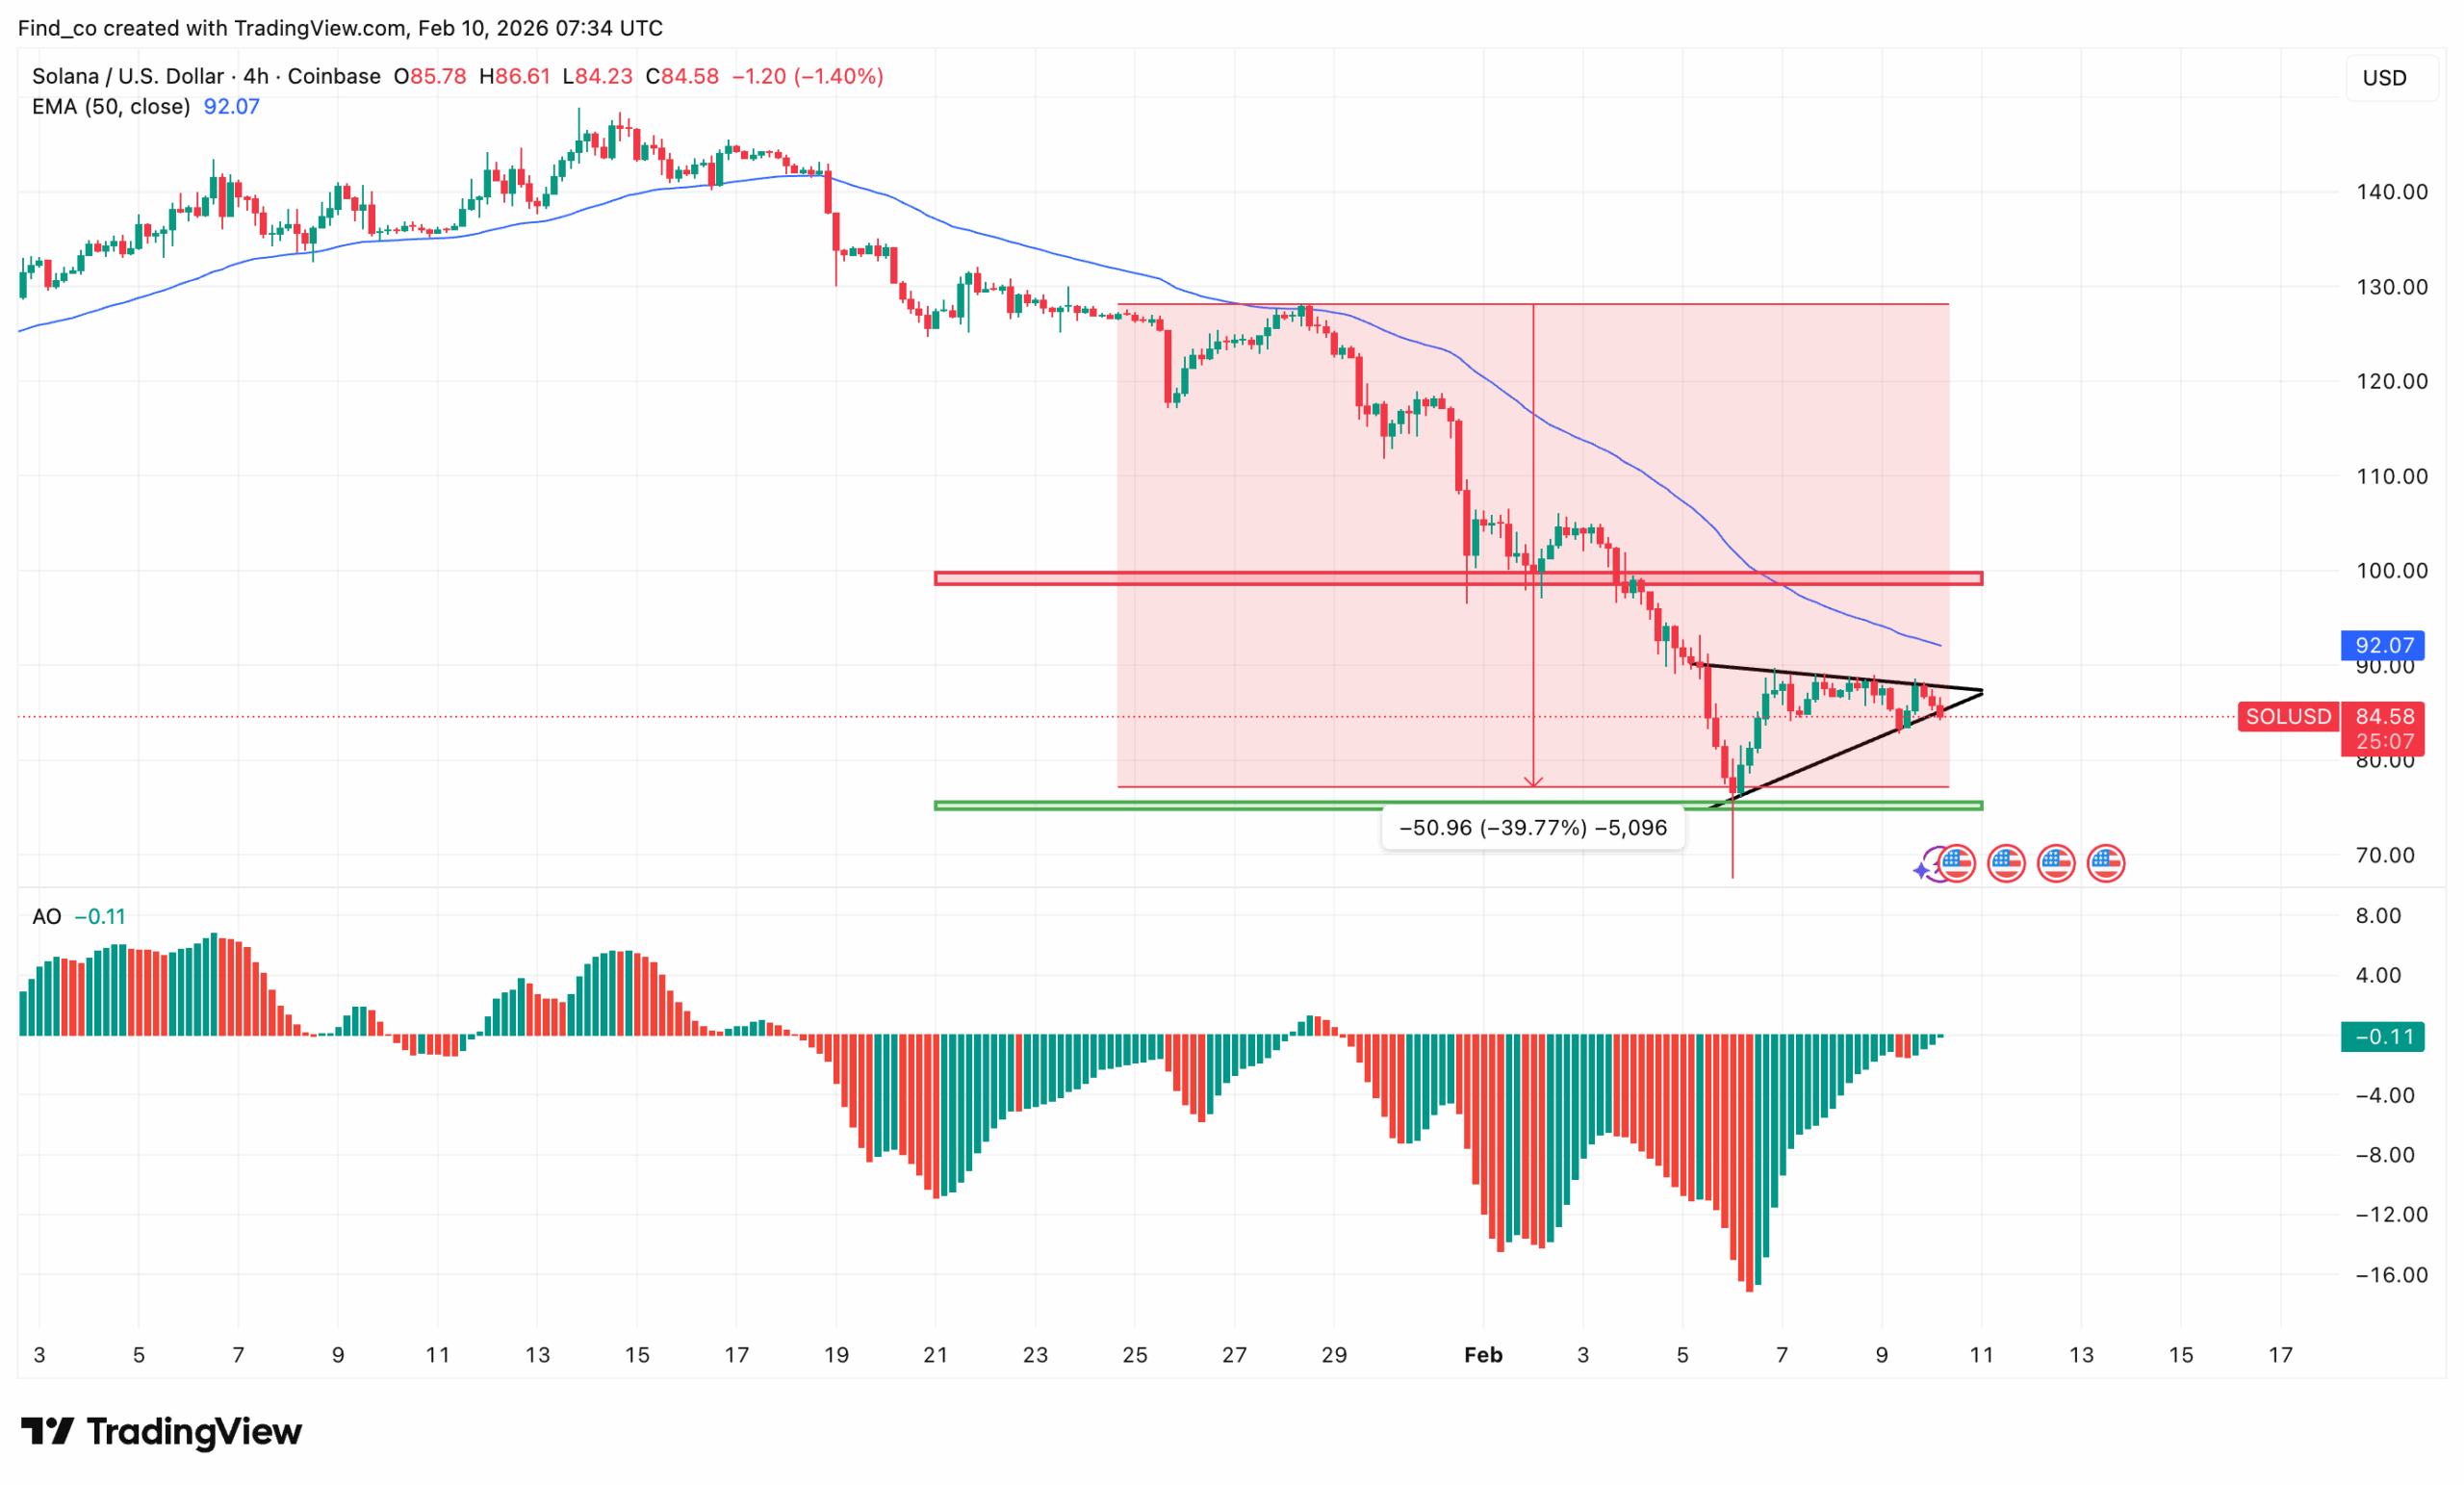
However, if SOL breaks up and reclaims the $92 with momentum, the move is likely a bear-market relief rally, targeting prior resistance near $100.
Funding Rate Adds to the Thesis
From an on-chain perspective, Solana’s funding rate structure adds an important layer of confirmation to the bearish price action.
Funding rates have remained negative for an extended period, meaning the majority of leveraged positioning is skewed toward shorts paying longs.
What stands out here is the disconnect between funding and Solana’s price.
Despite funding becoming more negative in early February, SOL failed to make new lows after the liquidation wick.
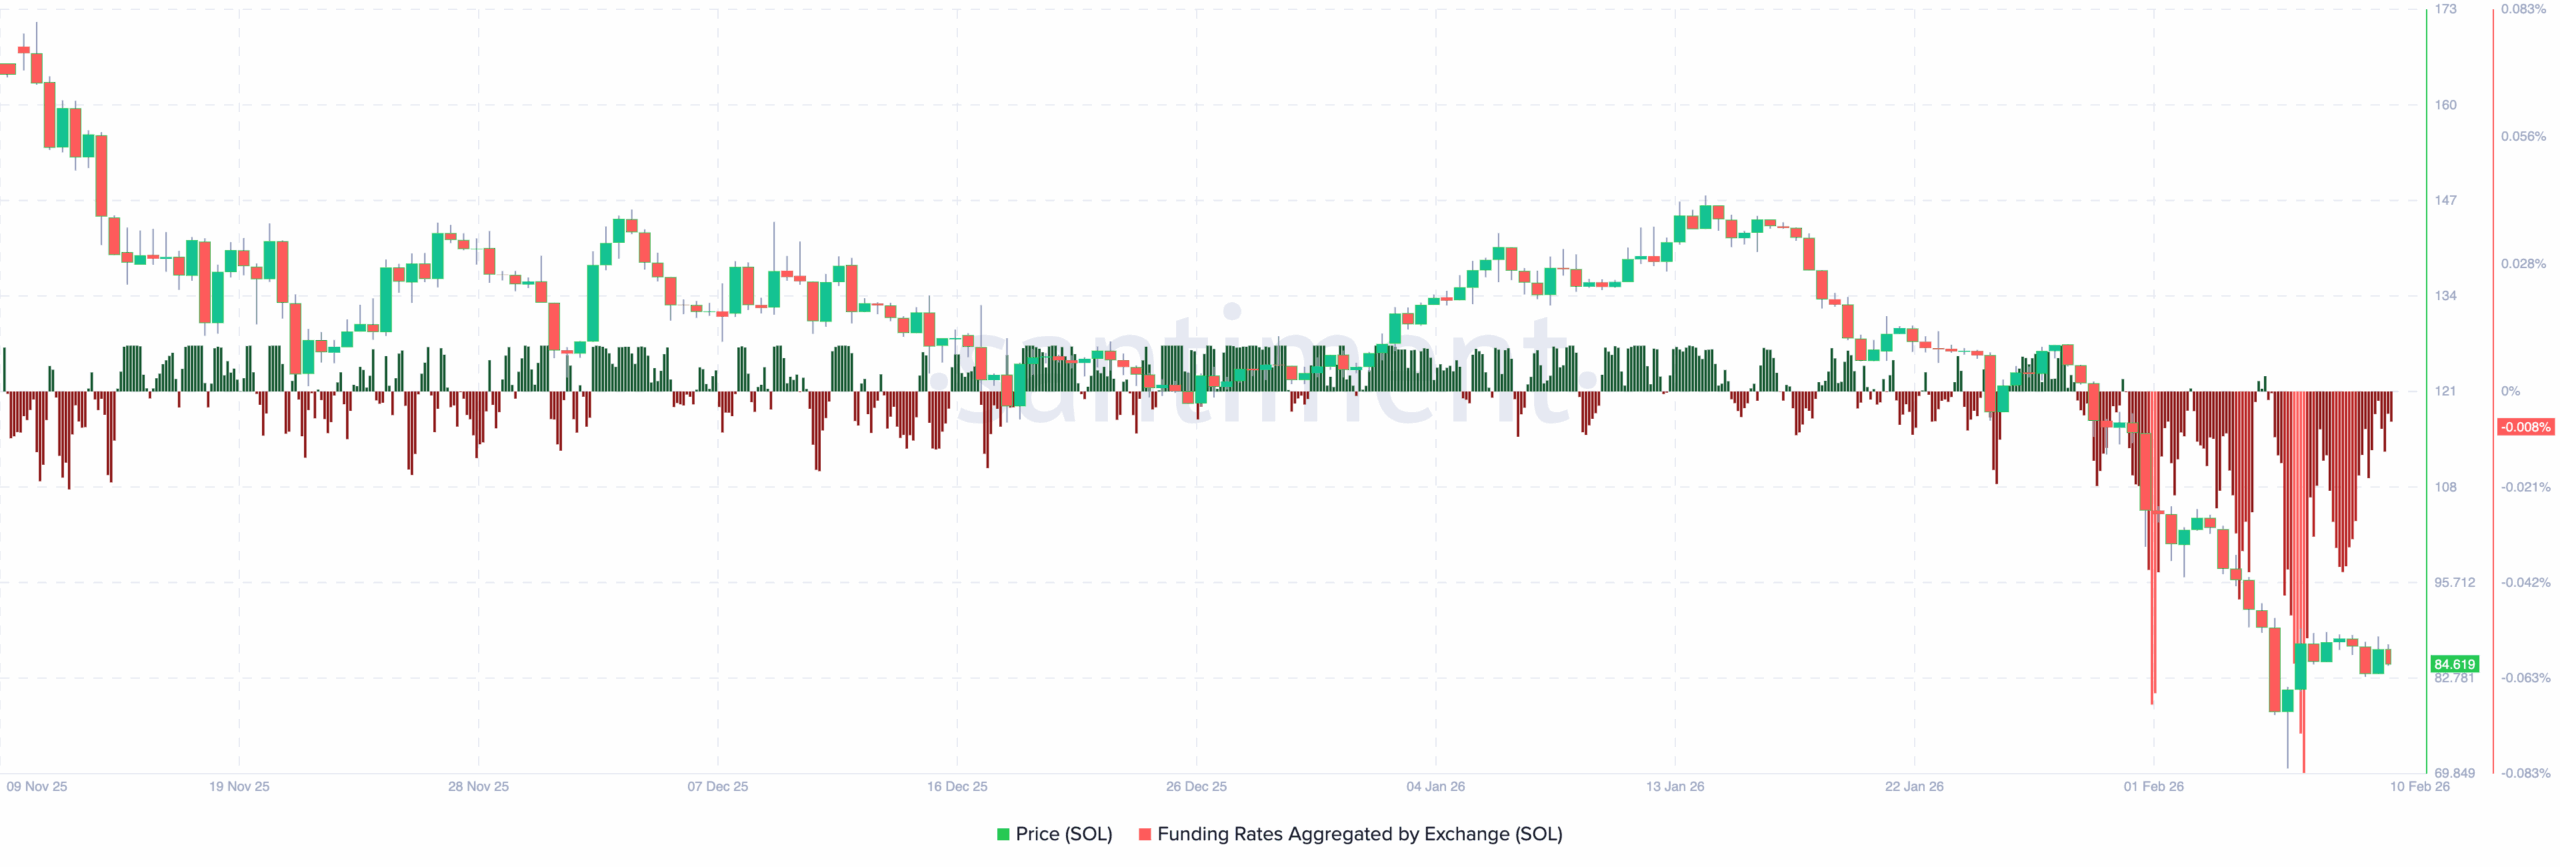
Instead, Solana’s price stabilized and began forming a support level around $85. However, as of this writing, it does not seem like SOL will undergo a short squeeze.
Instead, the altcoin will likely keep consolidating, or, in a worst-case scenario, SOL might decline toward $75.
SOL Price Prediction: Lower
In the meantime, Solana’s daily structure reinforces the idea that it has entered the bear market.
At the time of writing, the SOL price remains locked inside a descending channel.
Furthermore, the loss of the 0.236 Fibonacci level ($111) was structurally important as it marked the transition from corrective weakness.
Since then, SOL has accelerated toward the lower boundary of the channel, confirming that sellers still control higher timeframes.
In addition, the Moving Average Convergence Divergence (MACD) is negative and still expanding to the downside, showing that bearish momentum hasn’t fully reset yet.
However, the RSI is now oversold, sitting near levels that historically align with local bottoms. Still, this doesn’t mean a trend reversal.
However, it does suggest that a more intense downside from here is increasingly inefficient.
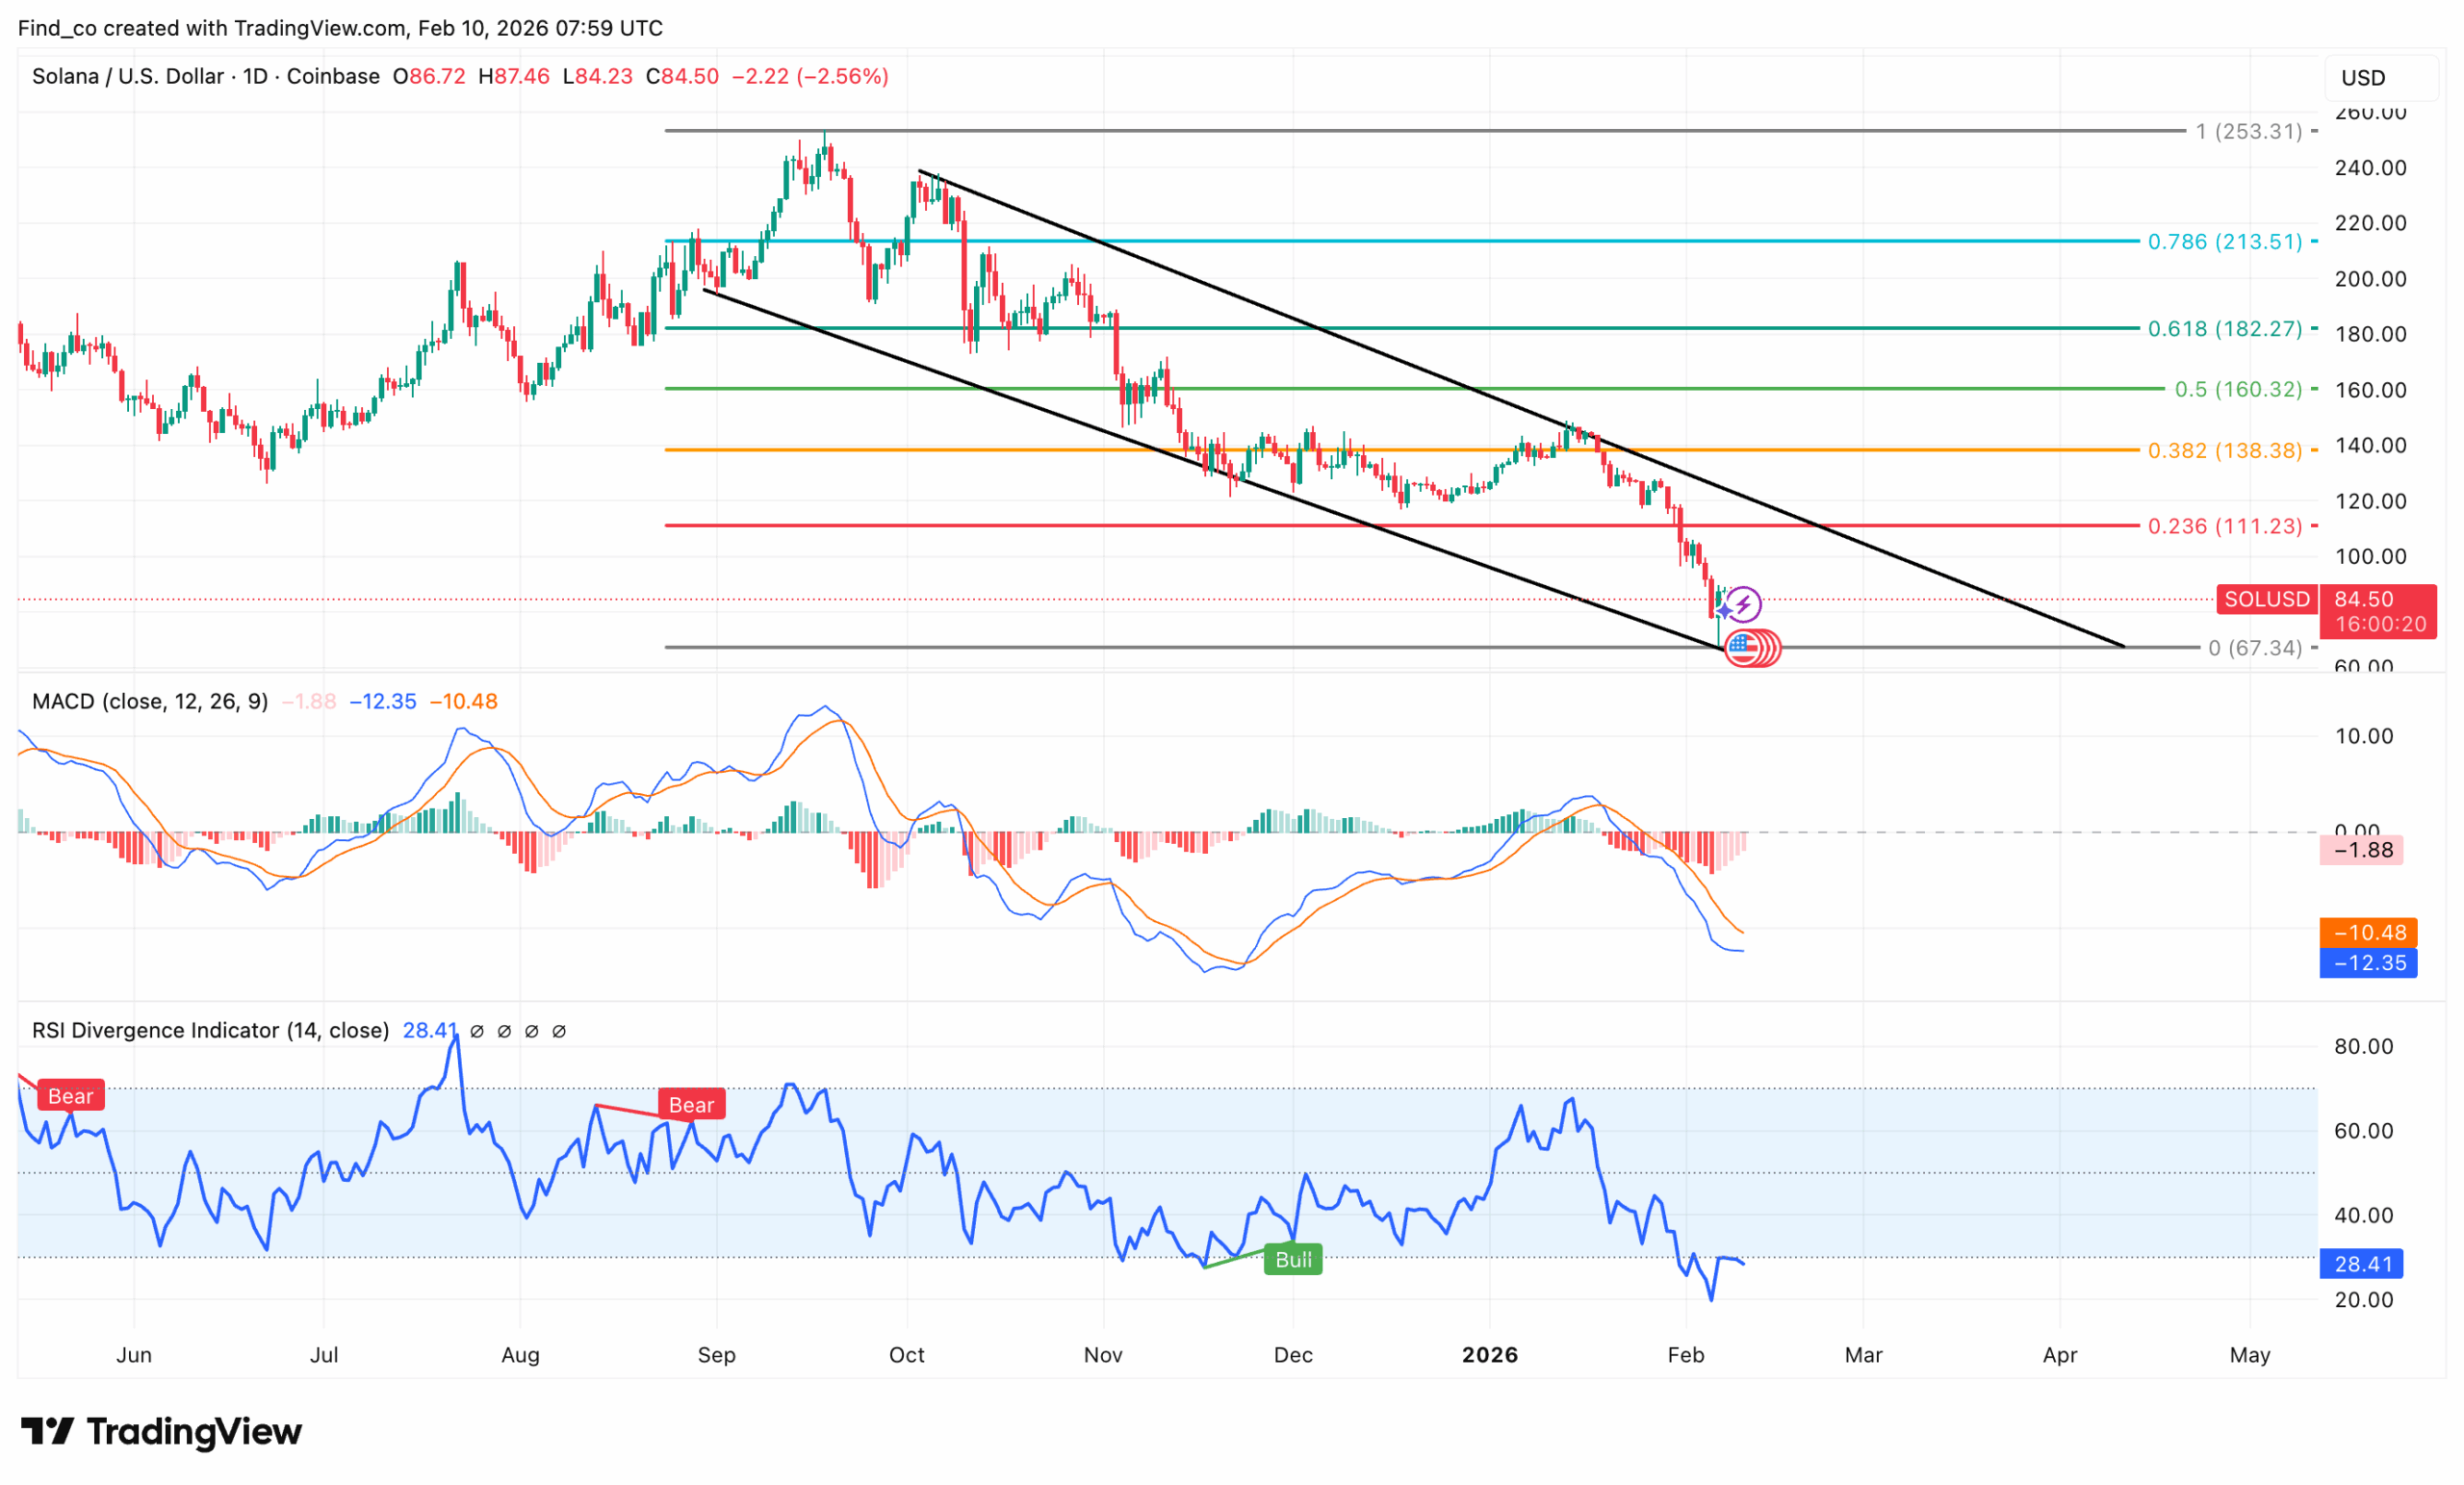
What matters most are the key support and resistance levels. As it stands, if Solana’s price fails to restest the $100 support, the next downward target could be near $67.
On the contrary, if buying pressure increases, the trend might change. In that scenario, Solana’s price might rise to $138.38.