Zora Launches Attention Markets on Solana: How Users Can Trade Trending Topics
Share
Key Takeaways
SOL was rejected near $145, turning the structure bearish.
Bearish indicators point to a drop toward $125 support.
ETF outflows and falling OI show rising investor caution.
Solana (SOL) is back under heavy selling pressure after its latest recovery attempt failed. At the time of writing, the price rolled over again after rejection near $145.
This rejection has shifted the short-term market structure back in favor of the bears, dragging SOL’s price toward the lower boundary of its trading range and firmly back into focus the $125 support level.
As momentum fades and sellers regain control, SOL now faces the risk of an extended corrective phase unless buyers can quickly reclaim lost levels.
Short-term indicators already reflect this weakness, reinforcing the view that the bounce was corrective rather than the beginning of a broader trend reversal. So, what’s next for Solana’s price?
Solana Breaks Down Again
Momentum indicators continue to confirm that SOL remains trapped in a short-term downtrend.
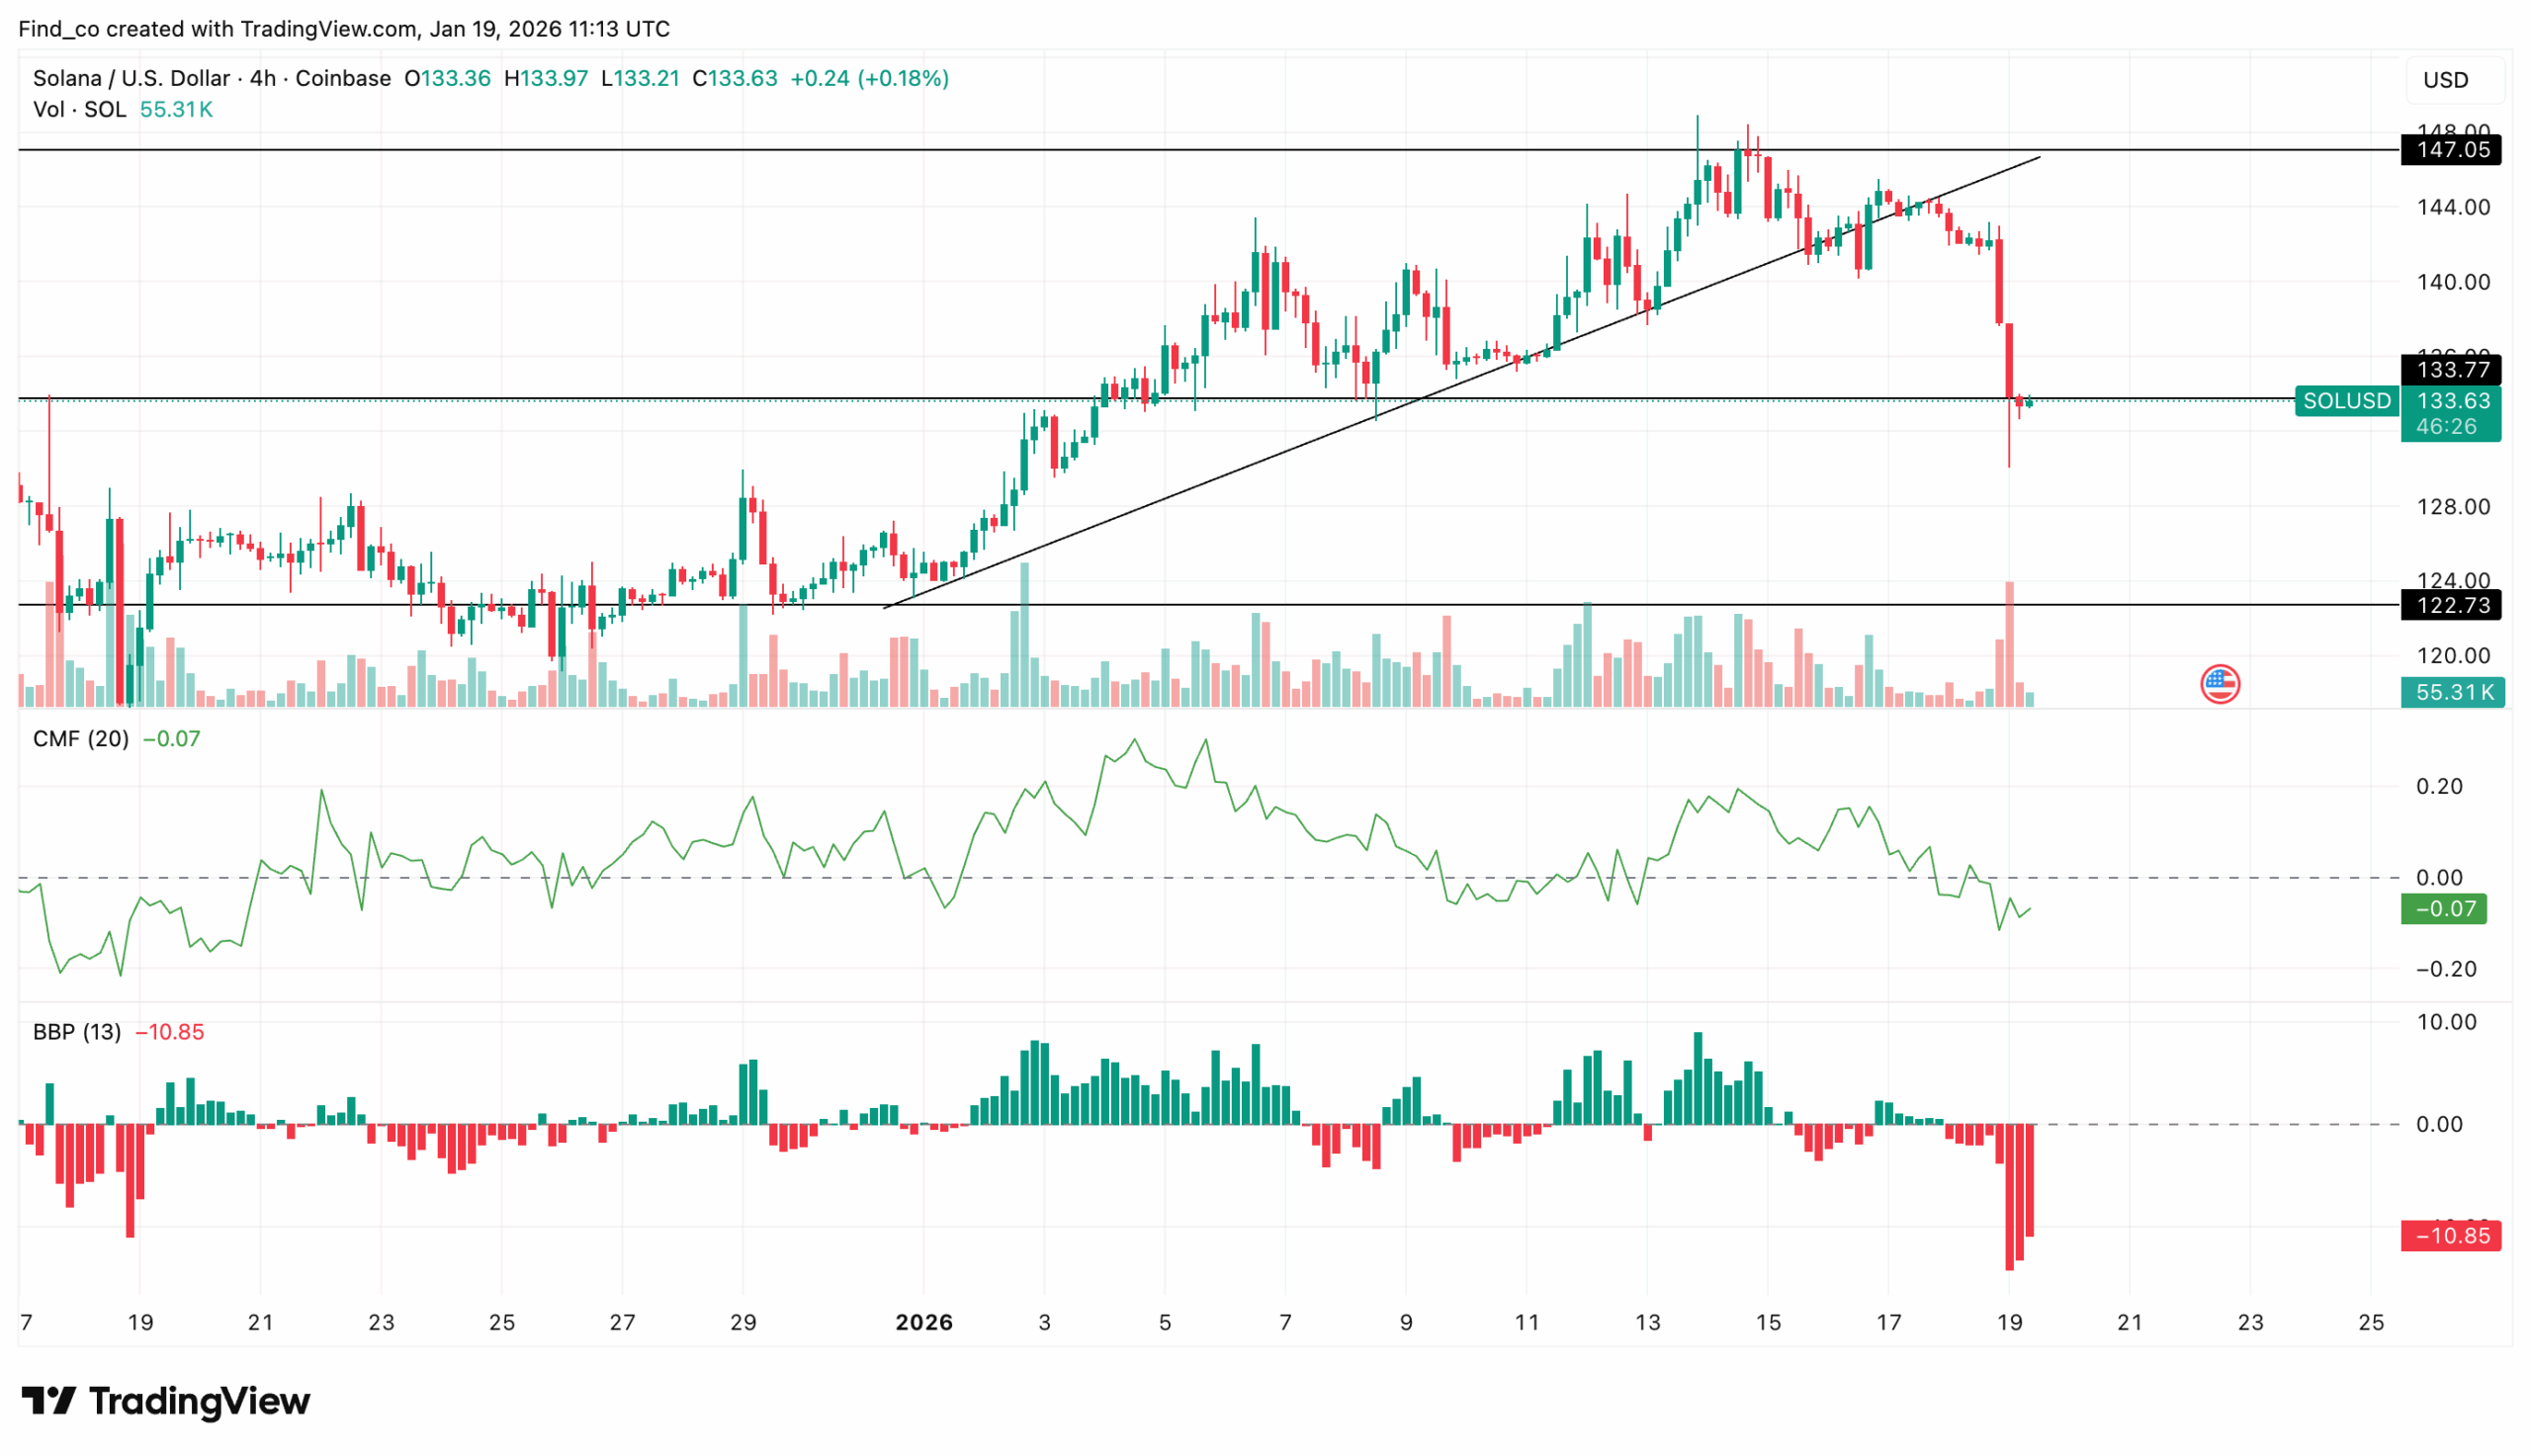
On the 4-hour chart, the Chaikin Money Flow (CMF) remains negative at -0.09, signaling persistent capital outflows and weakening buyer conviction.
As a result, recent rebounds continue to show limited accumulation support.
At the same time, Bull Bear Power (BBP) strengthens the bearish case and reinforces the current structure. The BBP indicator remains deeply negative at -13.20, while expanding red histogram bars point to increasing sell-side pressure.
This represents the strongest bearish impulse since early January. It also confirms that sellers remain firmly in control of near-term price action.
Meanwhile, SOL’s price has broken below its short-term demand zone near $135 and now trades beneath its prior breakout base.
This failed recovery setup increases the likelihood of a continuation move toward the $125 support level. Notably, this marks the next major demand area from the December consolidation range.
Should Solana’s price break below $125, downside risk would extend toward the lower liquidity pocket around $118 to $120, where buyers previously showed aggressive interest.
Market Activity Signals Caution
Looking at derivatives data, market conditions add further weight to the bearish outlook. For instance, open interest (OI) has dropped to 8%, reflecting a notable reduction in leveraged positions across the market.
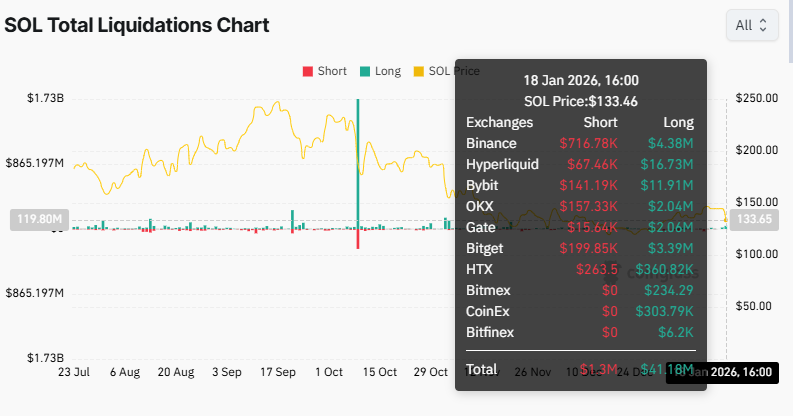
At the same time, over $1.3 million in short liquidations occurred within the past 24 hours, highlighting rising volatility as traders were forced out of bearish positions during sharp intraday swings.
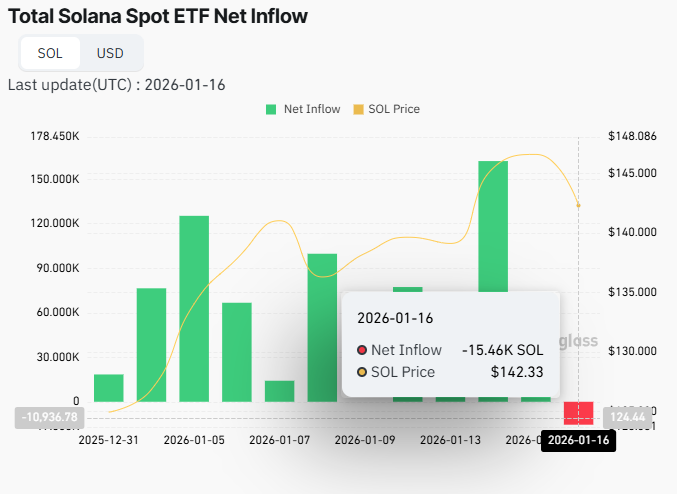
On the institutional side, sentiment is shifting as well. Solana’s exchange-traded funds (ETFs) recorded a $15.46 million spot net outflow over the last 24 hours, marking the first net outflow in six weeks.
This move suggests that some large investors are trimming exposure or adopting a more cautious stance amid growing market uncertainty.
SOL Price Analysis: No Way Out Yet
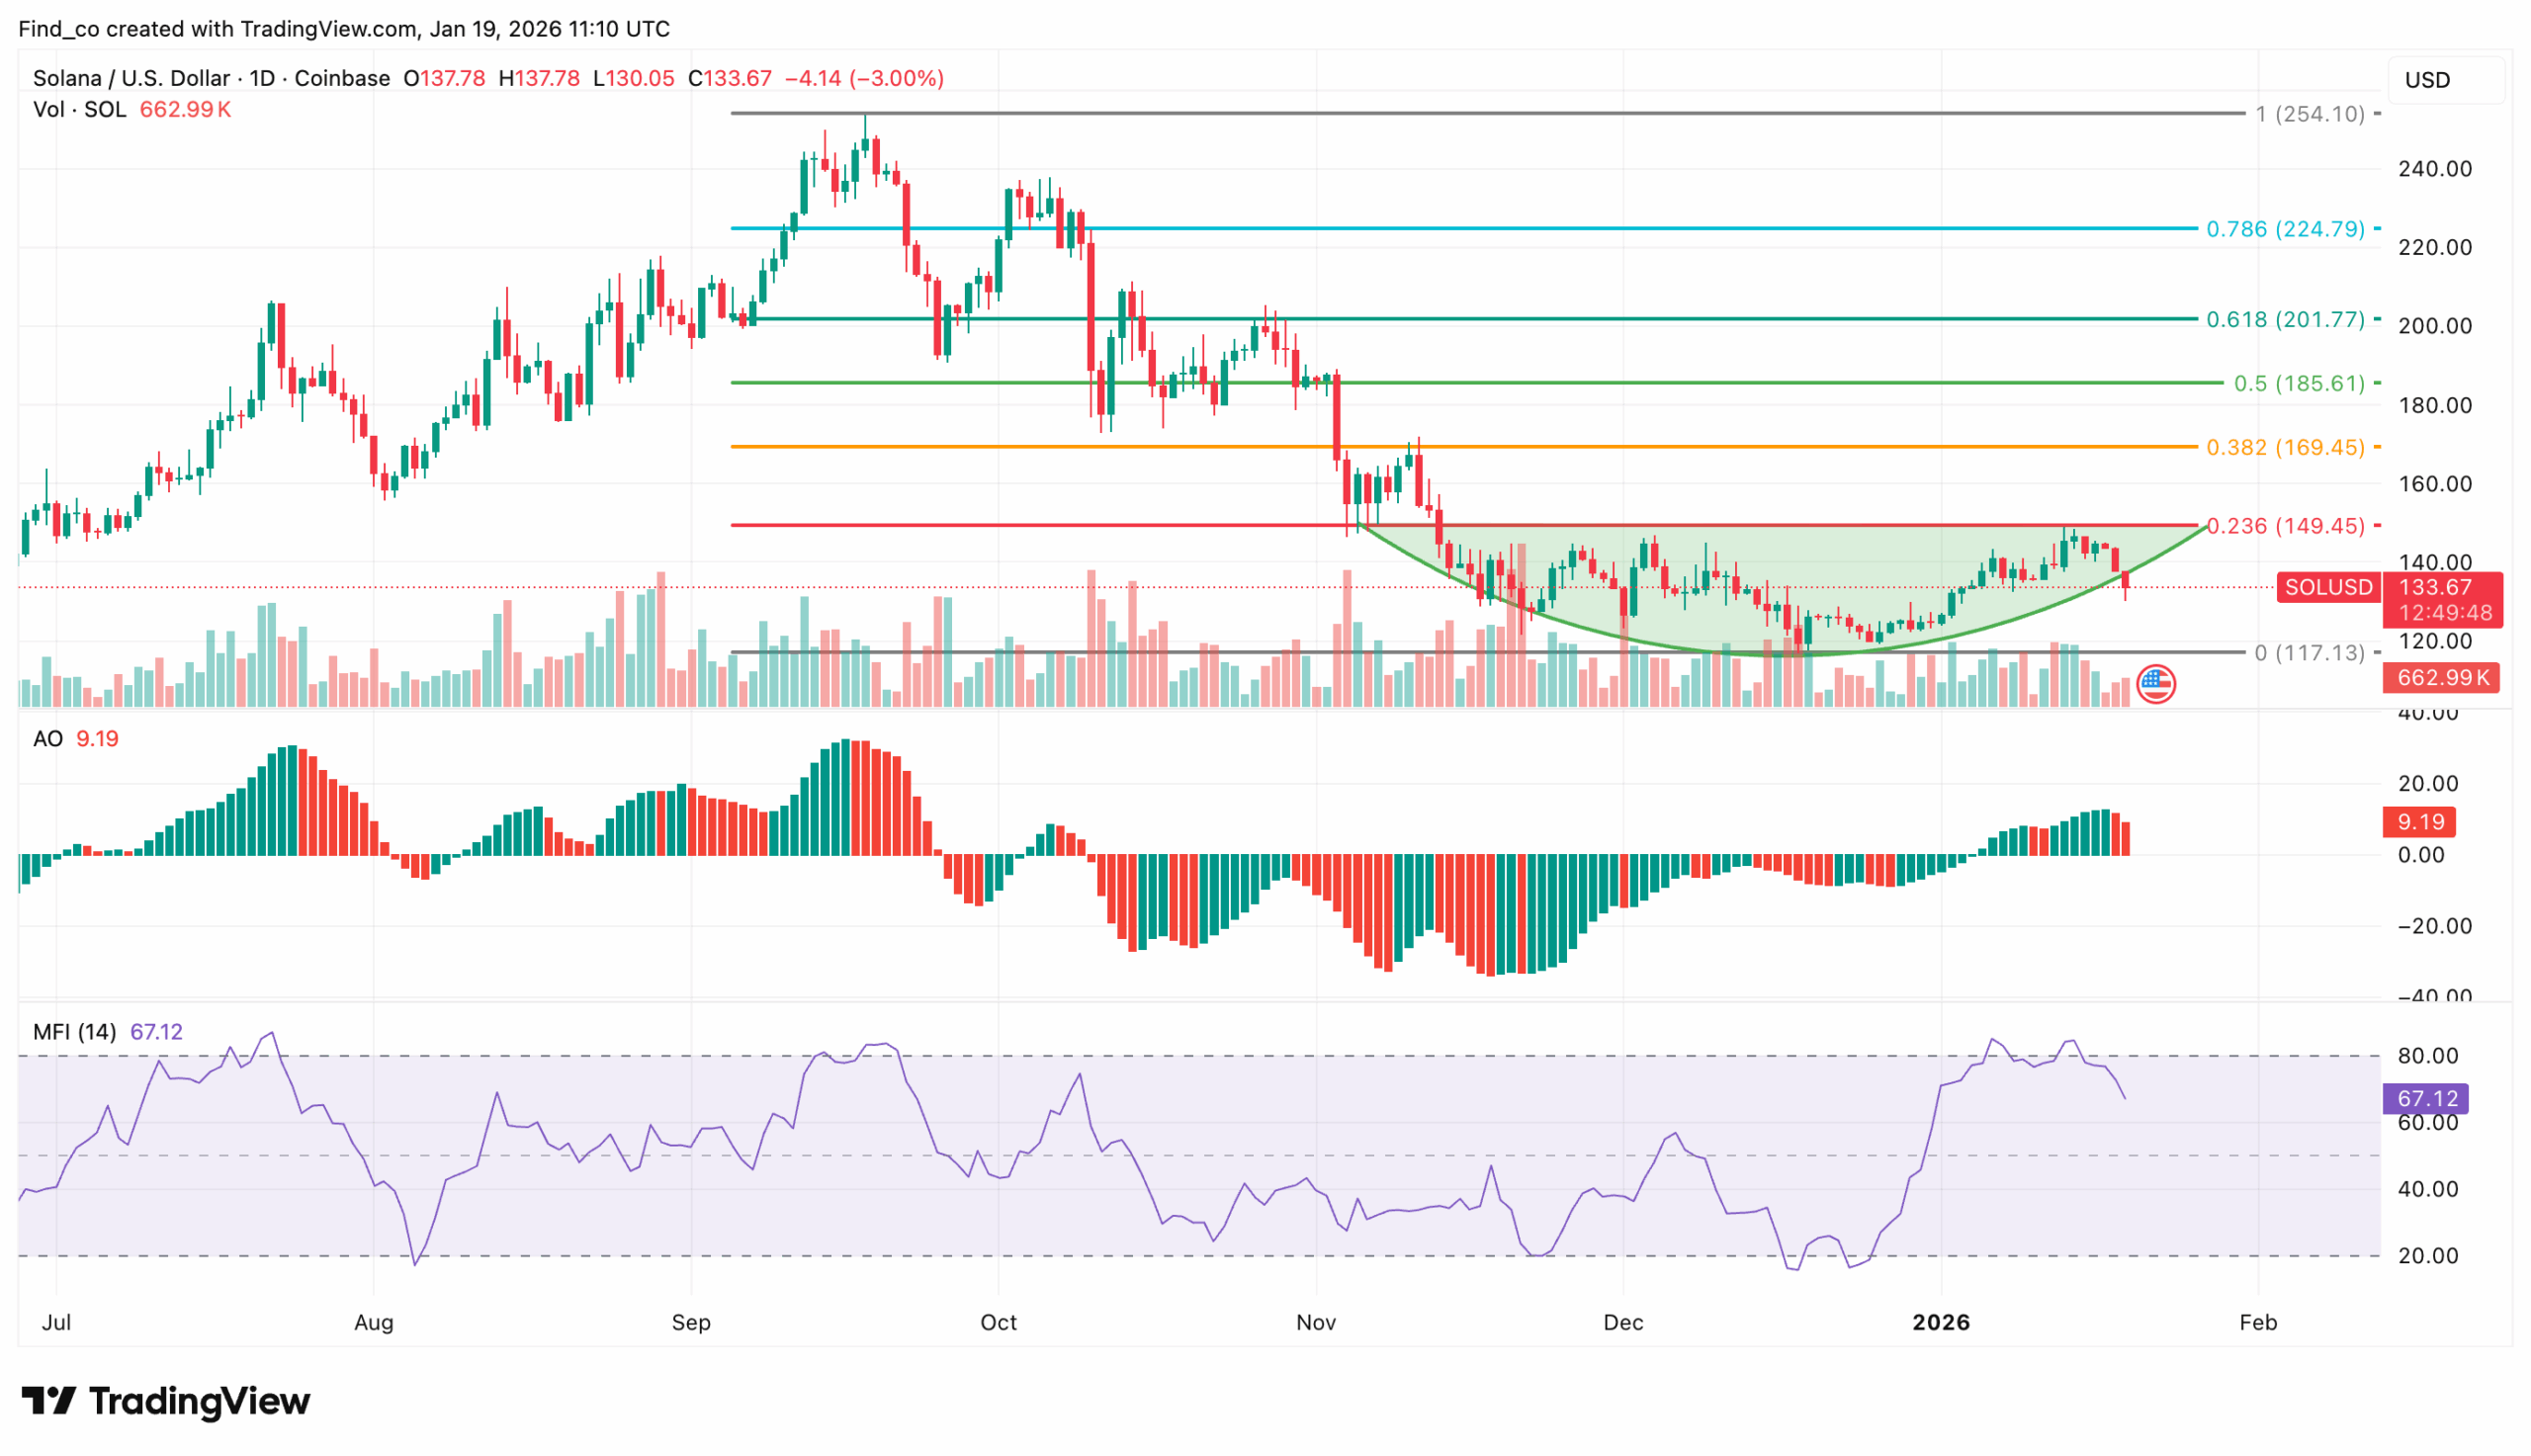
On the daily chart, SOL has reversed its bullish setup. As of this writing, the altcoin has slipped back below its support range after failing to hold above a key resistance zone.
The Awesome Oscillator (AO), which recently printed green histogram bars, has flipped red while remaining in positive territory.
This position signals early weakness in bullish momentum and a potential shift in short-term market control.
This change is further echoed by the Money Flow Index (MFI). After pushing into overbought territory, the MFI has turned lower and now trades around 67.46, pointing to easing capital inflows and fading buying pressure.
While the reading does not yet reflect extreme weakness, the rollover reinforces the broader momentum slowdown visible across the daily timeframe.
Fibonacci retracement levels offer clearer insight into Solana’s price action. After failing to break above its key resistance, SOL trades near $133.67, holding within the $130 to $133 range.
A sustained pullback would likely pressure SOL’s price toward $125 before a potential retest of the zero Fibonacci level at $117.13.
In a bullish scenario, Solana’s price would need to break past its resistance zone at $149.45. To validate this, substantial buying volume has to accompany the altcoin.
Disclaimer:
The information provided in this article is for informational purposes only. It is not intended to be, nor should it be construed as, financial advice. We do not make any warranties regarding the completeness, reliability, or accuracy of this information. All investments involve risk, and past performance does not guarantee future results. We recommend consulting a financial advisor before making any investment decisions.
Victor Olanrewaju is a crypto analyst and reporter at CCN with deep roots in on-chain research and technical analysis. His crypto journey began in 2017, but it was the 2020 Uniswap airdrop that sparked a full-time pivot into the space.
With a foundation in copywriting, Victor honed his craft creating high-converting content for leading crypto brokers — most notably an XRP price prediction that ranked #1 on Google during the 2021 bull run.
He later joined AMBCrypto in 2022, where he combined storytelling with technical and on-chain analysis to cover key market narratives.
In 2024, he expanded his expertise at BeInCrypto, collaborating with analysts and using tools like Glassnode, Santiment, and IntoTheBlock to break down Bitcoin and altcoin trends.
At CCN, Victor covers the top cryptocurrencies, memecoins, macro shifts, blending real-time insights with deep-dive metrics.
He holds a Bachelor’s degree in Physics from the University of Ibadan, equipping him to simplify complex data for a wide audience. Follow his work or connect on LinkedIn or X.