ZEC is trapped in a bearish continuation pattern | Credit: Hameem Sarwar
Share
Key Takeaways
ZEC is in a deeper correction, with rebounds acting like relief bounces.
Bearish momentum dominates, and $380 to $400 now caps recovery attempts.
If $335 breaks, the price is likely to target the $300 psychological support level.
Zcash (ZEC) has extended its corrective phase after dropping more than 12% over the past week.
The move has pushed ZEC’s price back into a higher-risk zone. Therefore, what looked like a routine pullback into a clearer bearish continuation.
Momentum and structure both lean lower. At the time of writing, ZEC is now trading well below its prior consolidation range, and buyers have not shown consistent dip-buying strength.
As a result, each rebound attempt looks more like a minor bounce than a reversal, while downside pressure keeps building.
If sellers maintain control and ZEC fails to reclaim key levels quickly, the market will likely target the $300 psychological level as the next significant level.
Zcash Resistance Hold Recovery Attempts
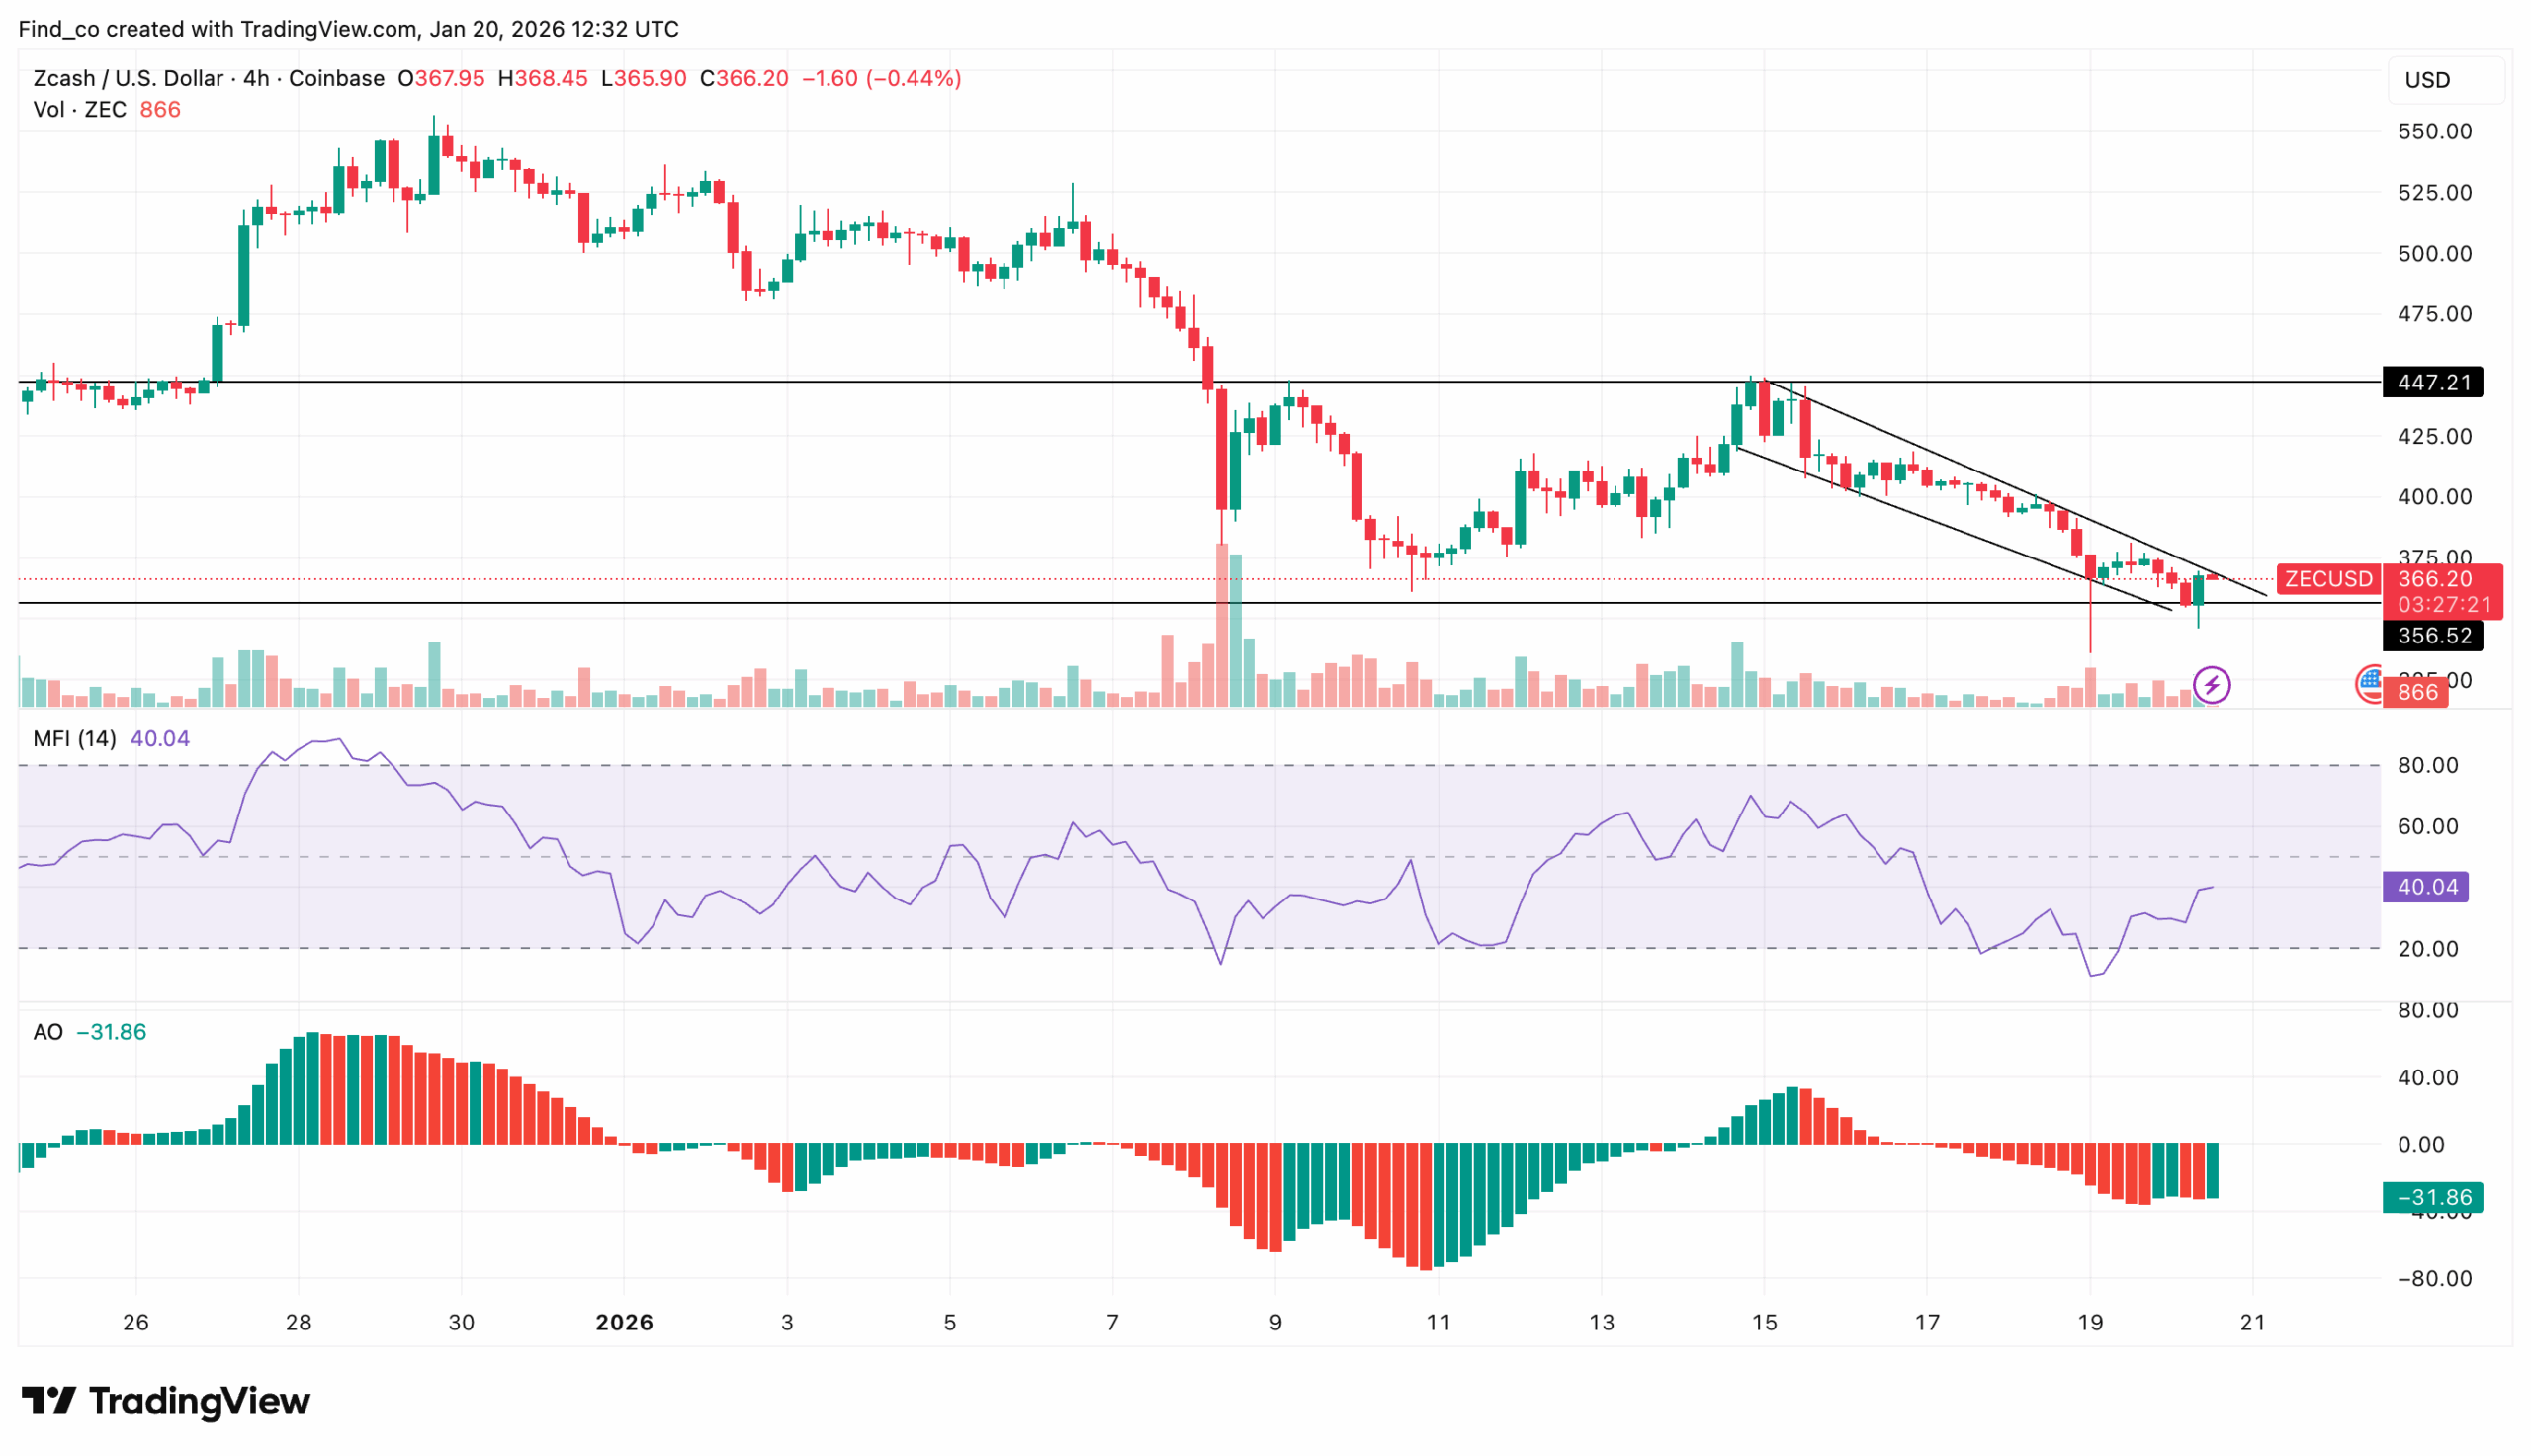
ZEC continues on its bearish path, and the Money Flow Index (MFI) shows a steady outflow of capital from the asset.
On the 4-hour chart, the MFI stands at 27.11, confirming persistent capital outflows and signaling that ZEC’s price is approaching oversold territory.
While oversold readings can sometimes precede a short-term bounce, the lack of substantial volume suggests that dip buyers remain primarily on the sidelines.
From a momentum perspective, the Awesome Oscillator (AO) sits deep in negative territory at -33.57, with expanding red histogram bars.
This reflects accelerating bearish momentum and reinforces the continuation of the downtrend rather than a reversal.
Structurally, ZEC’s price has broken below its prior consolidation range and now trades beneath former support, which has flipped into resistance around the $380 to $400 region.
This zone acts as a supply ceiling, rejecting every recovery attempt. In support of this thesis, pseudonymous crypto trader “Broke Doome” mentioned that the Zcash price correction might not be over.
“ZEC is pressing lower bound of this descending channel on daily. Price is sitting around 360 zone which lines up with prior demand and 200 EMA area and this is the point where sellers usually slow down. If this support holds a relief move back toward upper trendline around 500 plus is very much in play but if it breaks clean then i am expecting more downside,” The trader noted.
A sustained breakdown below $335 would open the path toward $300, with limited historical demand until that level. If selling pressure intensifies, ZEC’s price could even wick into a deeper liquidity pocket.
ZEC Price Analysis
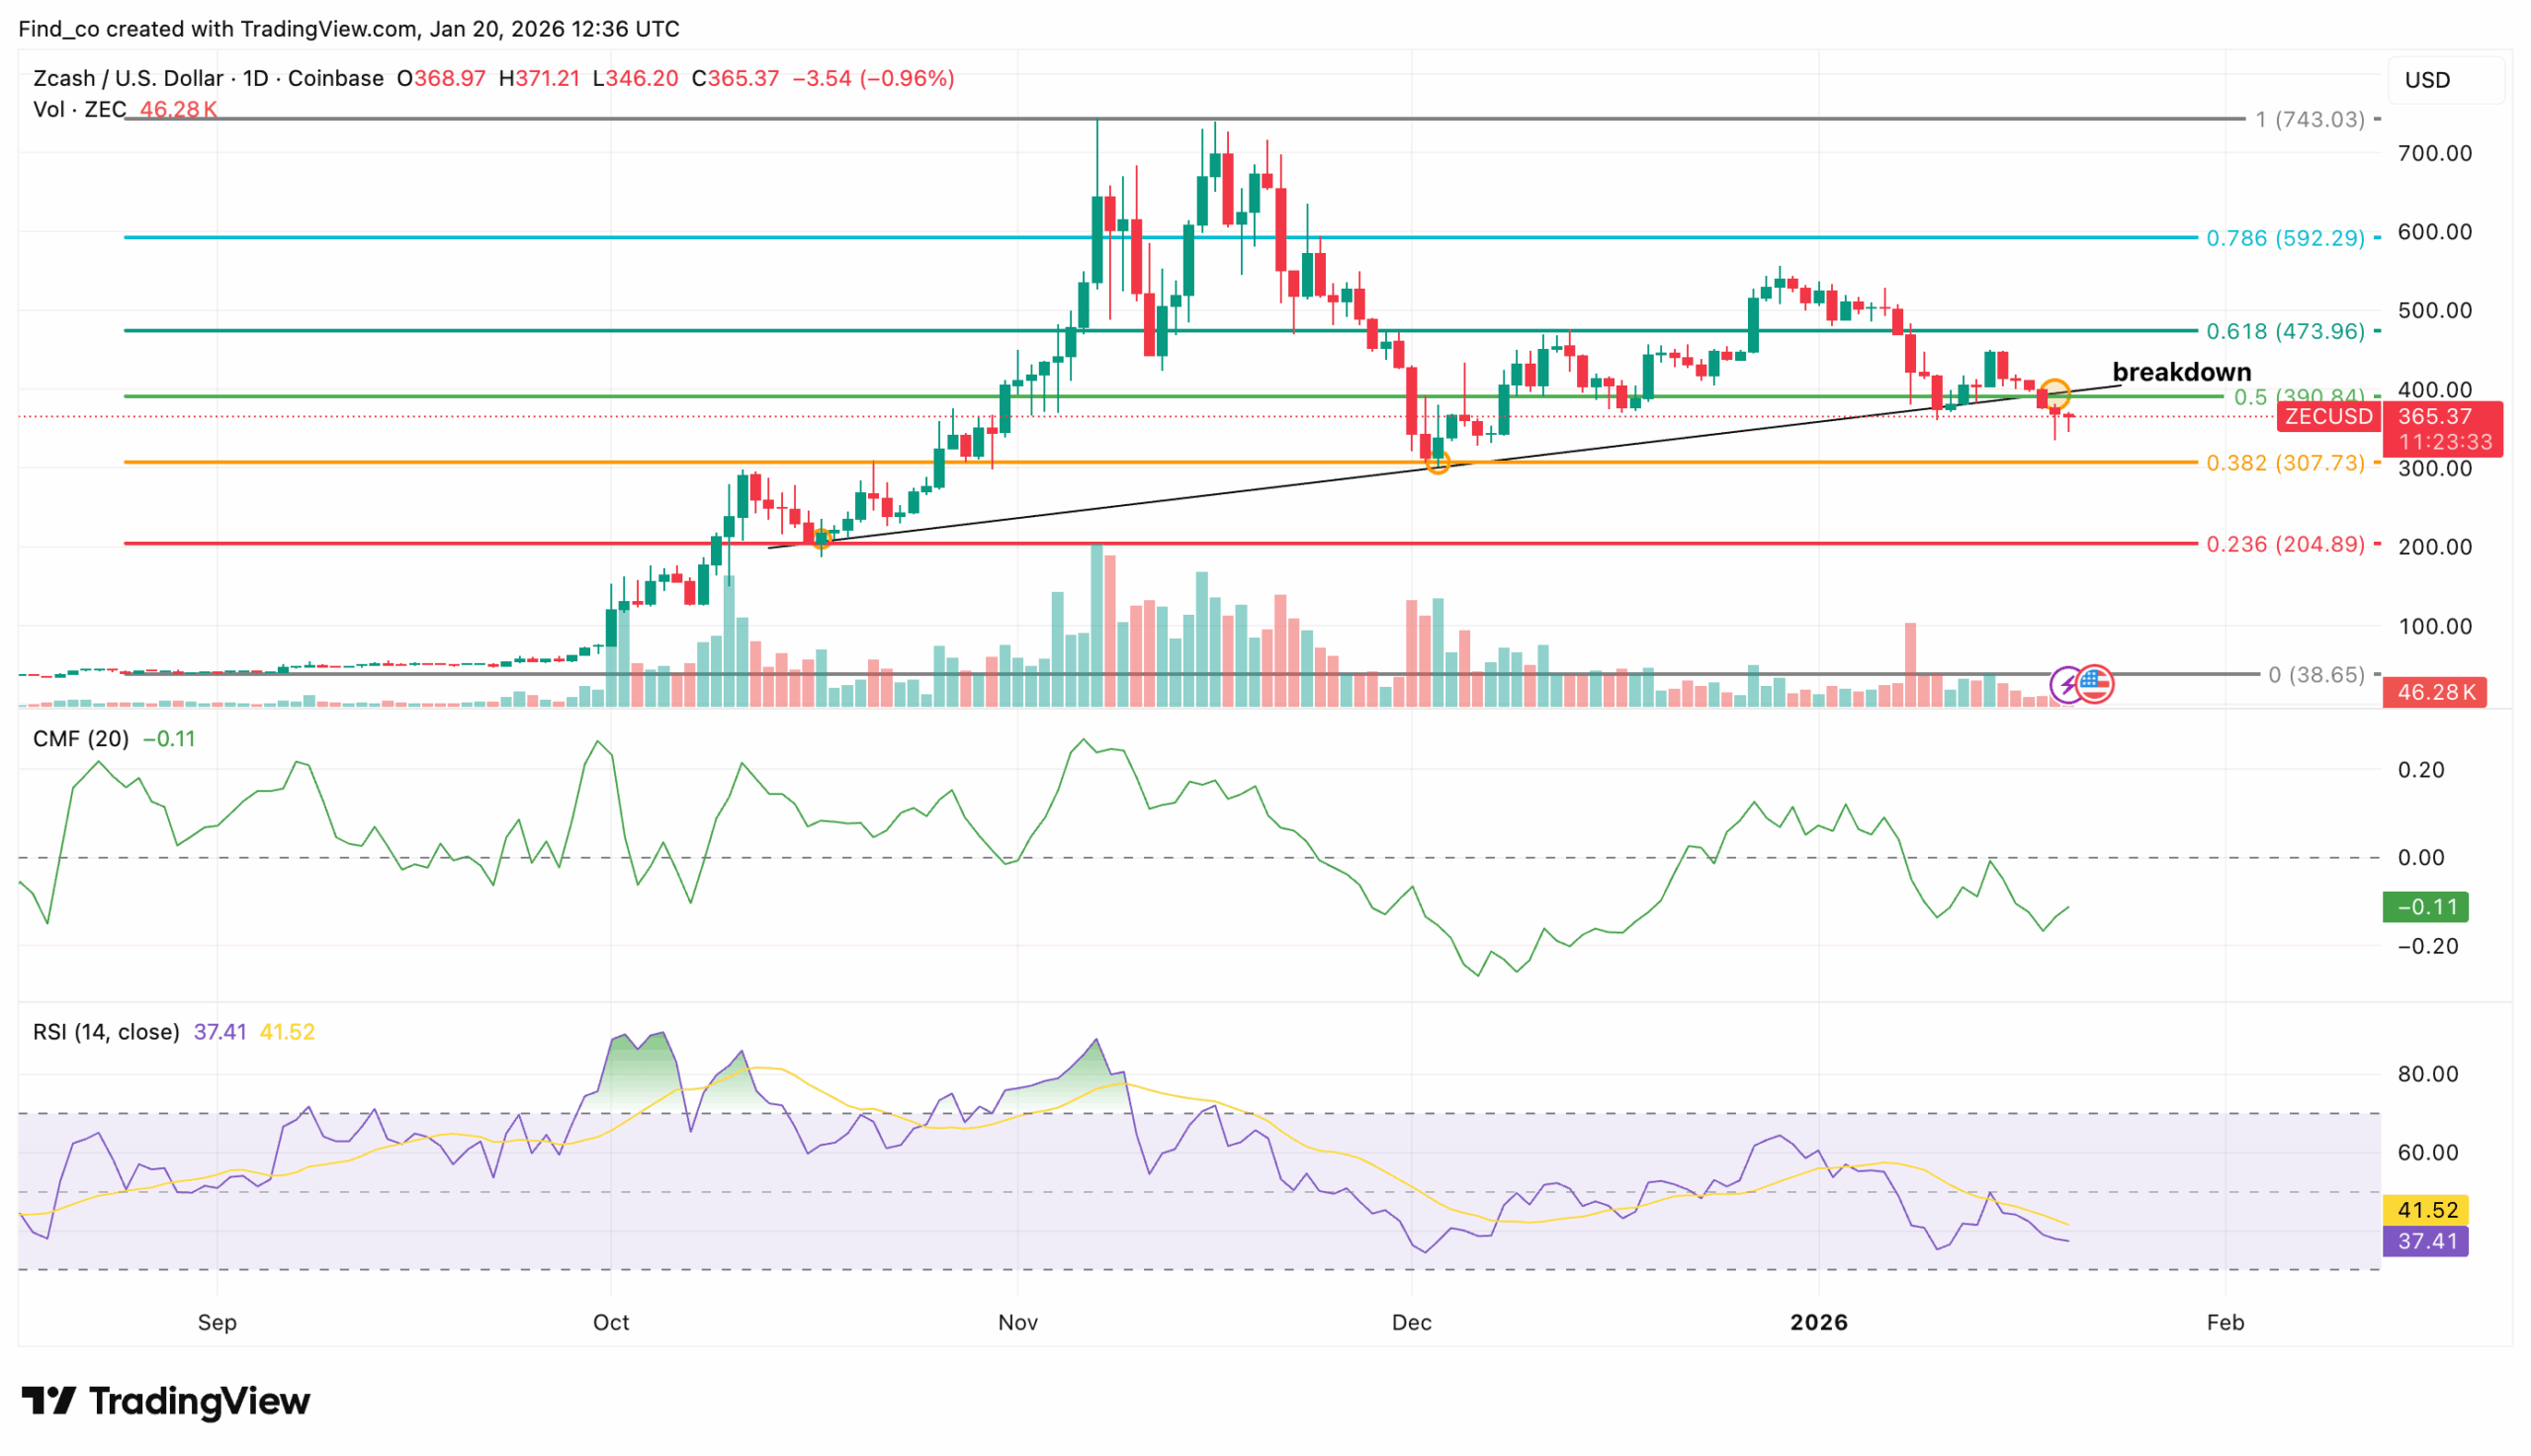
On the daily chart, ZEC is trending downwards, consistently forming lower highs and lower lows. The Chaikin Money Flow (CMF) remains in negative territory, suggesting continued selling pressure as capital flows out of the asset.
This aligns with weak price action, showing that bearish momentum still dominates.
Additionally, the Relative Strength Index (RSI) is approaching oversold territory, suggesting growing bearish exhaustion and a potential short-term bounce.
The Fibonacci retracement levels provide further insight into ZEC’s price. Trading at $359.55, ZEC’s price appears to be moving toward the 0.382 Fib level at $307.73, which could act as the first significant support zone.
If this level fails, the next key support lies near $204.89.
On the other hand, if ZEC’s price pushes above $473.96, it could signal a potential trend reversal. If attained, this could drive buying volume higher, possibly challenging the near-term bearish narrative.
Furthermore, that bearish path weakens if bulls can force a swift recovery, reclaim broken resistance, and flip it back into support.
To hit these levels, another crypto trader mentioned that the Zcash price has to retest $400.
“Here is the latest chart for Zcash. For bullish reversal, we need break the resistance at 368, 378 and ultimately 400. For bearish case, we need to break below 358, 331,” He mentioned.
Disclaimer:
The information provided in this article is for informational purposes only. It is not intended to be, nor should it be construed as, financial advice. We do not make any warranties regarding the completeness, reliability, or accuracy of this information. All investments involve risk, and past performance does not guarantee future results. We recommend consulting a financial advisor before making any investment decisions.
Victor Olanrewaju is a crypto analyst and reporter at CCN with deep roots in on-chain research and technical analysis. His crypto journey began in 2017, but it was the 2020 Uniswap airdrop that sparked a full-time pivot into the space.
With a foundation in copywriting, Victor honed his craft creating high-converting content for leading crypto brokers — most notably an XRP price prediction that ranked #1 on Google during the 2021 bull run.
He later joined AMBCrypto in 2022, where he combined storytelling with technical and on-chain analysis to cover key market narratives.
In 2024, he expanded his expertise at BeInCrypto, collaborating with analysts and using tools like Glassnode, Santiment, and IntoTheBlock to break down Bitcoin and altcoin trends.
At CCN, Victor covers the top cryptocurrencies, memecoins, macro shifts, blending real-time insights with deep-dive metrics.
He holds a Bachelor’s degree in Physics from the University of Ibadan, equipping him to simplify complex data for a wide audience. Follow his work or connect on LinkedIn or X.