AXS breaks trendline resistance and open interest surges 56% | Credit: Veronica Cestari
Share
Key Takeaways
AXS has flipped short-term momentum bullish after breaking its descending channel.
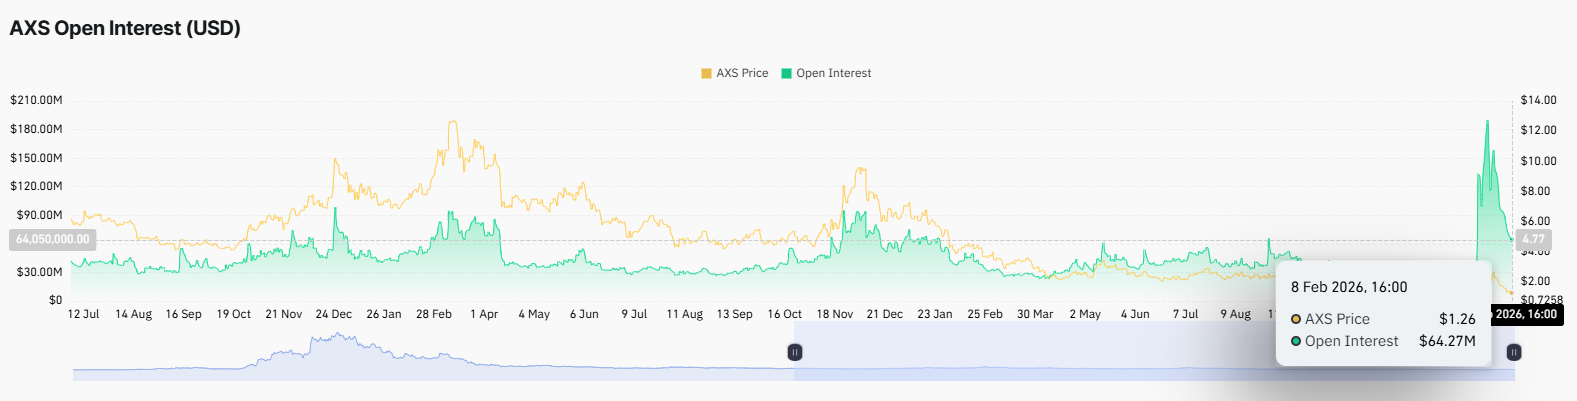
Open Interest jumping, suggesting fresh leverage, but also raises the volatility risk.
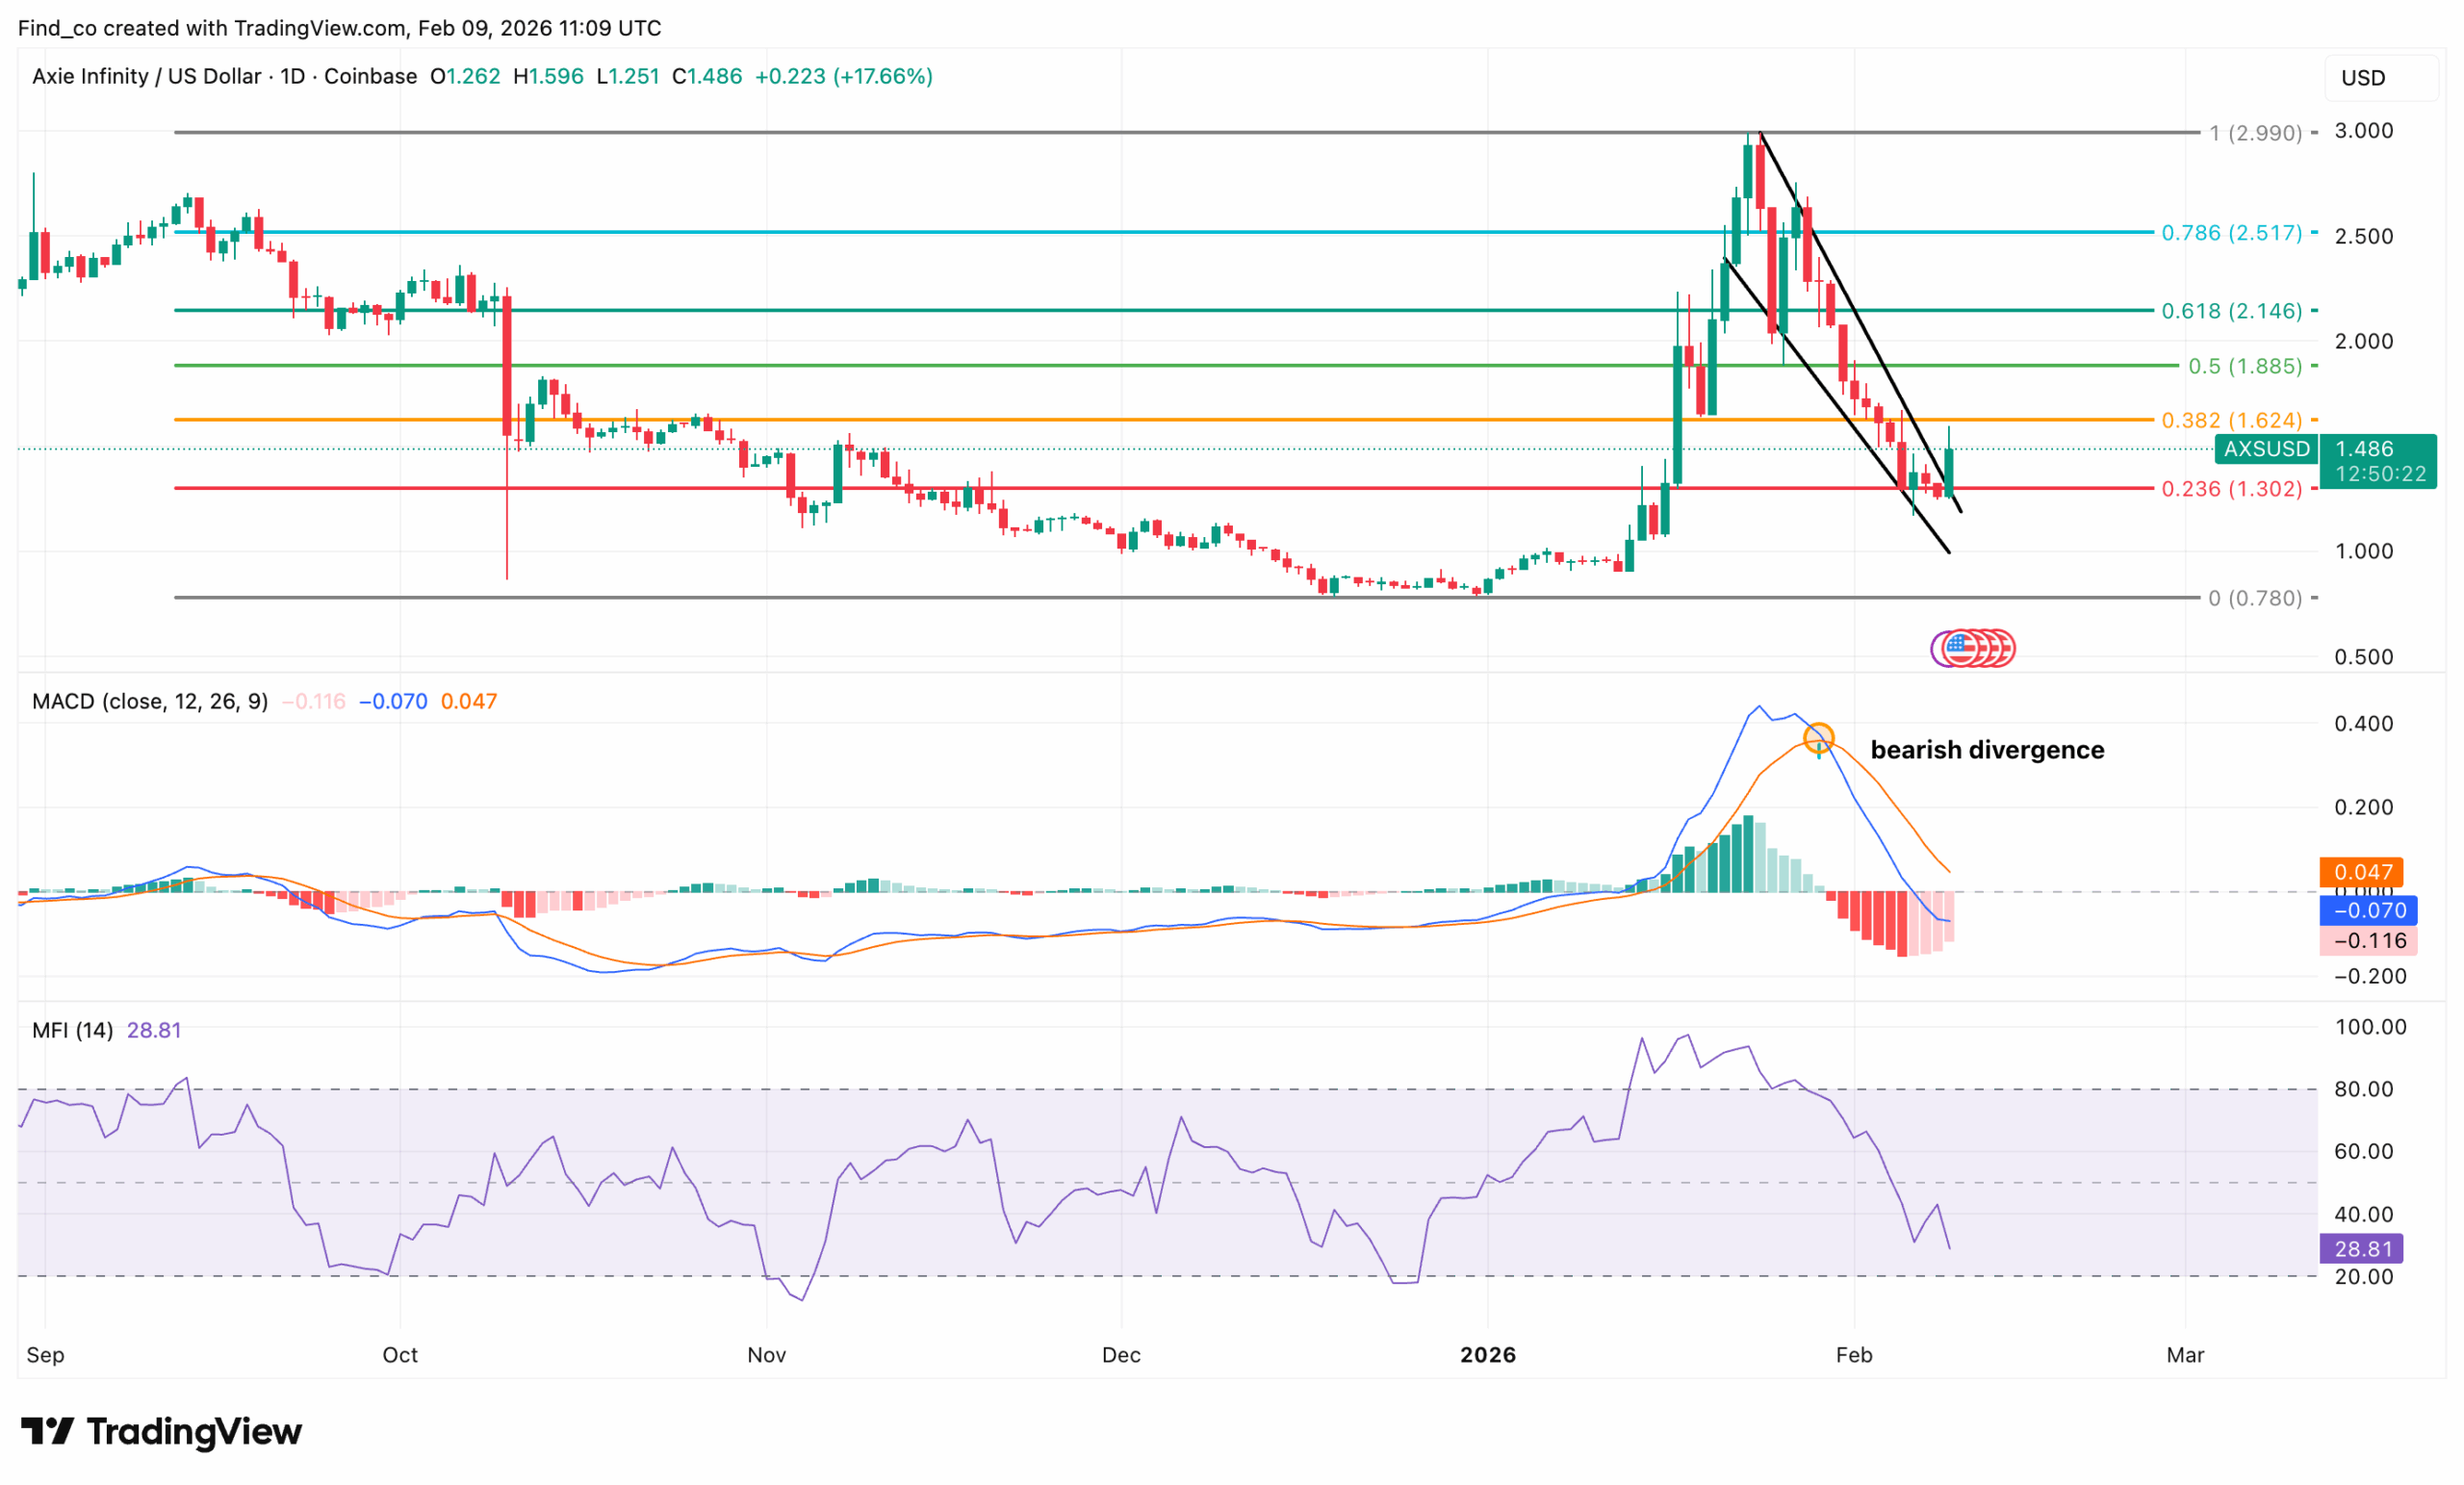
The daily structure still looks like a corrective bounce unless AXS reclaims $1.62.
Unlike last week, AXS, the native token of the Axie Infinity protocol, has snapped back hard.
In the past 24 hours, the AXS price jumped 21%, erasing last week’s losses in the process.
Still, it seems that the real test has just begun. In this analysis, CCN evaluates whether this recovery is a new leg of a bull run or just a fast relief bounce that will eventually fade.
Let’s find out.
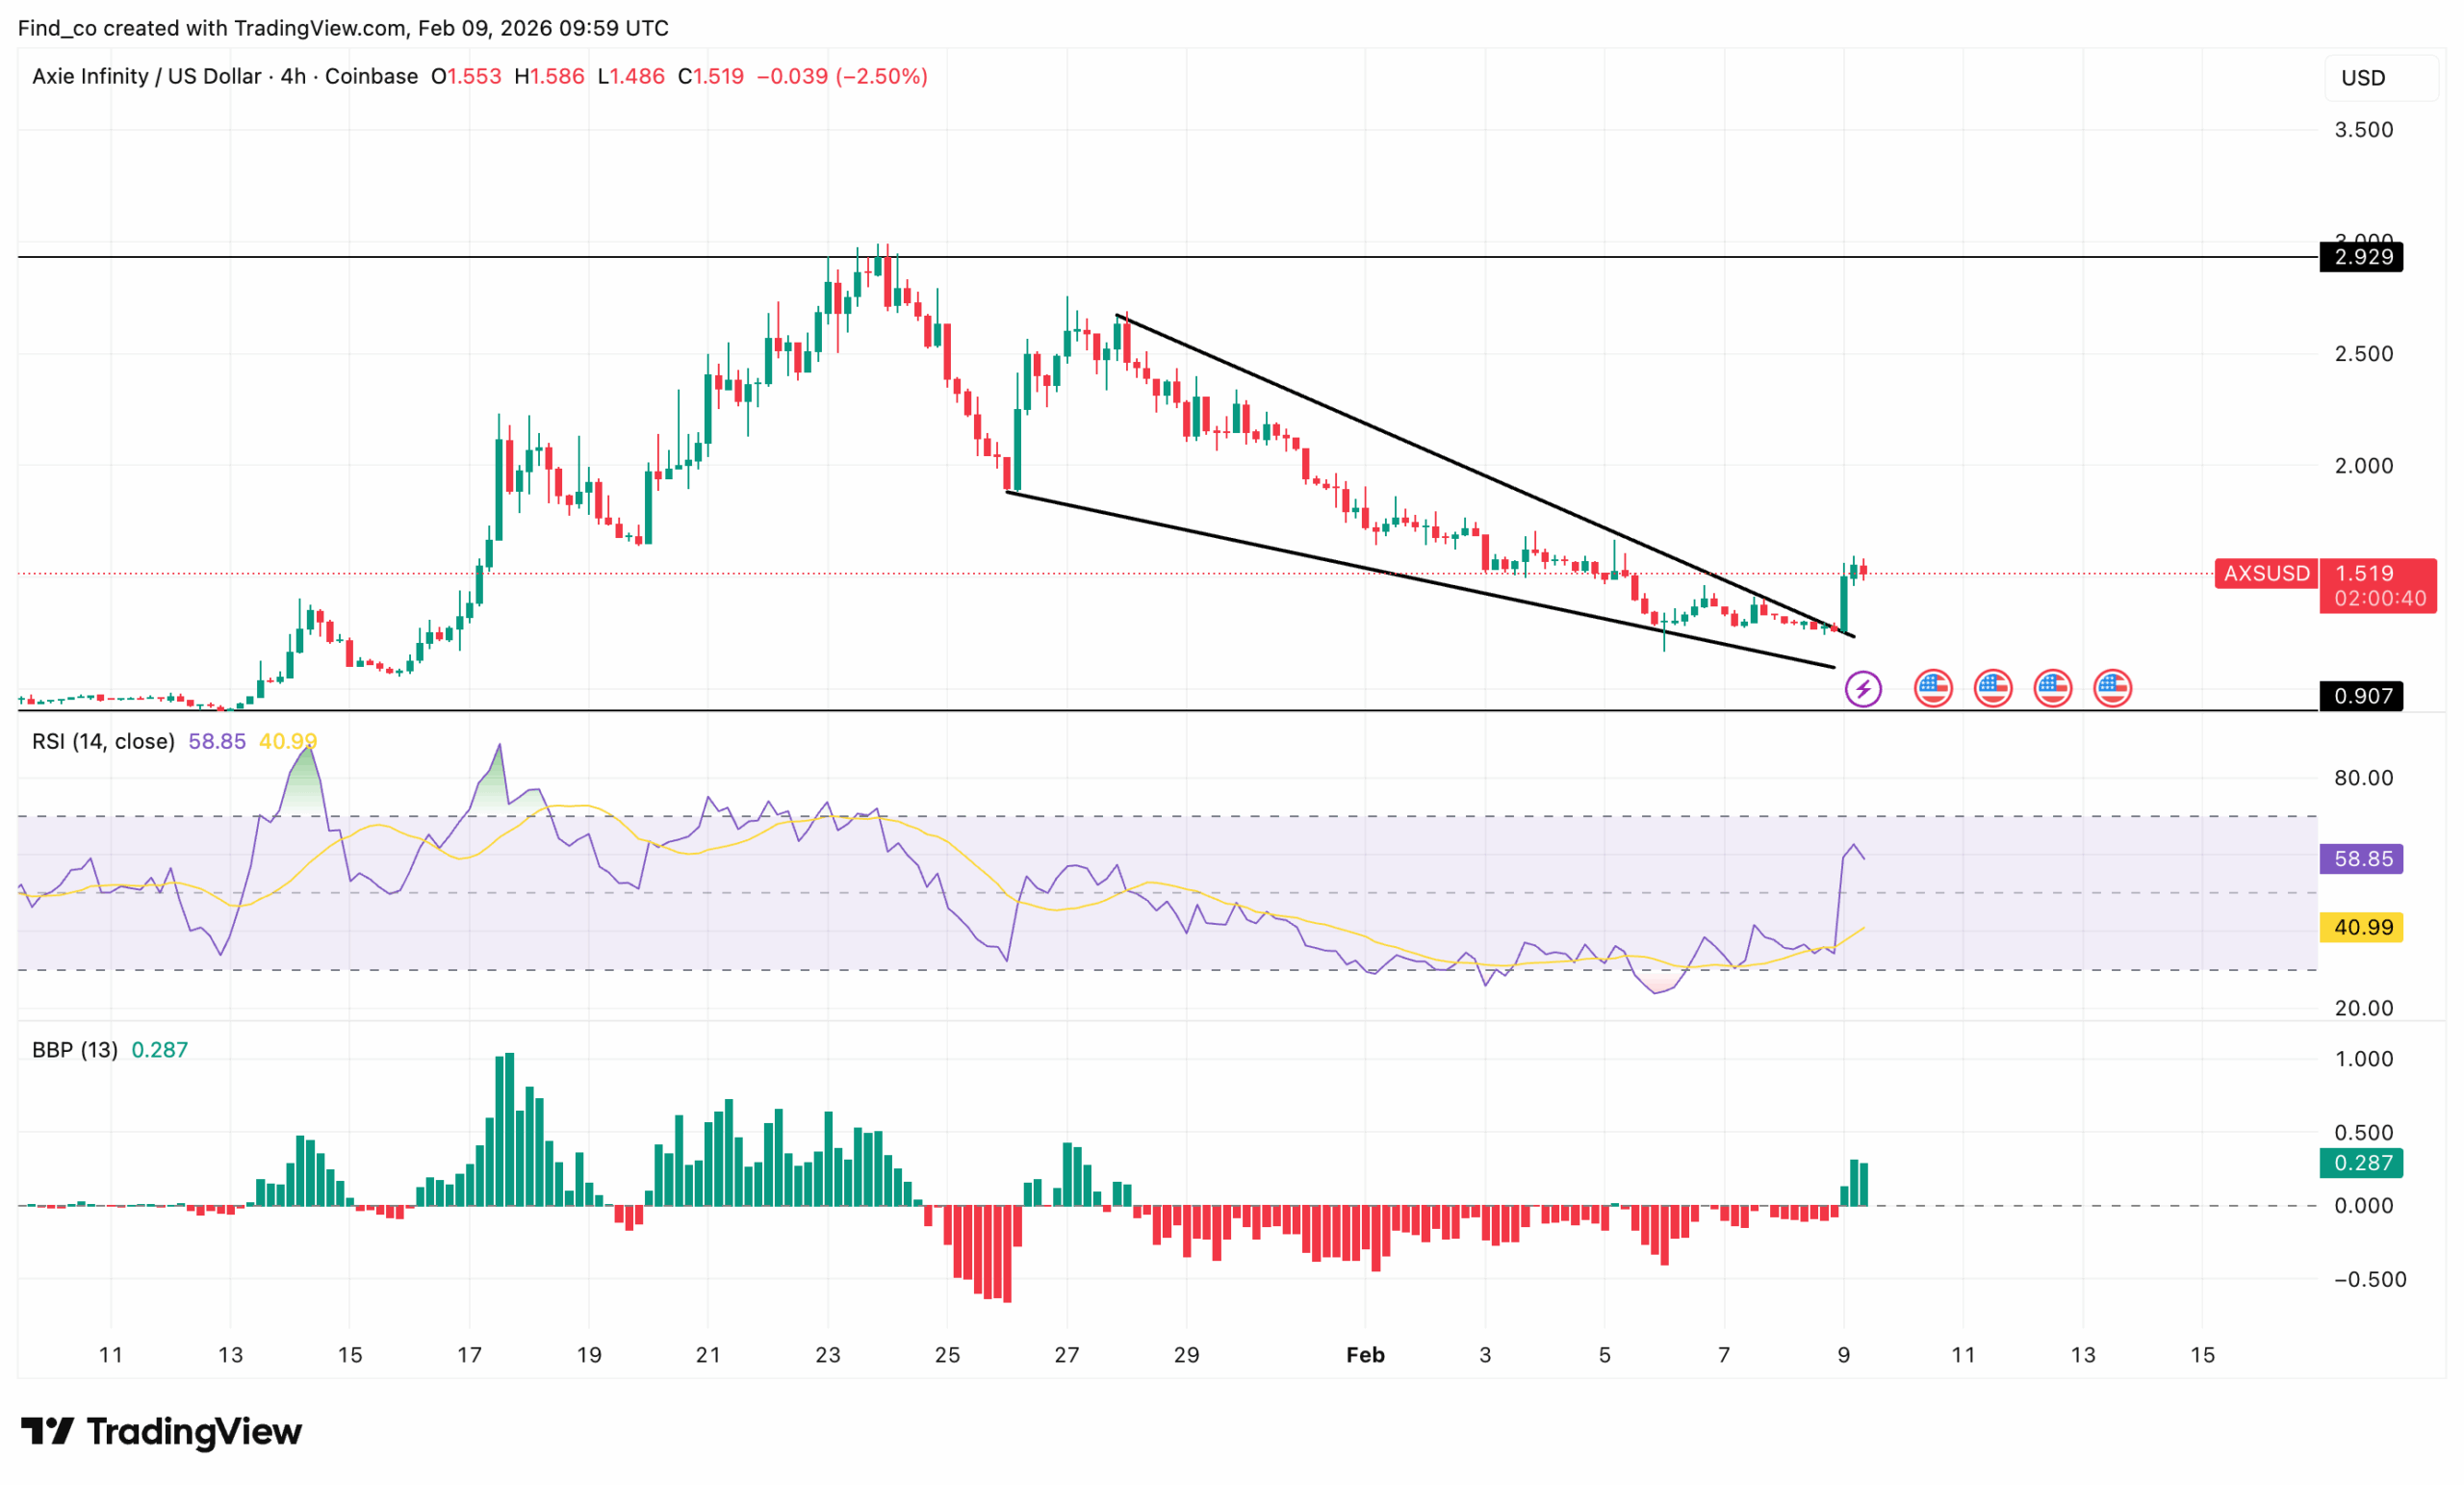
AXS Breaks Descending Channel
On the 4-hour chart, the Relative Strength Index (RSI) has jumped to 62.4, breaking out of its prior bearish compression.
In the process, the indicator has reclaimed bullish territory.
This position shows strengthening demand and rising momentum, with AXS price now approaching the overbought threshold.
While this level can trigger short-term consolidation, it also supports a trend reversal when accompanied by strong volume.
Momentum indicators reinforce this shift. For example, the Awesome Oscillator (AO) has turned positive, currently printing 0.31, with expanding green histogram bars above the zero line.
This change reflects a clear shift from bearish to bullish momentum, suggesting buyers are regaining control after weeks of distribution.
Furthermore, the AXS price has broken above the descending channel that defined its recent corrective phase.
This breakout invalidates the prior lower-high sequence and sets the stage for a potential continuation toward the next resistance near $1.80.
If this trend in OI is sustained alongside steady volume, it could provide the fuel needed to extend the AXS price rally.
However, this also depends on other indicators.
AXS Price Outlook: Recovery Unclear
However, AXS’ daily chart looks like a post-blowoff unwind, not the start of a sustainable trend reversal.
The explosive move into the $3 region was quickly rejected, and the price has since rolled over into a descending channel.
That alone suggests the rally was largely momentum- and liquidity-driven, not supported by durable demand.
The Fibonacci context reinforces this. The AXS price failed to hold above the 0.786 retracement ($2.52) and then lost the 0.618 retracement ($2.15) shortly after.
Once those higher retracement levels flipped into resistance, downside pressure accelerated. Price is now hovering near the 0.236 ($1.30) zone, which often acts as a last bounce area before either consolidation or deeper continuation lower.
The current bounce into $1.48 looks corrective, not impulsive.
Furthermore, the MACD bearish divergence near the top shows that upside momentum was already weakening even as the price pushed higher.
Since then, MACD has firmly crossed into negative territory, while MFI is below 30, suggesting oversold conditions. However, oversold conditions in a downtrend often lead to sideways-to-lower price action.
Structurally, this fits the broader bear-market playbook seen across gaming tokens.
Sharp vertical rallies get sold aggressively into prior supply zones, followed by channelized declines as late buyers exit and early participants distribute.
For AXS price to shift this narrative, it would need to reclaim $1.62 to $1.88 (0.382 to 0.5 zone) and break the descending channel with volume.
Disclaimer:
The information provided in this article is for informational purposes only. It is not intended to be, nor should it be construed as, financial advice. We do not make any warranties regarding the completeness, reliability, or accuracy of this information. All investments involve risk, and past performance does not guarantee future results. We recommend consulting a financial advisor before making any investment decisions.
Victor Olanrewaju is a crypto analyst and reporter at CCN with deep roots in on-chain research and technical analysis. His crypto journey began in 2017, but it was the 2020 Uniswap airdrop that sparked a full-time pivot into the space.
With a foundation in copywriting, Victor honed his craft creating high-converting content for leading crypto brokers — most notably an XRP price prediction that ranked #1 on Google during the 2021 bull run.
He later joined AMBCrypto in 2022, where he combined storytelling with technical and on-chain analysis to cover key market narratives.
In 2024, he expanded his expertise at BeInCrypto, collaborating with analysts and using tools like Glassnode, Santiment, and IntoTheBlock to break down Bitcoin and altcoin trends.
At CCN, Victor covers the top cryptocurrencies, memecoins, macro shifts, blending real-time insights with deep-dive metrics.
He holds a Bachelor’s degree in Physics from the University of Ibadan, equipping him to simplify complex data for a wide audience. Follow his work or connect on LinkedIn or X.