XRP and XLM face a make-or-break zone | Credit: Hameem Sarwar
Share
Key Takeaways
XRP and XLM remain under heavy pressure, trading near $1.58 and $0.20, respectively.
Ripple’s former CTO dismissed the Epstein-linked rumors, yet the prices continued to fall.
Both assets sit at critical support, with downside risk toward $1.50 for XRP and $0.17 for XLM.
XRP and XLM, native to the Stellar blockchain, are both in a tight spot.
Like other cryptocurrencies, the prices of XRP and XLM experienced a severe correction.
Notably, XRP is hovering around $1.58. On the other hand, XLM price is mirroring the same hesitancy at a smaller scale, pinned near $0.18.
Against that backdrop, the broader “Warsh Shock” macro pressure is keeping risk appetite thin, and any additional noise is hitting harder than it normally would.
That’s why Ripple has been forced to address resurfacing rumors linking the firm or early associates to the Jeffrey Epstein network, with ex-CTO David Schwartz publicly pushing back.
Here are all the details and what it could imply for XRP and XLM prices.
Epstein Not Linked to Ripple, Ex-CTO Claims
Over the weekend, crypto prices continued to fall, with XRP not exempted.
That tension has been amplified by an unwelcome distraction for Ripple. Over the Jan. 31–Feb 1 weekend, old rumors resurfaced online attempting to link Ripple or early associates to the Jeffrey Epstein network.
However, Ripple’s former CTO, David Schwartz, moved quickly to shut it down.
Schwartz publicly dismissed the allegations as baseless misinformation, arguing they were being recycled as a form of tribal attack during a period of extreme market stress.
According to CCN’s findings, Epstein discussed XRP and XLM with some personalities.
However, Schwartz noted that the emails were not about supporting the cryptos. Instead, the now-deceased American financer saw them as threats.
“He meant that because he felt Ripple and Stellar were bad for the ecosystem, anyone who supported either XRP or XLM was an opponent/enemy,” Schwartz emphasized.
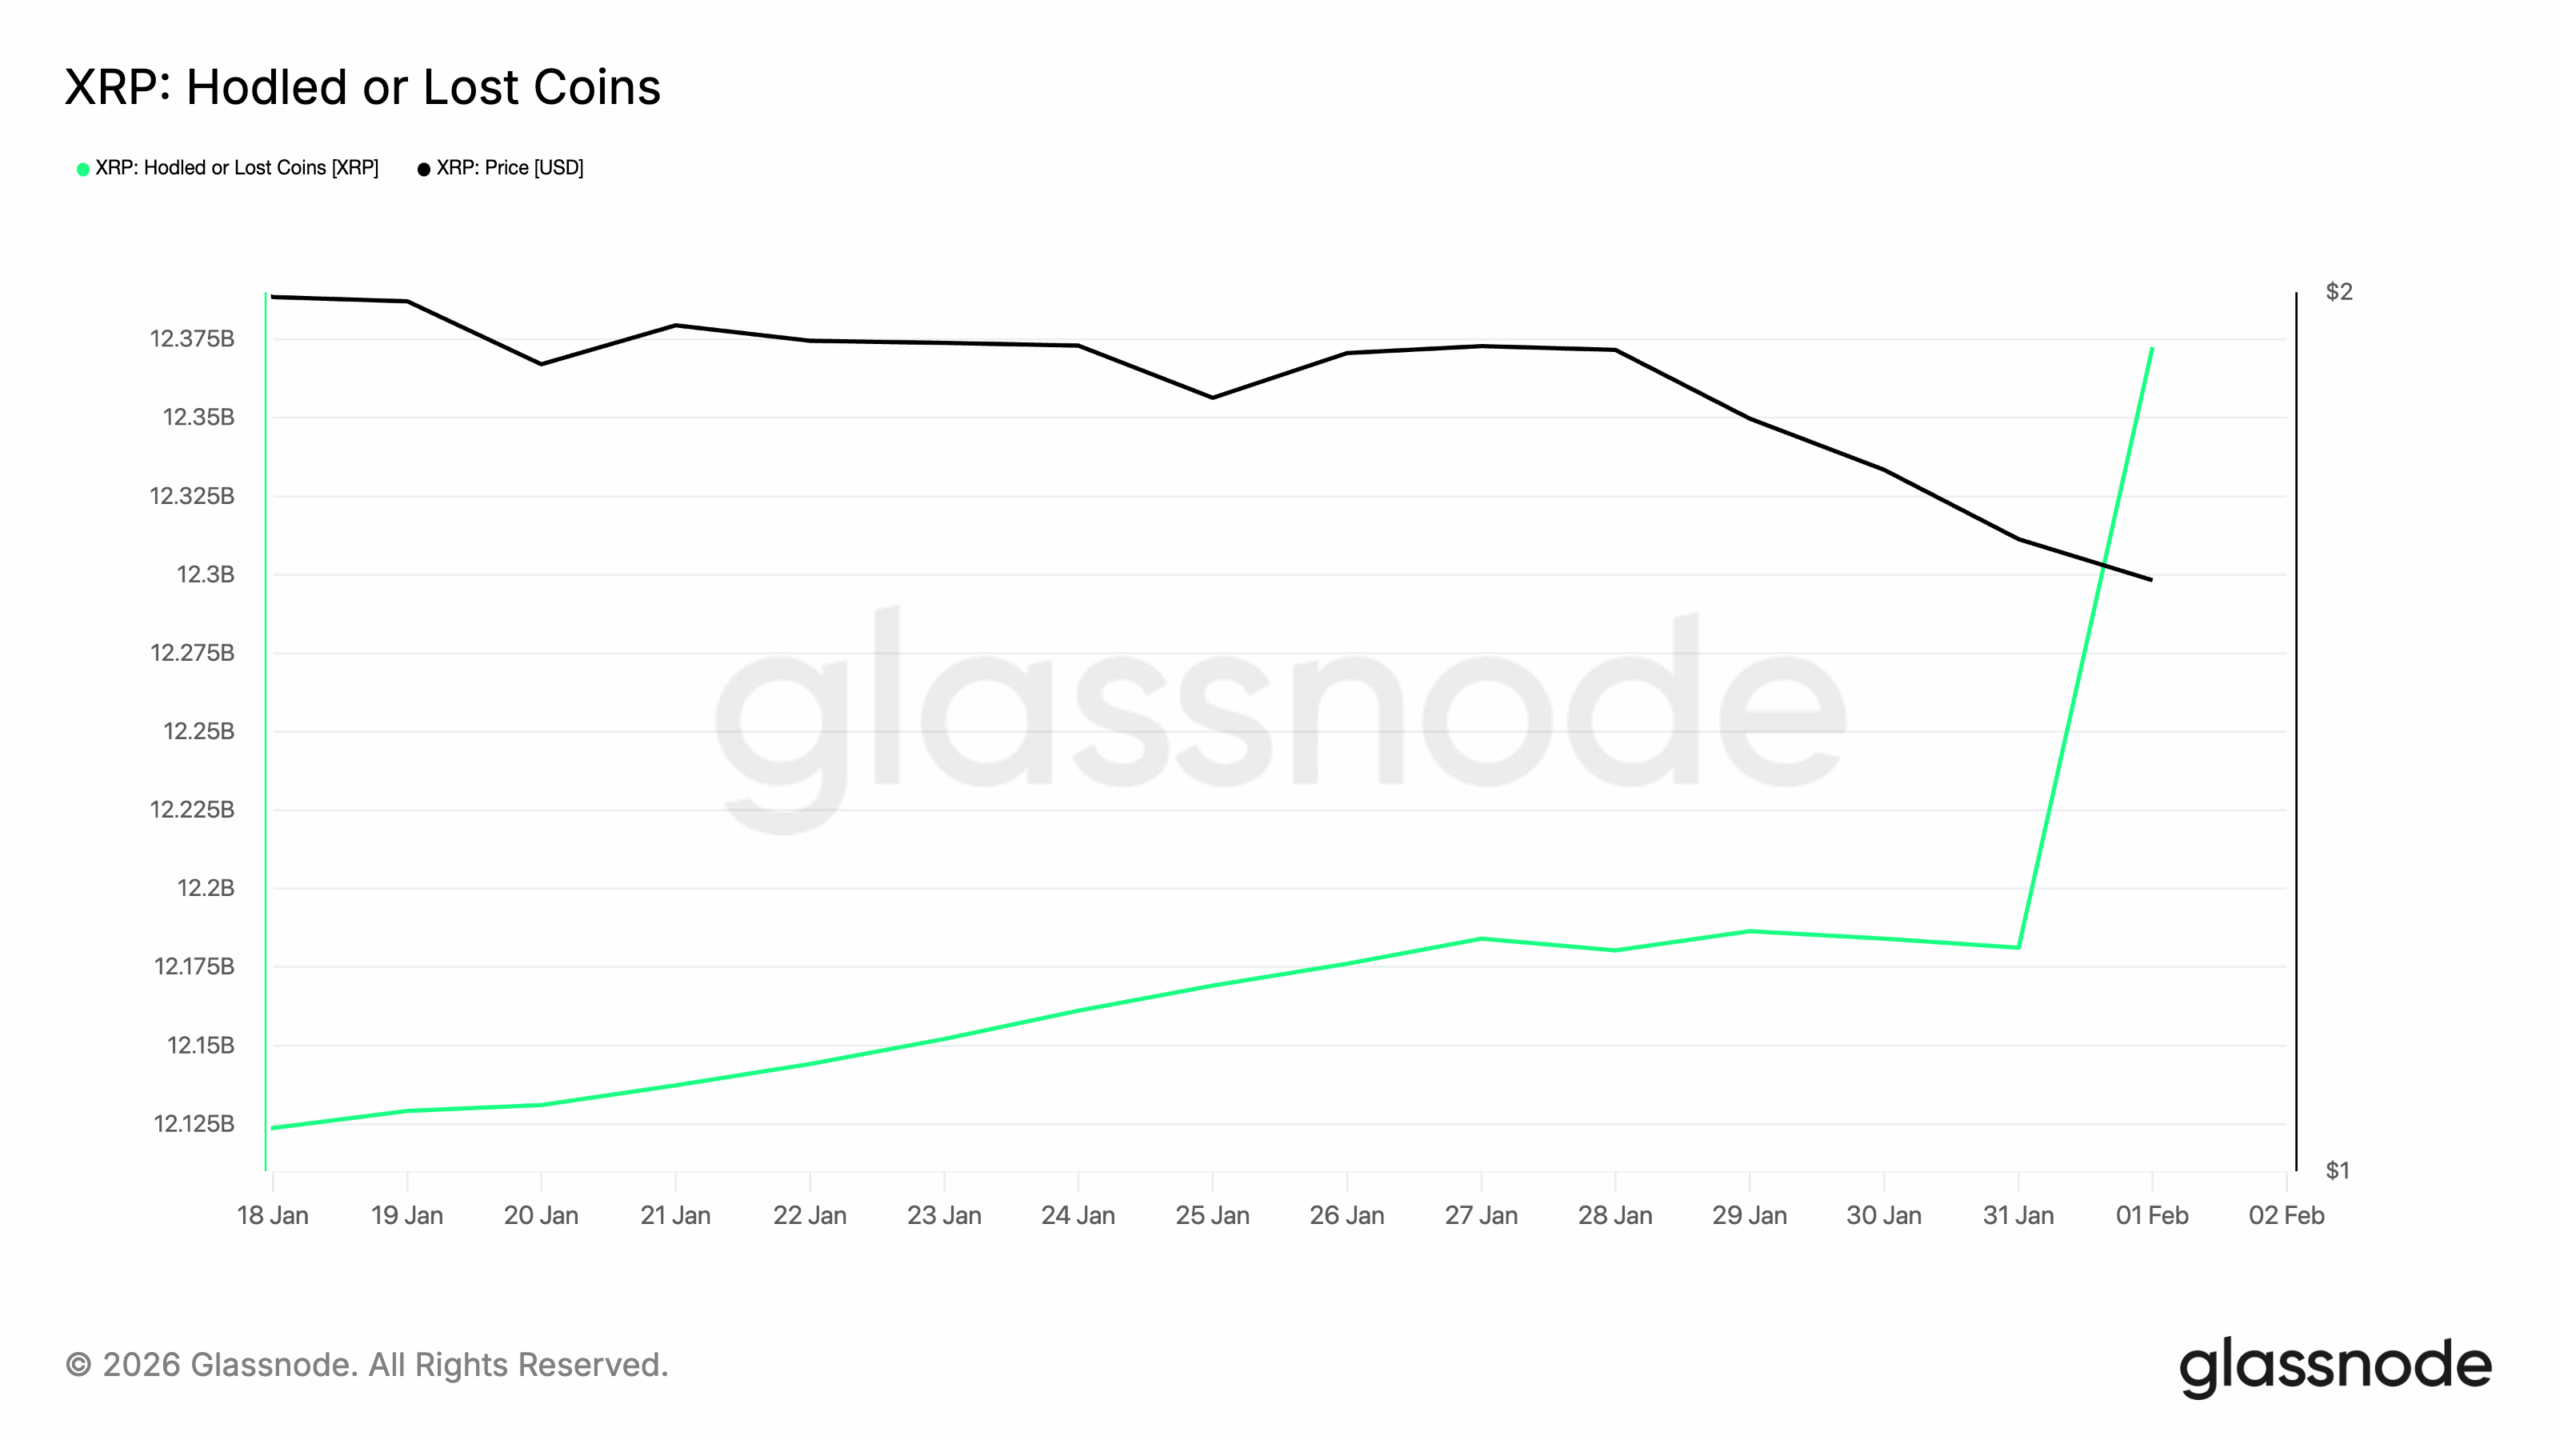
However, from an on-chain perspective, Glassnode data shows a sharp jump in “hodled” or lost coins.
This signals that more XRP is moving into long-term, inactive hands.
At the same time, price is trending lower. As seen below, XRP’s price has slipped below $1.60.
That divergence matters. Historically, when “hodled” supply rises while price falls, it points to distribution exhaustion rather than panic selling.
In other words, the liquid supply is drying up. Fewer coins are available on the market, even as price pulls back.
Still, timing is key. Rising illiquid supply does not guarantee an immediate bounce. In past cycles, XRP’s price has consolidated for weeks after similar spikes before responding.
In this case, it does not seem like XRP’s market value might bounce and retest $2 soon.
XRP Price Outlook
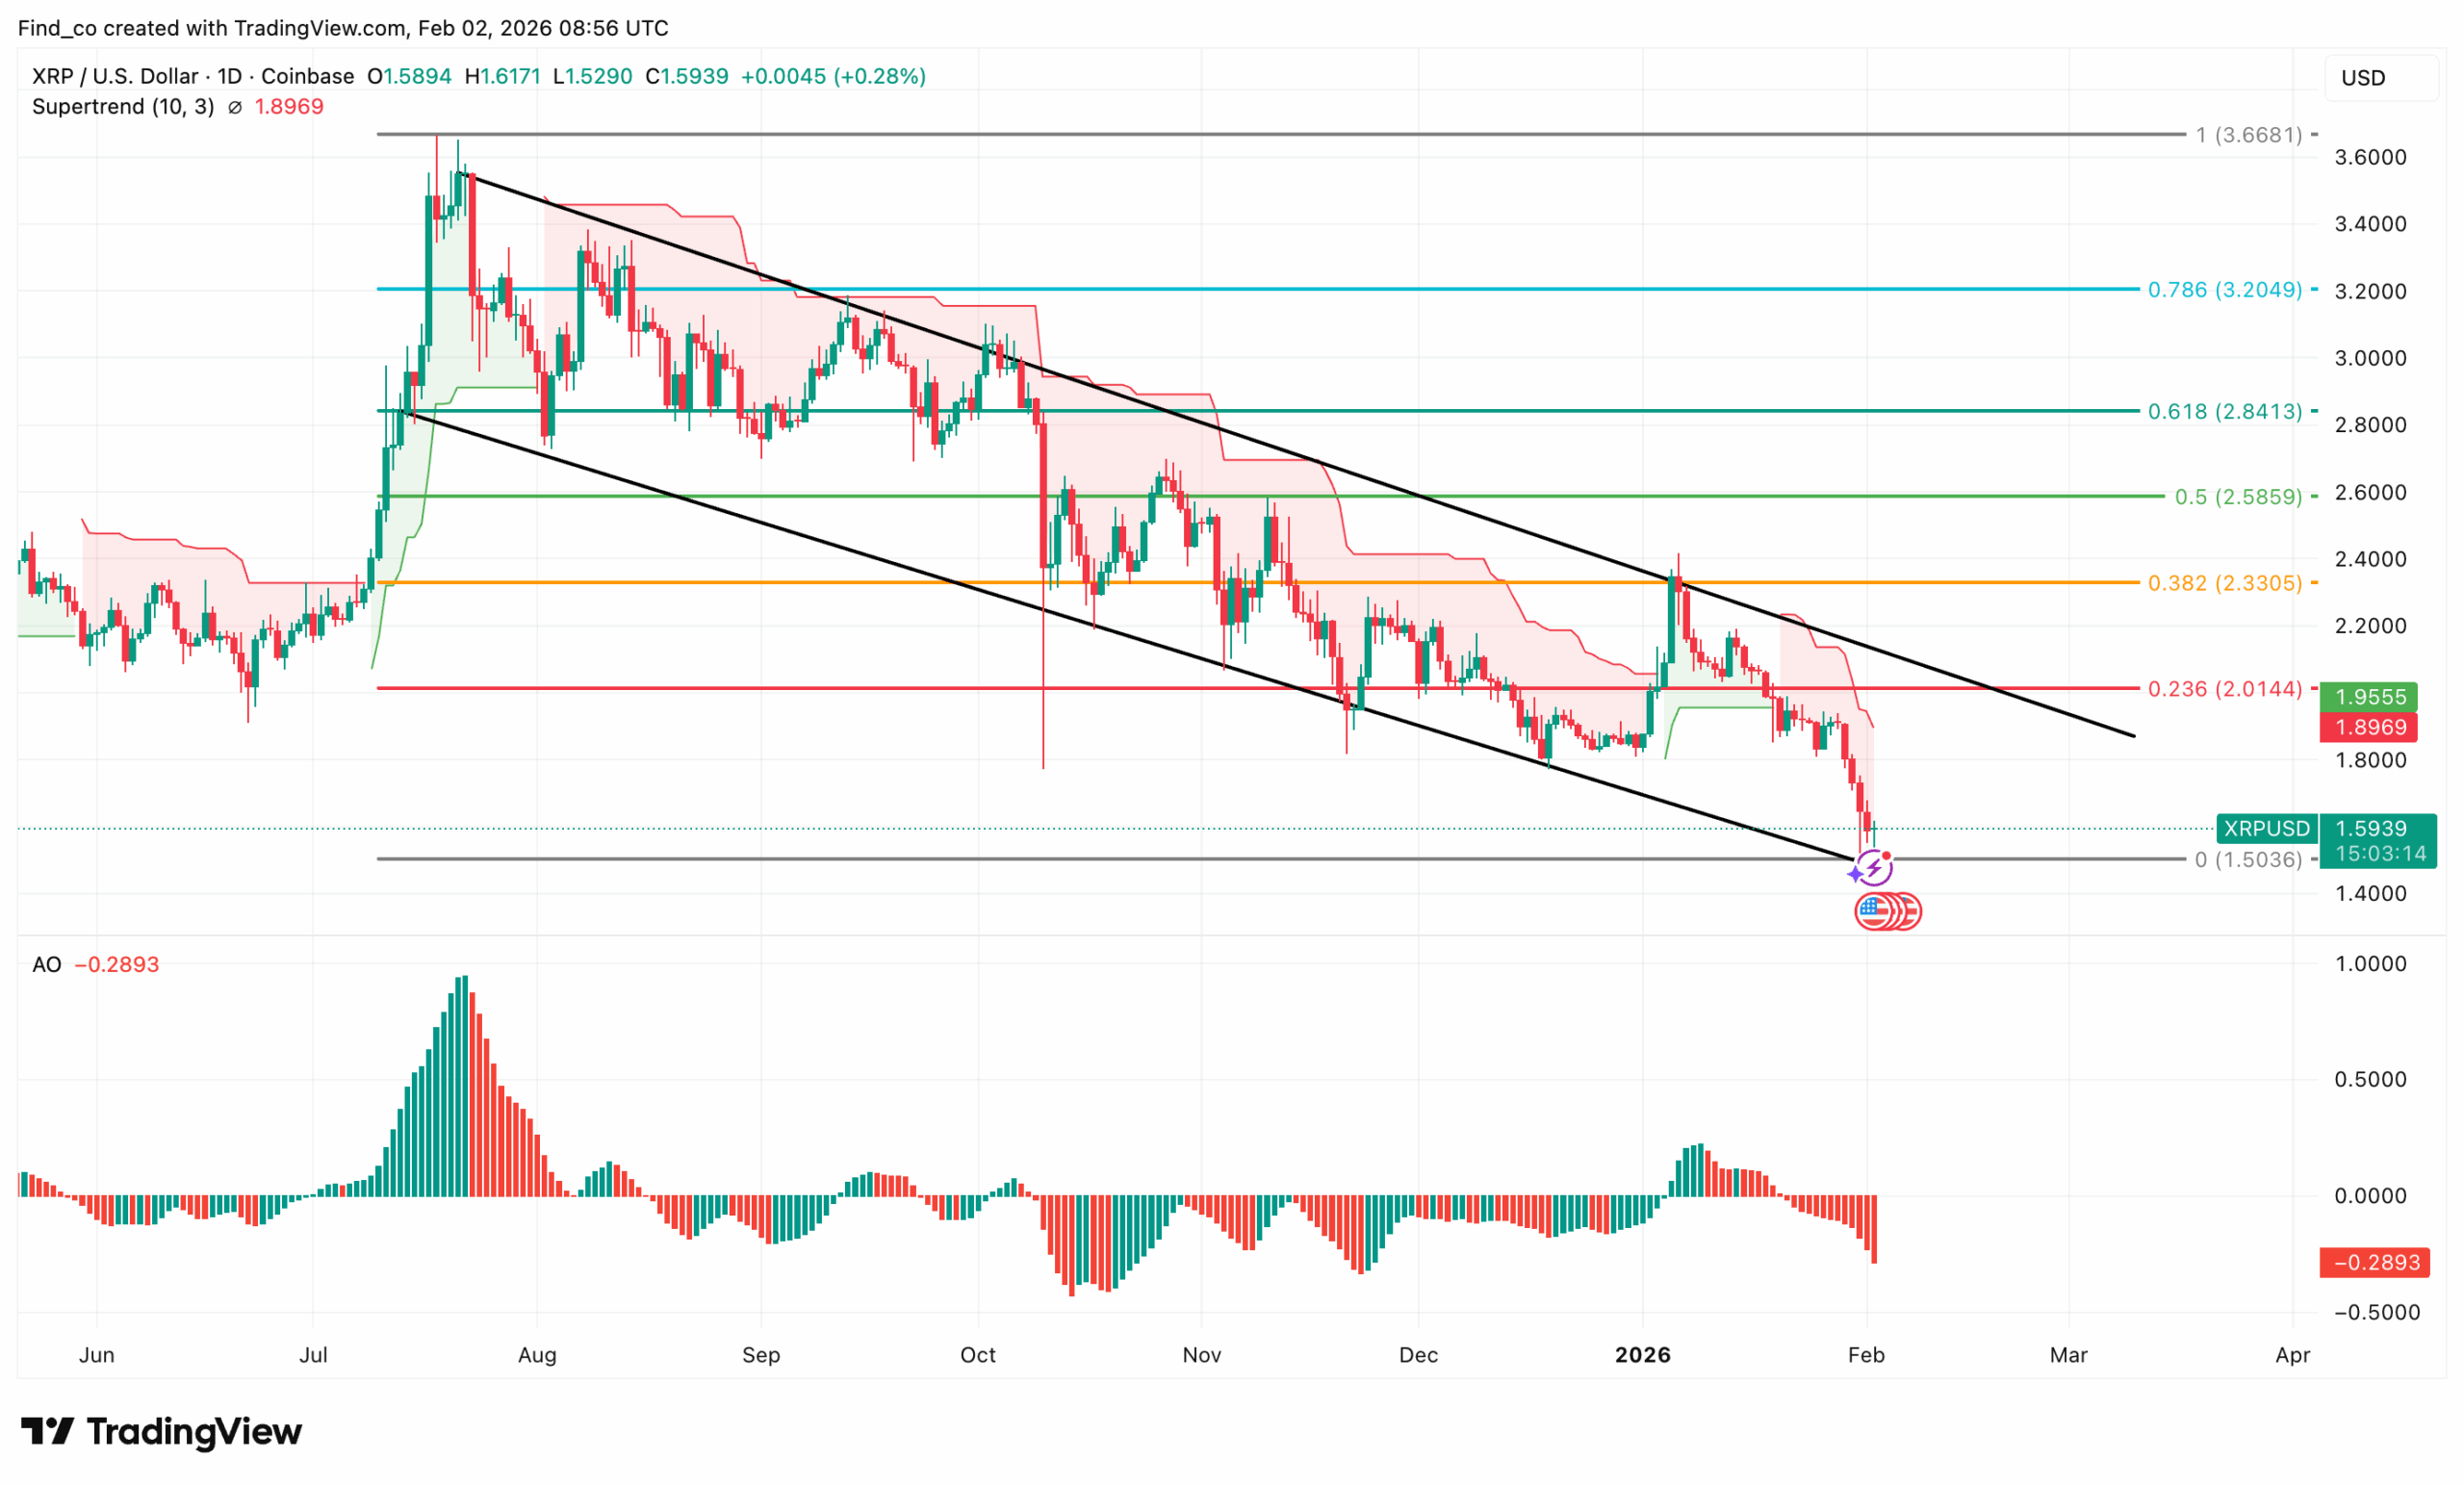
From a technical perspective, XRP is feeling that drag. At the time of writing, the token is trading around $1.59 after dropping roughly 20 % over the past month, and the chart has narrowed to a critical decision zone.
On the daily chart, price continues to trade inside a descending channel that has defined the trend since the late-2025 peak. Each rebound has produced a lower high.
Now, price is testing the lower boundary of the channel near $1.55. This area aligns with the base of the broader structure and has acted as demand in previous pullbacks.
However, momentum is still weak.
The Supertrend remains bearish, sitting well above price and reinforcing downside control.
Meanwhile, the Awesome Oscillator (AO) is deeply negative and expanding lower, signaling that bearish momentum is accelerating rather than stabilizing.
Fibonacci levels also frame the risk. XRP has lost the 0.236 retracement near $2.01, which has flipped into resistance.
Above that, the $2.33–$2.58 zone (0.382–0.5) marks a heavy supply region where sellers previously stepped in aggressively.
As long as XRP’s price stays below these levels, rallies are likely to be corrective. If that is the case, XRP’s price could slide to $1.50.
If the channel support holds, XRP could attempt a relief bounce back toward $2.01.
XLM Price Analysis
Stellar is telling a similar story at a different scale. XLM is hovering near $0.21, pinned between clearly defined support and resistance, while sentiment sits deep in fear territory.
What makes the divergence uncomfortable is that Stellar’s fundamentals are arguably improving.
Tokenized real-world assets on the network have crossed the $1 billion mark, a milestone that would typically be celebrated as validation of the chain’s niche.
Instead, XLM’s price remains tightly correlated to the broader risk-off move, unable to decouple from Bitcoin’s weakness.
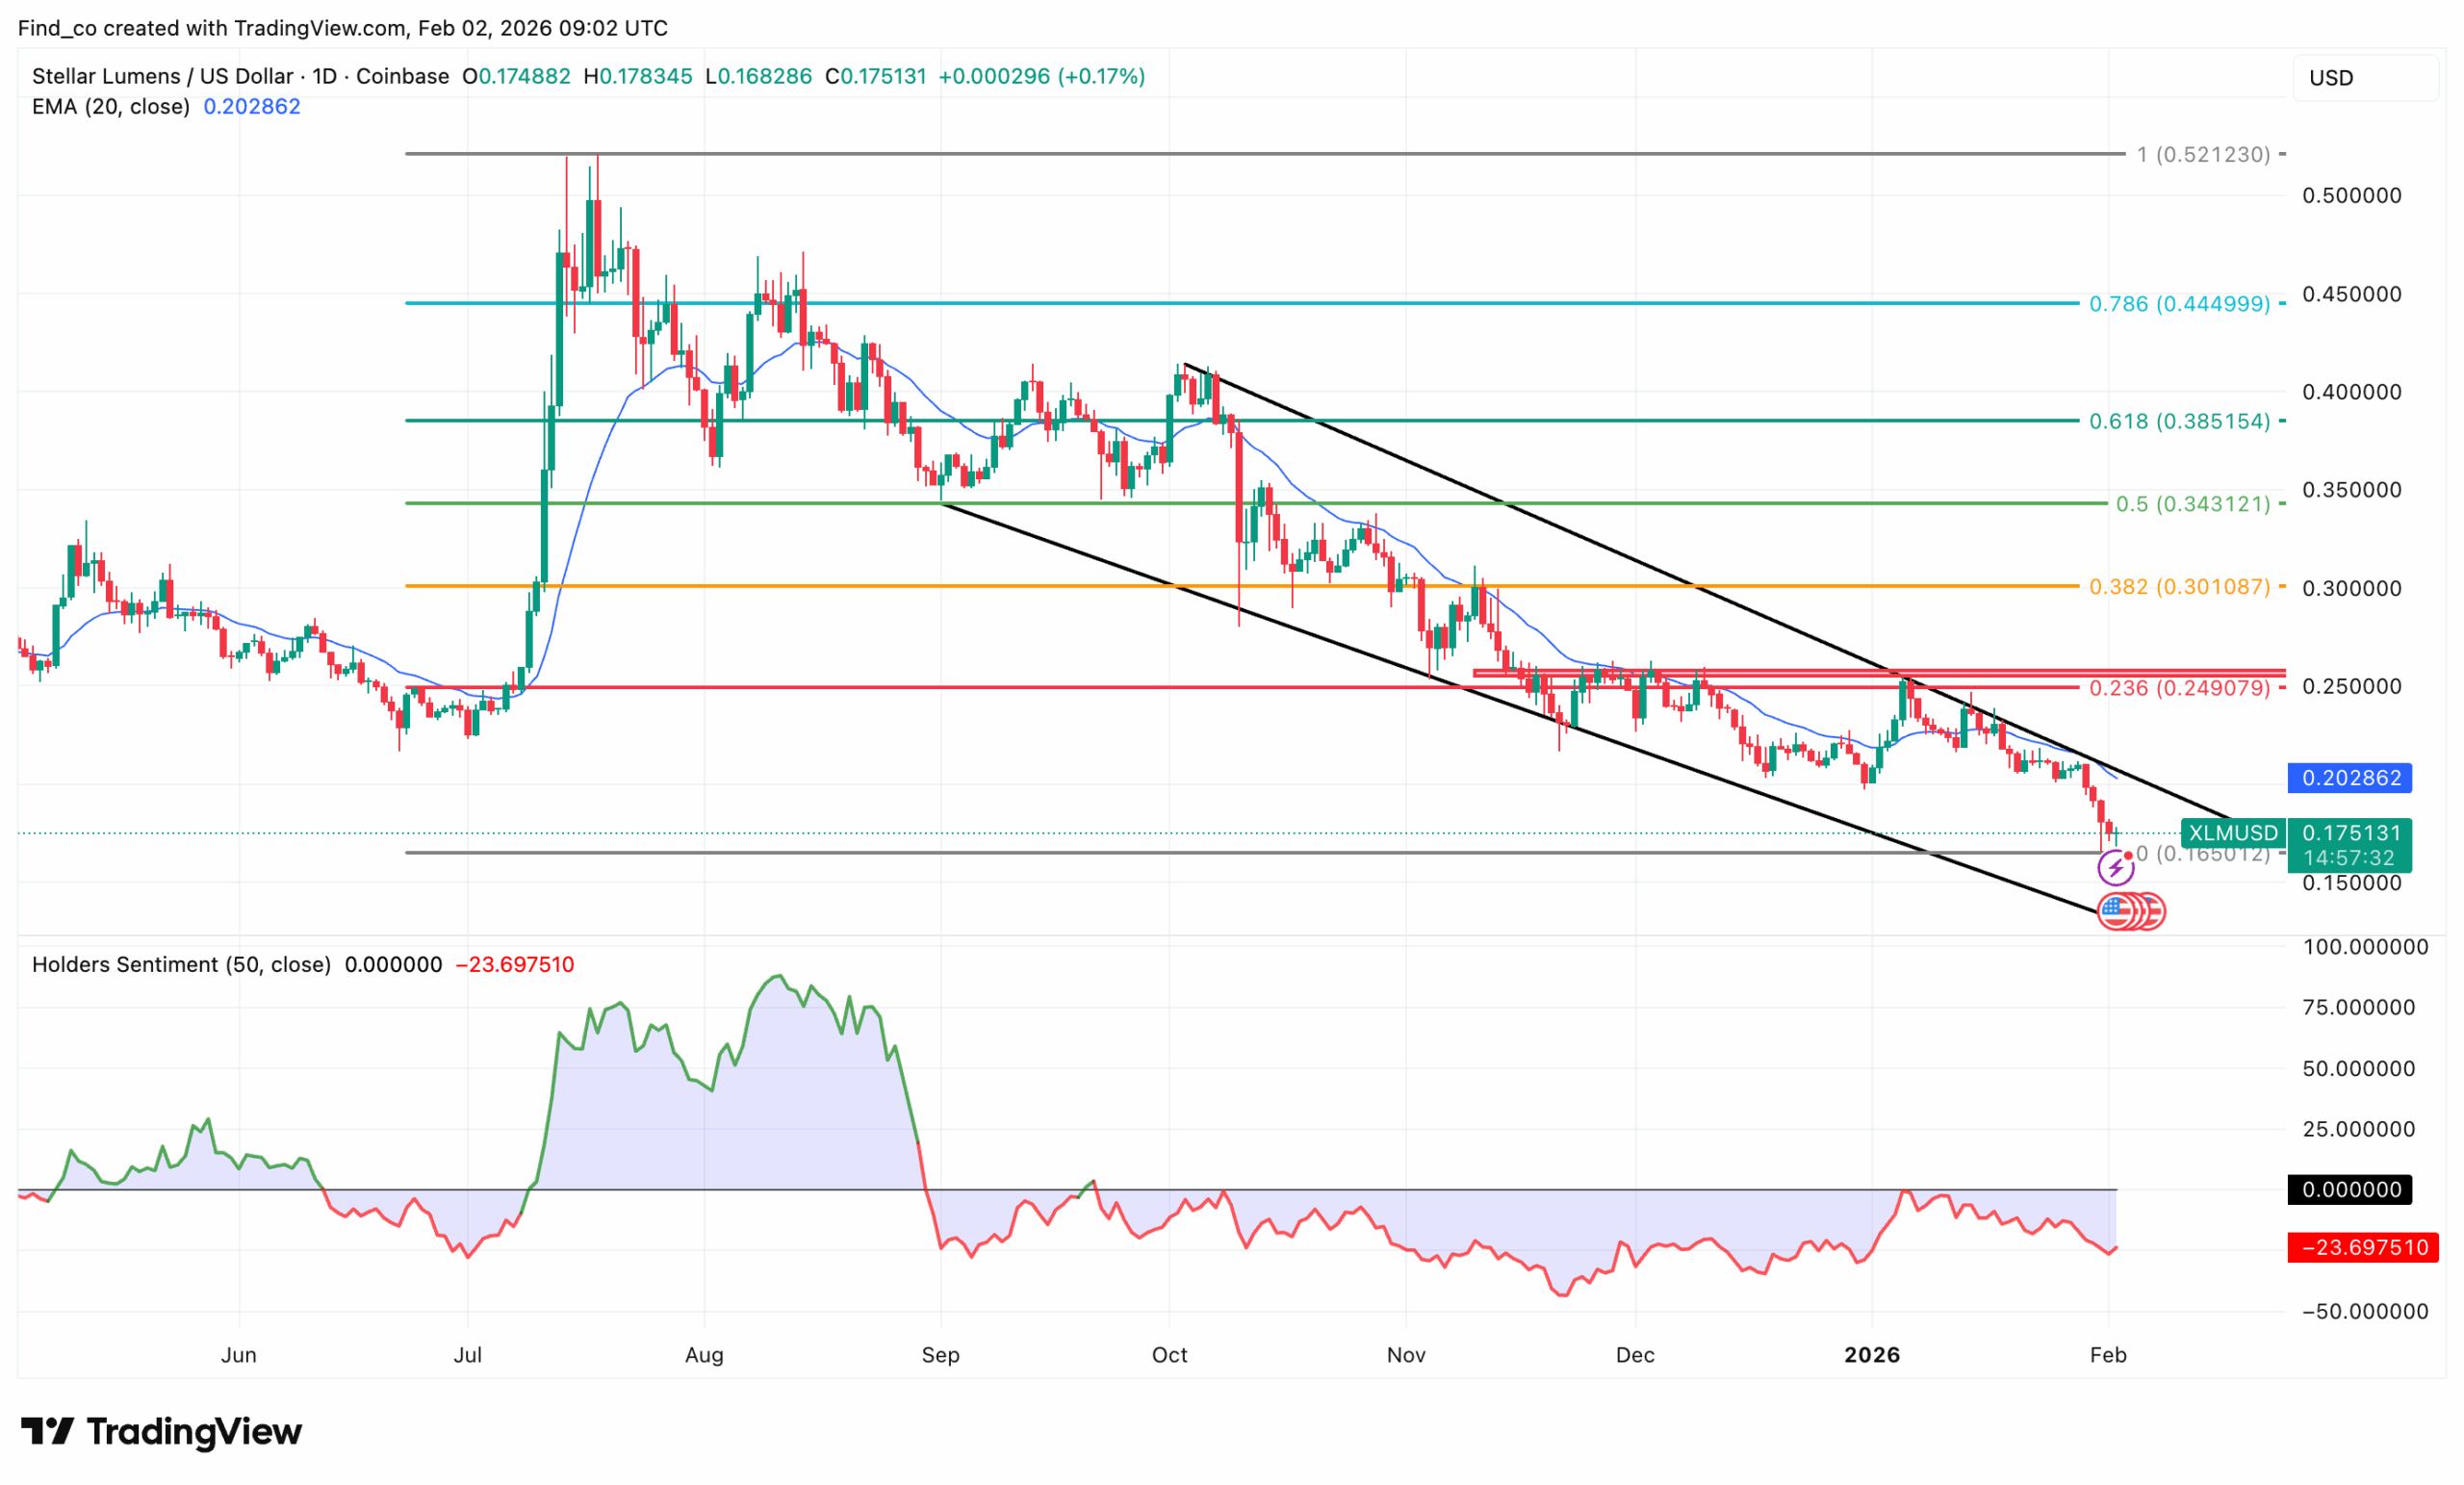
Now, XLM is testing the lower boundary of the channel near $0.17–$0.18, a zone that has acted as short-term demand in recent months.
Price is hovering just above this level, but follow-through remains weak. Momentum indicators reinforce the bearish bias.
The 20-day EMA, currently near $0.20, is sloping sharply downward and continues to cap upside attempts.
XLM’s price has also lost the 0.236 Fibonacci retracement around $0.25, which has flipped into firm resistance.
Above that, the $0.30–$0.34 region (0.382–0.5) represents a heavy supply zone where sellers have repeatedly stepped in.
Sentiment tells a similar story. At press time, the Holders Sentiment indicator remains deeply negative, signaling persistent pessimism among market participants.
Historically, such readings reflect trend exhaustion phases, but they do not guarantee an immediate reversal. Instead, they precede extended consolidation near lows.
Looking ahead, the $0.17 handle is critical. A daily close below this support would confirm a bearish continuation and expose the next downside target at $0.15, in line with prior structural lows.
Conversely, if buyers defend the channel base, XLM could attempt a bounce toward $0.22.
Disclaimer:
The information provided in this article is for informational purposes only. It is not intended to be, nor should it be construed as, financial advice. We do not make any warranties regarding the completeness, reliability, or accuracy of this information. All investments involve risk, and past performance does not guarantee future results. We recommend consulting a financial advisor before making any investment decisions.
Victor Olanrewaju is a crypto analyst and reporter at CCN with deep roots in on-chain research and technical analysis. His crypto journey began in 2017, but it was the 2020 Uniswap airdrop that sparked a full-time pivot into the space.
With a foundation in copywriting, Victor honed his craft creating high-converting content for leading crypto brokers — most notably an XRP price prediction that ranked #1 on Google during the 2021 bull run.
He later joined AMBCrypto in 2022, where he combined storytelling with technical and on-chain analysis to cover key market narratives.
In 2024, he expanded his expertise at BeInCrypto, collaborating with analysts and using tools like Glassnode, Santiment, and IntoTheBlock to break down Bitcoin and altcoin trends.
At CCN, Victor covers the top cryptocurrencies, memecoins, macro shifts, blending real-time insights with deep-dive metrics.
He holds a Bachelor’s degree in Physics from the University of Ibadan, equipping him to simplify complex data for a wide audience. Follow his work or connect on LinkedIn or X.