Key Takeaways
- Solana’s price recovers to $157, showing upward momentum.
- Active addresses rising, nearing previous highs.
- TVL climbs back above $4 billion, signaling positive trend.
After Solana ended its near 40% downfall from the March 18 high of $210 on April 13 at $122, the price of SOL started recovering. It was hovering around $150 from April 20, but on April 22 it finally went above there, reaching $157 at its highest point.
With some indication that the previous decline ended on its April 13 low and following positive signs, can Solana regain more of its value and continue its upward trajectory?
Solana (SOL) Fundamentals
The number of active addresses reached a low of 1.15 million on April 11 and was hovering around those levels until April 15. It started picking up the pace and increasing, currently sitting at 1.27.

At its recent high, Solana was around 1.6 million, making it only 0.33 million shy of its recent high, and is still higher than it was when SOL made its all-time high in November 2021. On the other hand, the number of non-vote transactions sharply decreased from its recent high of nearly 35 million on April 15. That figure is now at 23.5 million. These levels are its “support” dating from December last year.
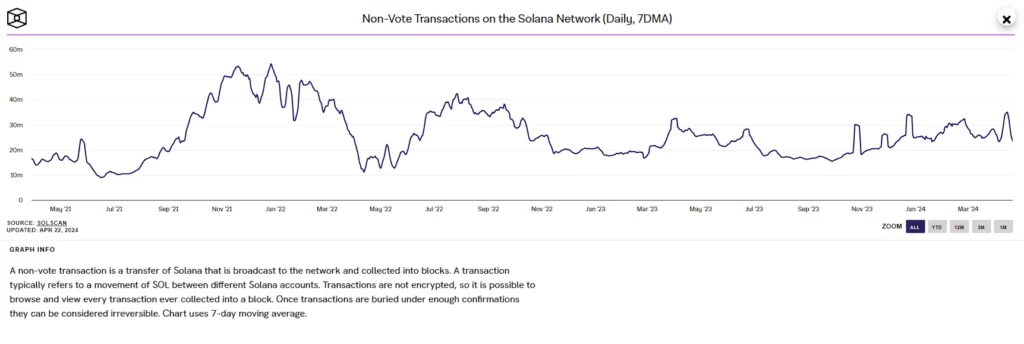
In contrast to the active addresses, the number of transactions is still significantly lower than in November 2021, when SOL made its all-time high.
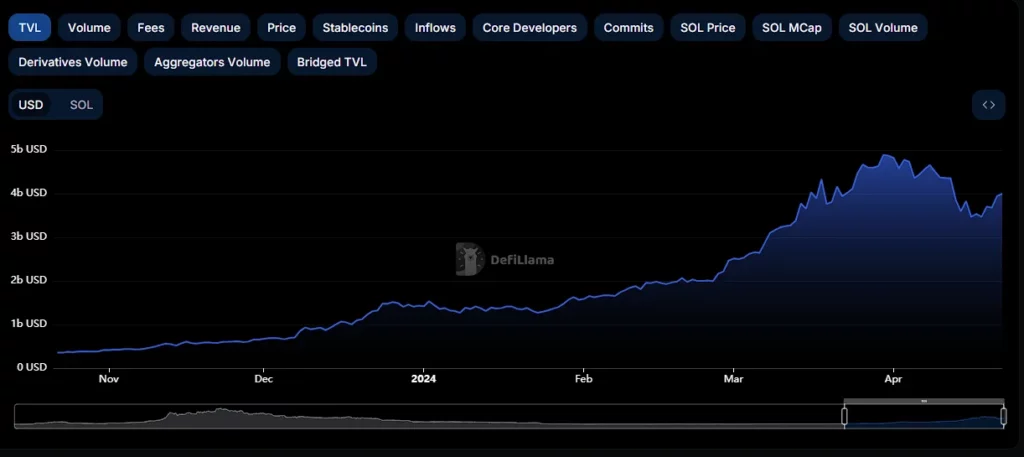
We saw an increase in TVL from its recent low of $3.46 billion on April 18, pulling back above the $4 billion today, April 22.
Solana (SOL) Price Analysis
On March 18, SOL‘s price peaked at $210 but dropped 21% to $162 by March 20. After this drop, SOL showed signs of recovery. It formed what looked kike an ascending triangle pattern, reaching up to $200, which acted as a resistance level.

The price was rejected at this resistance. As a result, SOL fell back to the initial point of the recent upward trend, indicating potential market weakness. This movement might represent the completion of an ending diagonal pattern, making the following downturn its larger corrective stage.
This recent recovery could respond to the sharp decline. This is because the overall wave structure suggests that the uptrend may have ended. Should this analysis hold, SOL might face another downturn, potentially breaking the ascending support line and targeting the next significant support zone at $80.
However, the increase continues in a more optimistic scenario as the corrective stage ends. This is suggested by the four-hour chart RSI, which came to its oversold zone below 30% on April 13.
The differentiating factors between these two outlooks would be what happens at the 0.618 Fibonacci retracement level at $174. If the price continues moving above it we could see a new upward advancement, potentially bringing SOL above $200 again. But if the price gets rejected before that, the possibility of another shard downturn would look more likely.
Disclaimers
Please note that the contents of this article are not financial or investing advice. The information provided in this article is the author’s opinion only and should not be considered as offering trading or investing recommendations. We do not make any warranties about the completeness, reliability and accuracy of this information. The cryptocurrency market suffers from high volatility and occasional arbitrary movements. Any investor, trader, or regular crypto users should research multiple viewpoints and be familiar with all local regulations before committing to an investment.

Nikola Lazic is a cryptocurrency analyst and investor working in the industry since 2017. He holds a bachelor's degree in Sociology, which enables him to better understand the psychology behind the crowd´s positioning. Consequently his preferred analytical tool is Elliott Wave Theory in combination with price action analysis.
Combining his experience in trading and investing with knowledge in content writing he strives to bring the most accurate and actionable information.
Expertise: Cryptocurrencies, Technical analysis, Elliott Wave Theory, On-chain metrics, Research reports.