Meet the Top 101 in Crypto

Solana Price Eyes $140 as SOL Enters Critical Breakout Phase Against Bitcoin

Published 09 July 2026
Giuseppe Ciccomascolo
Authors

Key Takeaways

  • Solana is entering a critical technical phase, as the $95-$100 resistance zone may be the key level that could determine the next major trend.
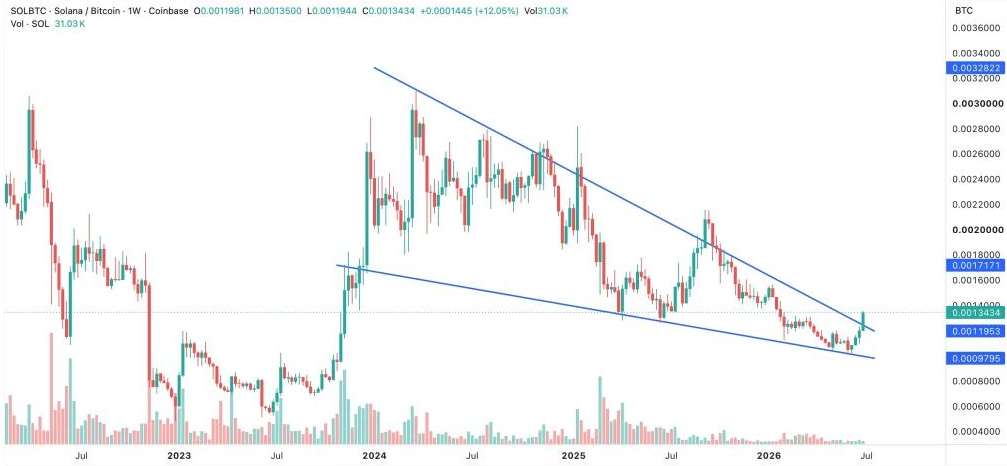
  • The SOL/BTC pair is testing a long-term falling wedge resistance near 0.00140-0.00145 BTC.
  • If SOL reclaims the $95-$100 range, technical analysis points to the $140-$150 value area, where historical trading volume is most concentrated.

Solana (SOL) has entered a pivotal stage that could determine whether its recent recovery evolves into a broader bullish trend or fades into another corrective move.

After climbing back above $80, the cryptocurrency has begun outperforming Bitcoin on a relative basis, a development that historically signals improving investor appetite for altcoins.

Yet the bullish narrative remains incomplete. SOL continues to trade below several key technical resistance levels, institutional inflows have moderated, and derivatives data point to mixed market conviction.

At the same time, the SOL/BTC trading pair is approaching a breakout level that many traders view as a leading indicator of capital rotation into the Solana ecosystem.

The coming sessions may therefore prove decisive. If buyers reclaim the critical $95 resistance zone, analysts see room for a rally toward $140. Failure to do so, however, could expose SOL to another significant pullback.

Try Our Recommended Crypto Exchanges
Sponsored
Disclosure
Opened in 2018
Promotions
Deposit $100, Get an Extra $300 in GOLD!
Coins
Shiba Inu Bitcoin PAX Gold Ampleforth Ethereum +70
Promotions
Receive up to $100,000 worth of exclusive gifts for newcomers upon registration.
Coins
Bitcoin Ethereum Tether USD Coin Solana +76
Opened in 2017
Promotions
Experience a 1-minute swap on a non-custodial platform.
Coins
Bitcoin Ethereum Tether Build'N'Build USD Coin +217
Show More

SOL/BTC Breakout Could Signal the Next Altcoin Leader

One of the strongest bullish arguments for Solana currently comes from its performance relative to Bitcoin rather than the US dollar.

The SOL/BTC pair is testing the upper boundary of a long-term falling wedge that has capped price action since late 2024. Furthermore, the pair currently trades around 0.00134 BTC, just below the key breakout zone between 0.00140 and 0.00145 BTC.

SOL/BTC pair
SOL/BTC pair. | Credit: TradingView

Historically, breakouts from similar structures have preceded stronger capital inflows into Solana as investors rotate away from Bitcoin toward higher-beta assets.

A confirmed breakout above resistance would strengthen the case that Solana could become a leader in the next altcoin rotation.

However, confirmation remains essential. If SOL/BTC fails to clear resistance, the pair could retreat toward support near 0.0010 BTC, reinforcing Bitcoin’s market dominance and delaying Solana’s recovery.

This divergence between relative strength and absolute price performance has become one of the market’s most closely watched signals.

Solana Must Reclaim $95 Before Bulls Can Target $140

While the Bitcoin pair is improving, the SOL/USD chart still reflects a market attempting to recover from a prolonged correction.

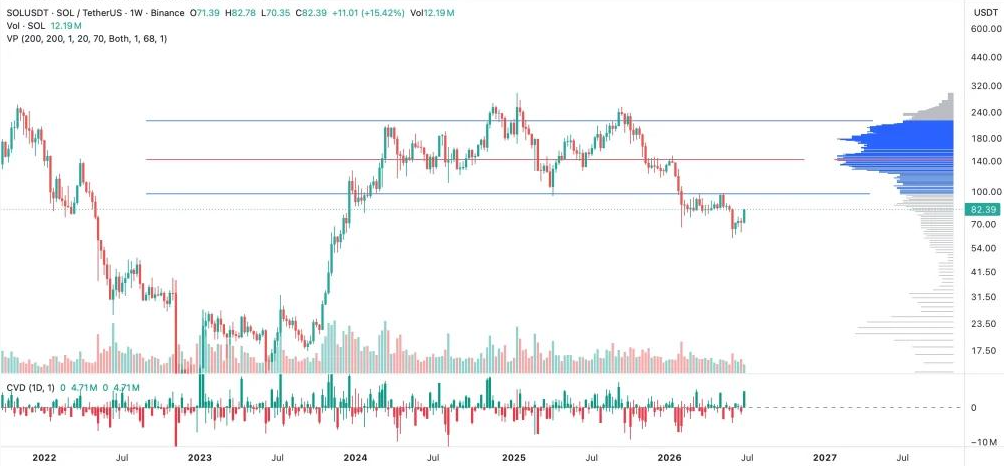
SOL currently trades well below its 200-day exponential moving average near $95.50, which remains the primary resistance level for medium-term traders.

Volume Profile analysis also shows that the highest concentration of historical trading activity sits between $135 and $150, suggesting this remains Solana’s long-term fair value area.

SOL/USDT chart
After breaking below the critical $95–$100 zone, Solana remains under pressure. | Credit: TradingView

Until buyers reclaim the $95- $100 range, however, that target remains out of reach.

The Cumulative Volume Delta (CVD) provides another reason for caution. Spot buying activity has remained relatively subdued, indicating that recent gains have not yet been supported by aggressive accumulation from long-term investors.

Sustainable rallies typically require growing spot demand rather than leverage-driven speculation.

Immediate support sits between $75 and $78, where both the 50-day EMA and an important Fibonacci retracement converge.

A decisive break below that zone could shift momentum sharply lower and expose SOL to a decline toward the June low near $60, representing roughly 20% downside from current levels.

Conversely, a sustained move above the descending trendline around $84 would improve the short-term outlook and bring the 200-day EMA near $95 back into focus.

Institutional Demand Softens as Retail Sentiment Remains Mixed

Market participation has become increasingly mixed despite Solana’s improving technical structure.

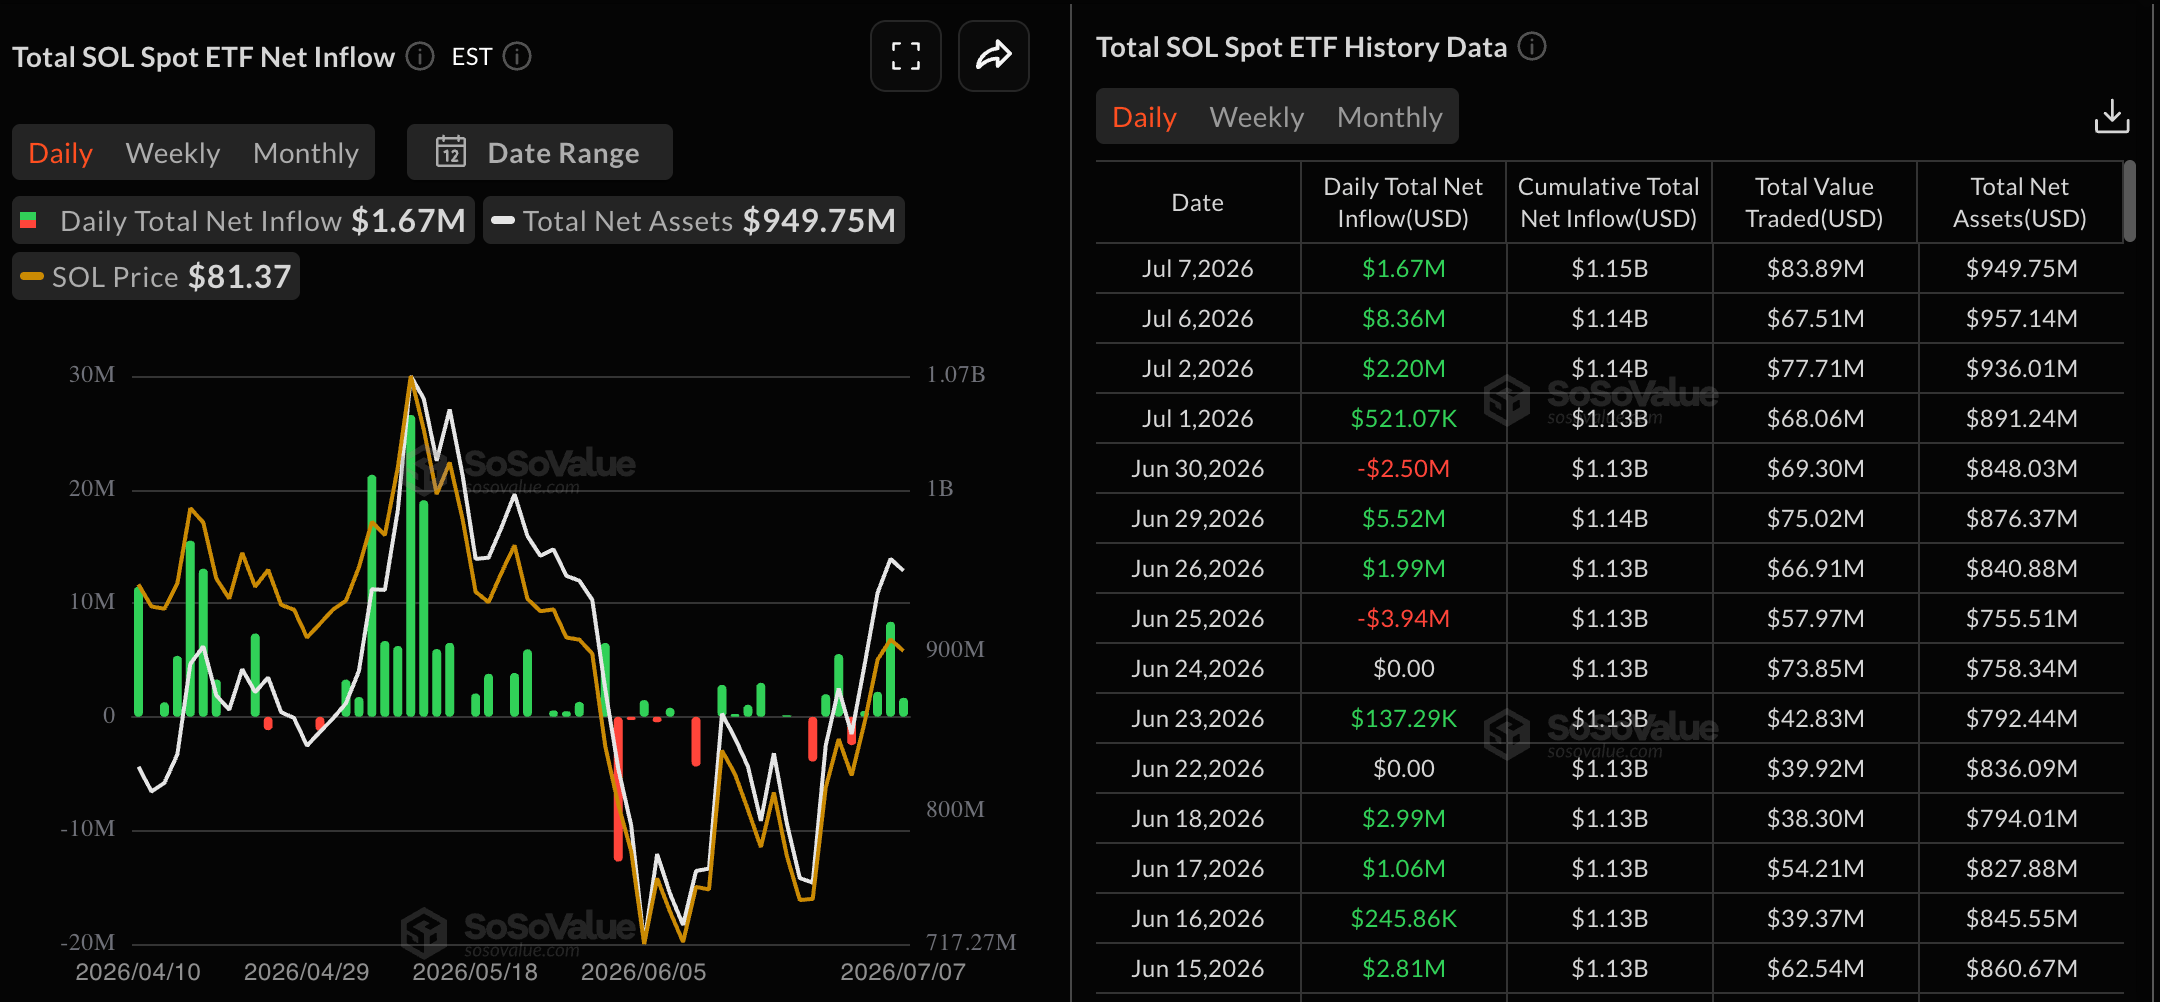
Institutional interest has slowed in recent days. According to SoSoValue data, SOL-focused exchange-traded funds recorded inflows of approximately $1.67 million, down significantly from $8.36 million the previous session.

Although inflows remain positive, the slowdown suggests institutions are becoming more selective as SOL approaches major resistance.

SOL ETFs inflows
SOL ETFs inflows notably decreased. | Credit: SoSoValue

Derivatives markets tell a similar story.

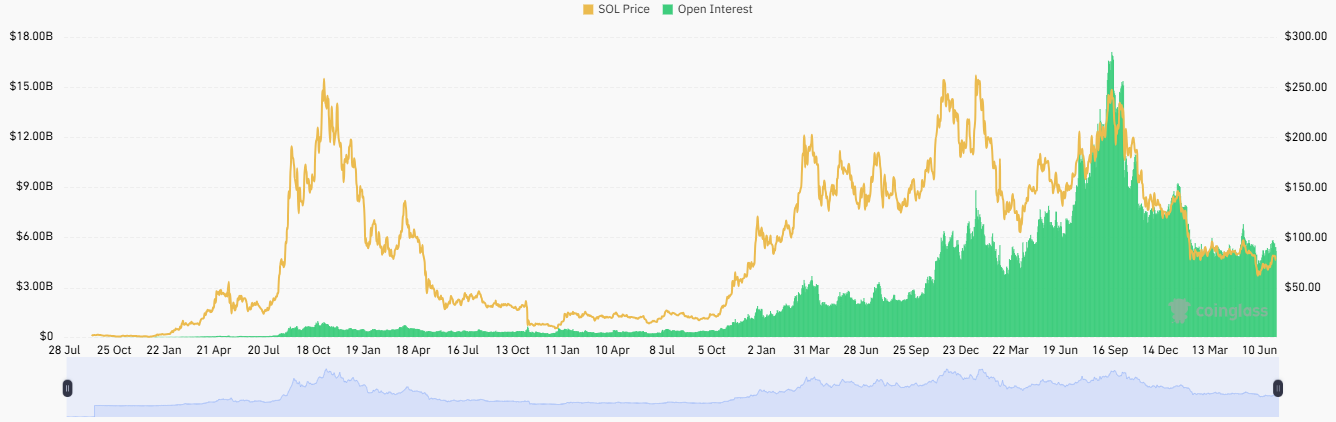
CoinGlass data show Solana futures open interest has fallen about 4% over the past 24 hours, while trading volume has also declined.

Funding rates have returned to slightly positive territory after briefly turning negative, indicating that neither bulls nor bears currently holds a decisive advantage.

Solana futures open interest
Solana futures open interest dropped by 4% in just 24 hours. | Credit: CoinGlass

Technical indicators also paint a balanced picture. The Relative Strength Index remains above the neutral 50 level but has begun drifting lower, reflecting slowing bullish momentum.

Meanwhile, the MACD is approaching a potential bearish crossover, which could reinforce selling pressure if buyers fail to defend current support.

Despite these short-term risks, Solana’s improving performance against Bitcoin suggests the market may be entering what analysts describe as a “transition phase.”

During previous market cycles, this pattern often appeared before broader trend reversals, as relative strength improved before dollar-denominated prices fully reflected renewed investor demand.

For now, the market’s focus remains clear. A decisive breakout above $95 would likely confirm that transition and open the path toward the $140-$150 value area.

Until then, Solana remains caught between encouraging early signals and the technical hurdles that continue to cap its recovery.

Disclaimer: The information provided in this article is for informational purposes only. It is not intended to be, nor should it be construed as, financial advice. We do not make any warranties regarding the completeness, reliability, or accuracy of this information. All investments involve risk, and past performance does not guarantee future results. We recommend consulting a financial advisor before making any investment decisions.
Giuseppe Ciccomascolo

Giuseppe Ciccomascolo began his career as an investigative journalist in Italy, where he contributed to both local and national newspapers, focusing on various financial sectors.

Upon relocating to London, he worked as an analyst for Fitch's CapitalStructure and later as a Senior Reporter for Alliance News. In 2017, Giuseppe transitioned to covering cryptocurrency-related news, producing documentaries and articles on Bitcoin and other emerging digital currencies. He also played a pivotal role in establishing the academy for a cryptocurrency exchange website. Crypto remained his primary area of interest throughout his tenure as a writer for ThirdFloor.

Related

Survey Icon
Help us improve
1 of 4
Is this your first time here?
What brought you here today?
What are you most interested in?
Would you be interested in:
Thank you icon
Thank you for your feedback!
DMCA.com Protection Status