Solana's network activity is hitting record highs, but SOL remains under pressure. Here's why analysts say the token could still fall toward $60. | Credit: CCN.com
Share
Key Takeaways
Solana’s recent rally may be a countertrend bounce rather than a true trend reversal.
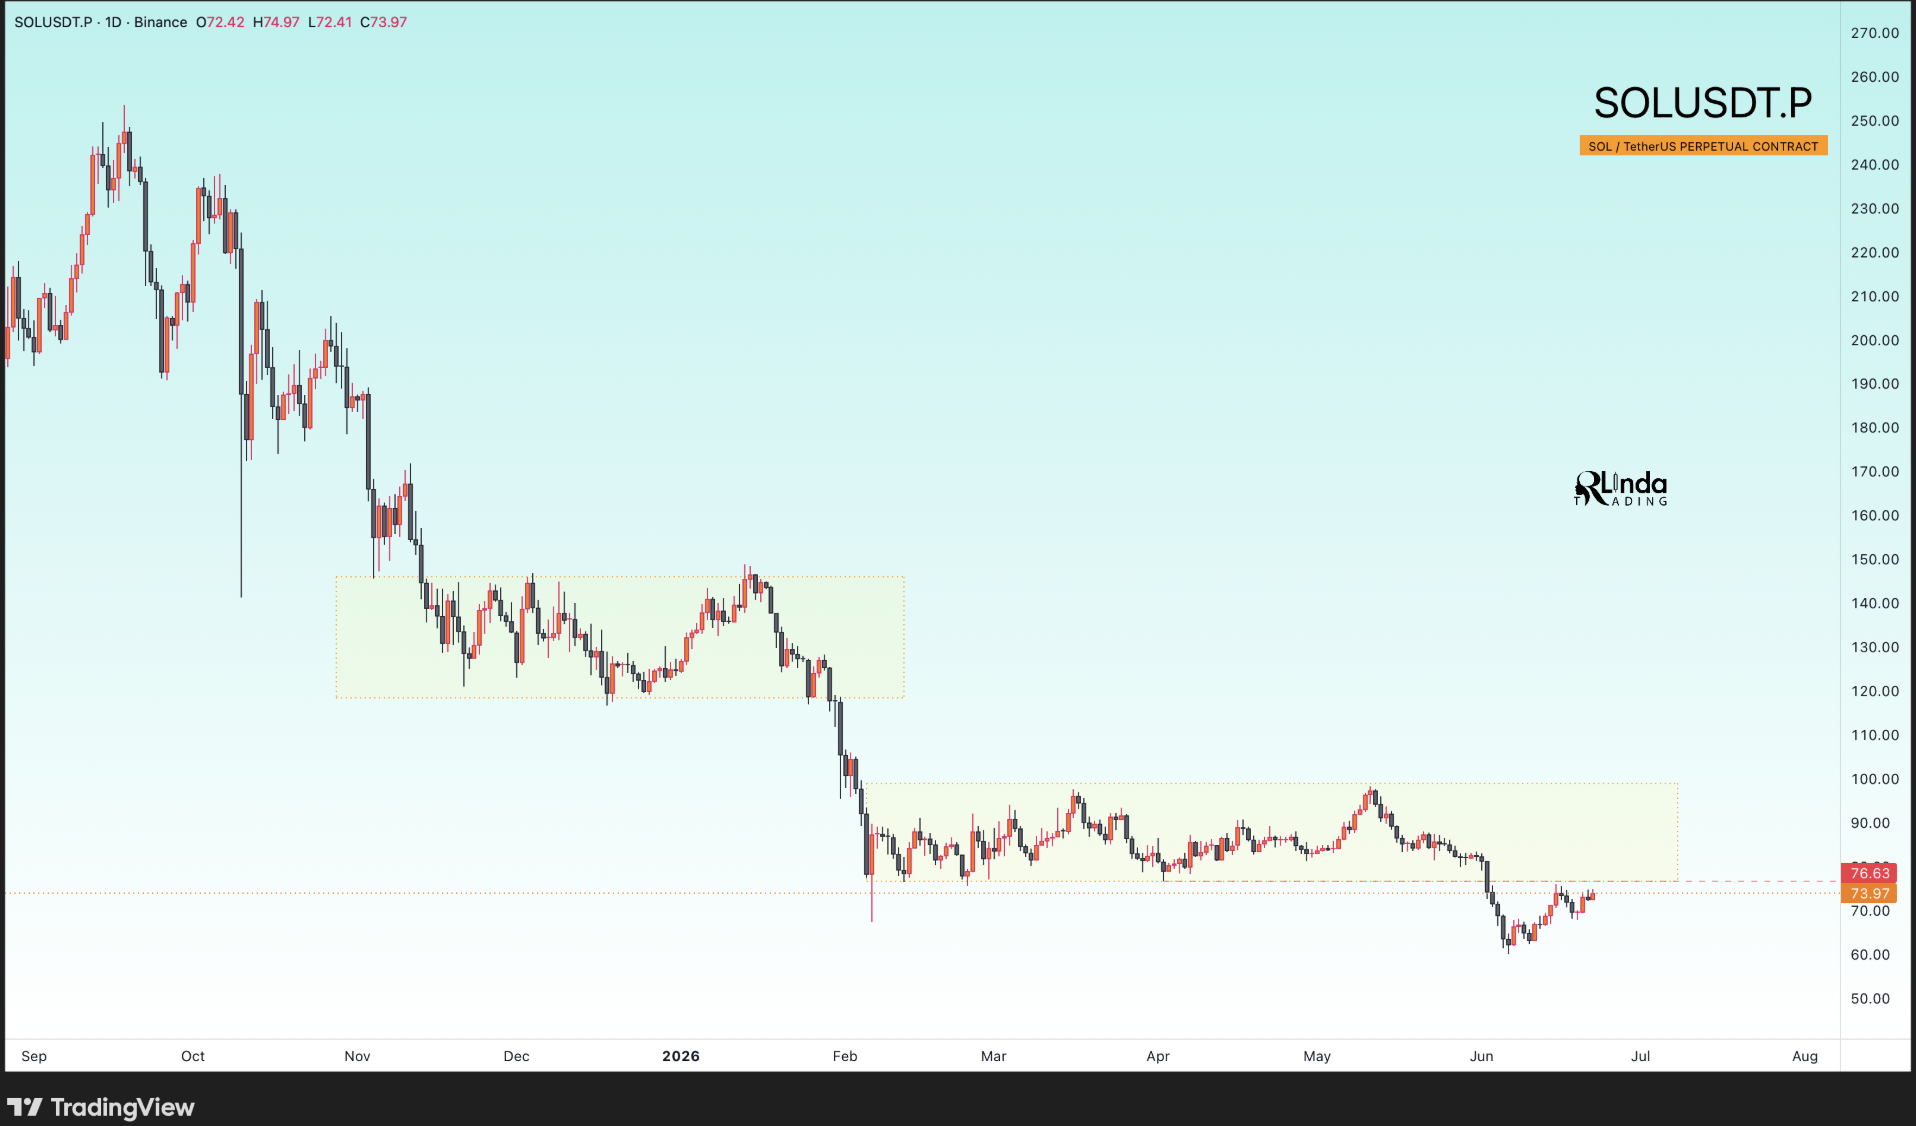
The $76.0-$76.6 zone is the key resistance area to watch, and a move into this region could represent a liquidity hunt designed to trigger stop losses.
Both a double-top formation and a bear flag setup project a potential decline toward the $60-$61 area.
Solana’s recent recovery may be masking a larger bearish structure that continues to dominate the market.
After rebounding from June lows near $60, SOL has staged a countertrend rally toward the $74-$76 region, but several technical indicators suggest the move could be a liquidity hunt rather than the beginning of a sustained uptrend.
The broader cryptocurrency market remains under pressure, with Bitcoin still struggling to establish a clear bullish trend.
Within that environment, Solana’s rebound appears increasingly vulnerable as traders watch for signs of exhaustion near a critical resistance zone.
Multiple chart patterns, including a double-top formation and a bear flag setup, are now pointing toward the same downside target around $60.
As a result, the $76 area has become one of the most important battlegrounds for SOL in the weeks ahead.
Try Our Recommended Crypto Exchanges
Sponsored
Disclosure
We sometimes use affiliate links in our content, when clicking on those we might receive a commission at no extra cost to you. By using this website you agree to our terms and conditions and privacy policy.
Analysts view this zone as a potential liquidity target where short sellers could be squeezed out and late buyers drawn into the market before a reversal occurs.
SOL/USDT continues to develop a countertrend correction. | Credit: TradingView
This scenario is often referred to as a liquidity hunt, a move designed to trigger stop-loss orders and attract fresh demand before the dominant trend resumes.
A false breakout above $76 could strengthen that narrative. If Solana briefly pushes above resistance but fails to establish support, it would reinforce the idea that the rally is corrective rather than impulsive.
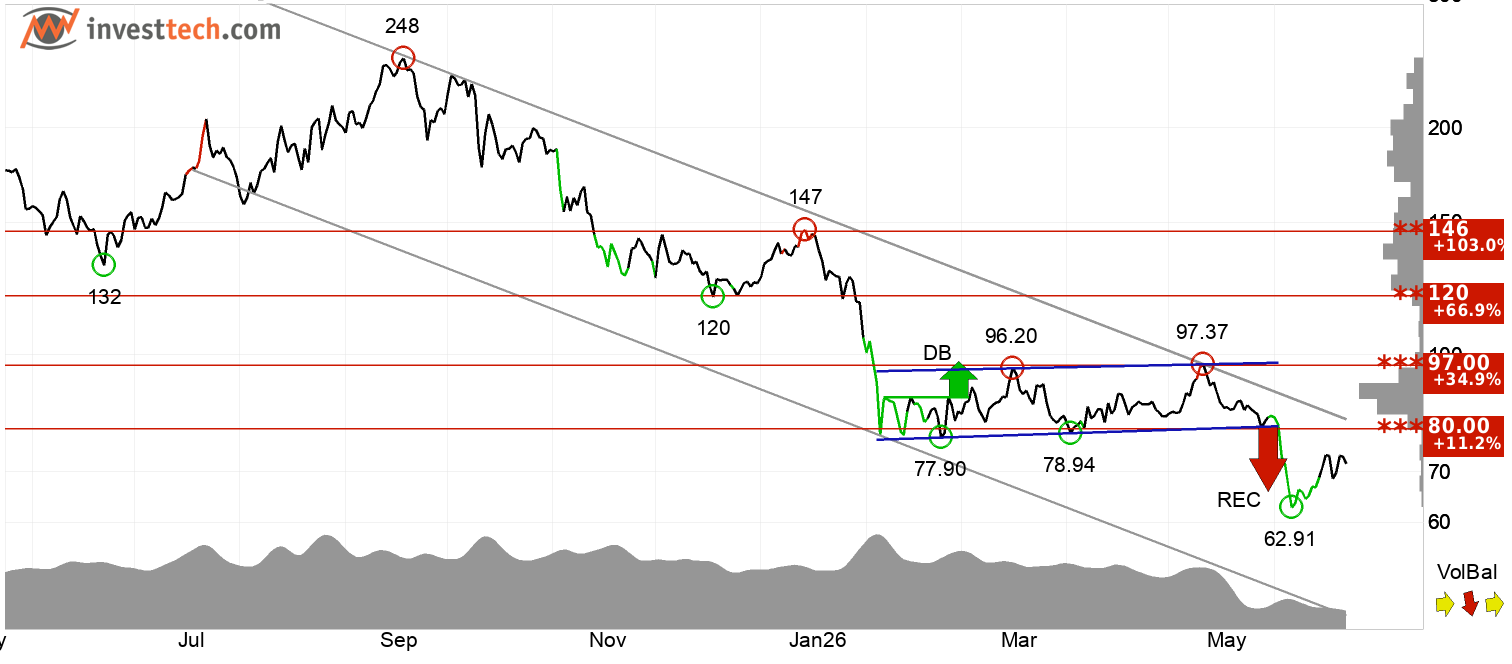
Adding to the bearish outlook is the fact that SOL has already completed a downside objective near $65.92 following an earlier rectangle breakdown.
Although prices have bounced since reaching that target, the broader formation continues to suggest additional downside risk.
On the upside, a sustained move above $76 would be the first indication that sellers are losing control. Stronger resistance sits near $80, a level that could become the next major test if bullish momentum unexpectedly accelerates.
Double Top and Bear Flag Point Toward $60
Several bearish chart formations are converging around the same downside objective.
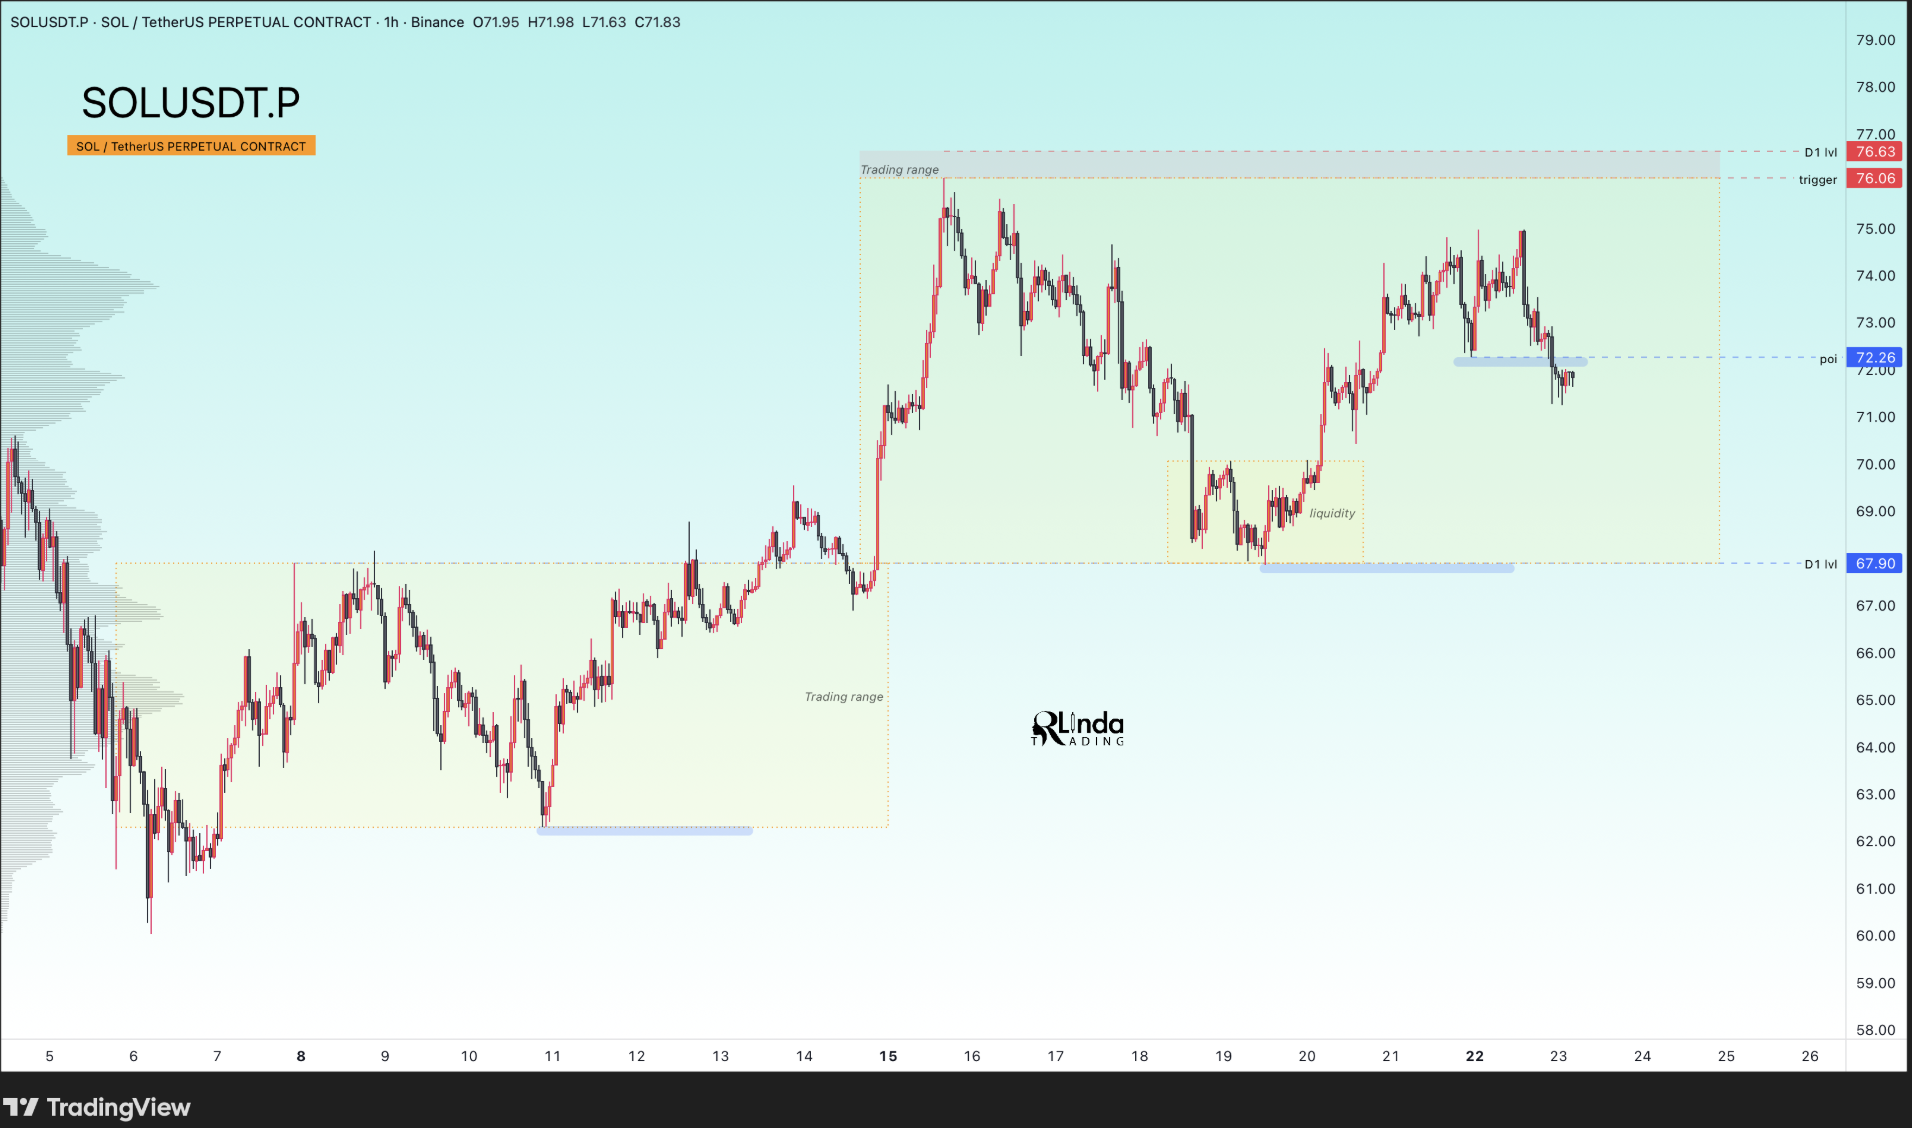
The first is a double-top pattern that developed near the $74-$75 region. The formation emerged after Solana rallied sharply from its June lows but failed twice to break through resistance.
The neckline of the pattern sits near $68. A decisive break below that level would confirm the setup and project a measured move toward the $60-$61 area.
A false breakout above the range resistance could create a potentially attractive setup. | Credit: TradingView
The structure formed after the token’s sharp decline from the $86-$87 range earlier this month and subsequent recovery inside an upward-sloping channel.
Bear flags typically represent temporary pauses within larger downtrends. If the channel’s lower boundary fails, the prior bearish move often resumes.
Notably, the bear flag projection also points to a downside target around $60.70. When multiple independent patterns identify the same support zone, traders generally assign greater significance to that level.
Momentum indicators further support the cautious outlook. SOL remains below its 20-period, 50-period, and 200-period exponential moving averages, while the Relative Strength Index remains weak and below neutral territory.
Macro Risks Could Amplify Selling Pressure
Technical concerns are emerging alongside a more challenging macro backdrop.
Technology stocks have recently come under pressure as investors reassess the sustainability of aggressive AI spending.
Weakness in major growth names has contributed to broader risk-off sentiment across speculative markets, including cryptocurrencies.
Meanwhile, renewed attention on the yen carry trade presents another potential threat. A sharp appreciation of the Japanese yen could force leveraged investors to unwind risk positions, further pressuring high-beta assets such as Solana.
Solana is in a falling trend channel. | Credit: InvestTech
This matters because Solana has historically exhibited stronger volatility than Bitcoin during periods of market stress.
For now, the critical range remains between $67.9 and $76.0. A breakout above resistance would challenge the bearish thesis, but as long as SOL remains below that zone, the path of least resistance appears lower.
With a liquidity hunt potentially targeting the $76 region and multiple chart patterns signaling a deeper correction, traders are increasingly focused on whether Solana’s latest rally is a recovery or the final stage before another move toward $60.
Giuseppe Ciccomascolo began his career as an investigative journalist in Italy, where he contributed to both local and national newspapers, focusing on various financial sectors.
Upon relocating to London, he worked as an analyst for Fitch's CapitalStructure and later as a Senior Reporter for Alliance News. In 2017, Giuseppe transitioned to covering cryptocurrency-related news, producing documentaries and articles on Bitcoin and other emerging digital currencies. He also played a pivotal role in establishing the academy for a cryptocurrency exchange website. Crypto remained his primary area of interest throughout his tenure as a writer for ThirdFloor.