Solana’s path to $100 remains blocked by a series of lower highs | Credit: Hameem Sarwar
Share
Key Takeaways
Solana’s price faces notable resistance before $100 comes into view.
Open interest has declined 4.45%, signaling reduced leverage.
The next major Fibonacci barrier stands around the 0.236 Fib level.
Solana (SOL) is fighting back, but the road to $100 is anything but clear.
After weeks of pressure, the bulls are attempting a recovery. However, multiple resistance walls now stand in the way of Solana’s price rebound.
Each level tells a story, and unless buyers break through intentionally, SOL’s comeback could continue to stall.
Solana Fails to Sustain Rebound
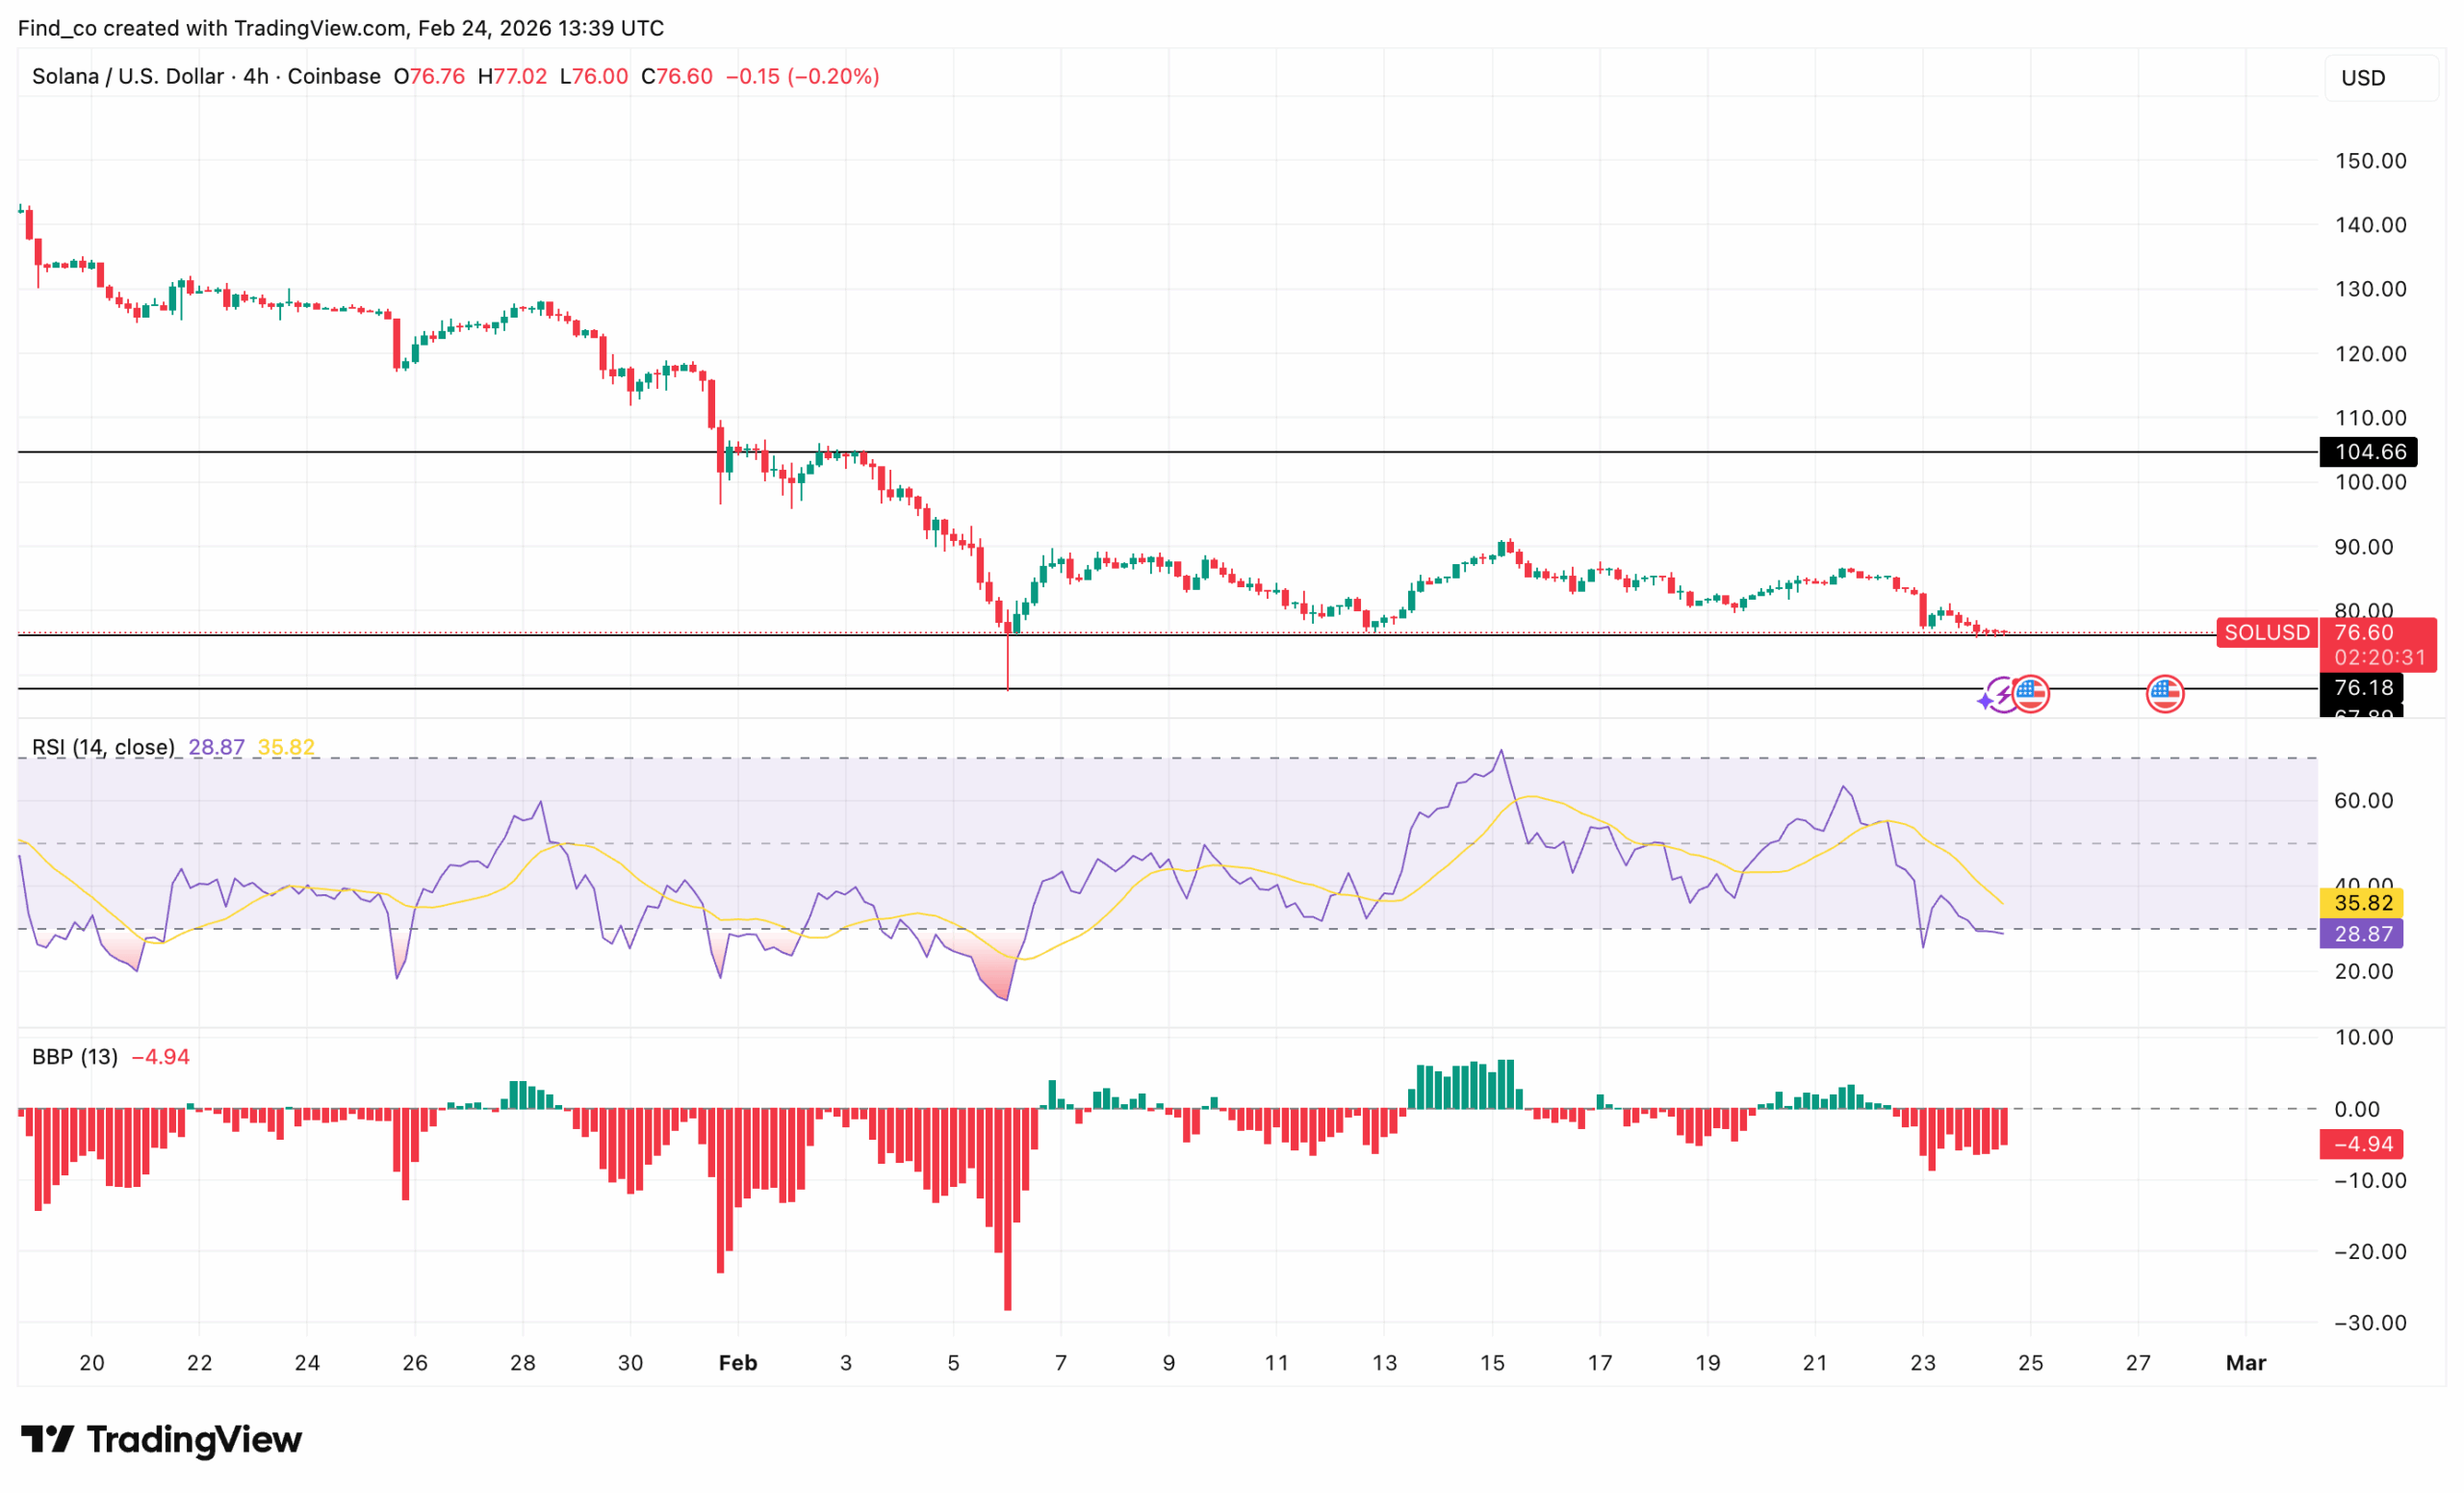
Earlier this month, Solana’s price lost the critical $94 resistance level. That level previously acted as support. However, the asset failed to reclaim this level, leading to further breakdown.
Notably, a selloff earlier in the month pushed SOL’s price briefly below $70, marking a local capitulation low.
Although buyers stepped in, the rebound stalled below $90. This created a clear lower high.
Get These Top Crypto Casino Offers Now!
Sponsored
Disclosure
We sometimes use affiliate links in our content, when clicking on those we might receive a commission at no extra cost to you. By using this website you agree to our terms and conditions and privacy policy.
Earlier green momentum in mid-February failed to sustain. Therefore, bullish attempts appear weak and temporary.
Now, SOL hovers just above the $75-$76 support zone. If this level fails, sellers may target the $70 region again.
Bulls must reclaim $86.50 first. Only then can momentum shift toward the psychological $100 threshold.
Bearish Bias Remains Mild
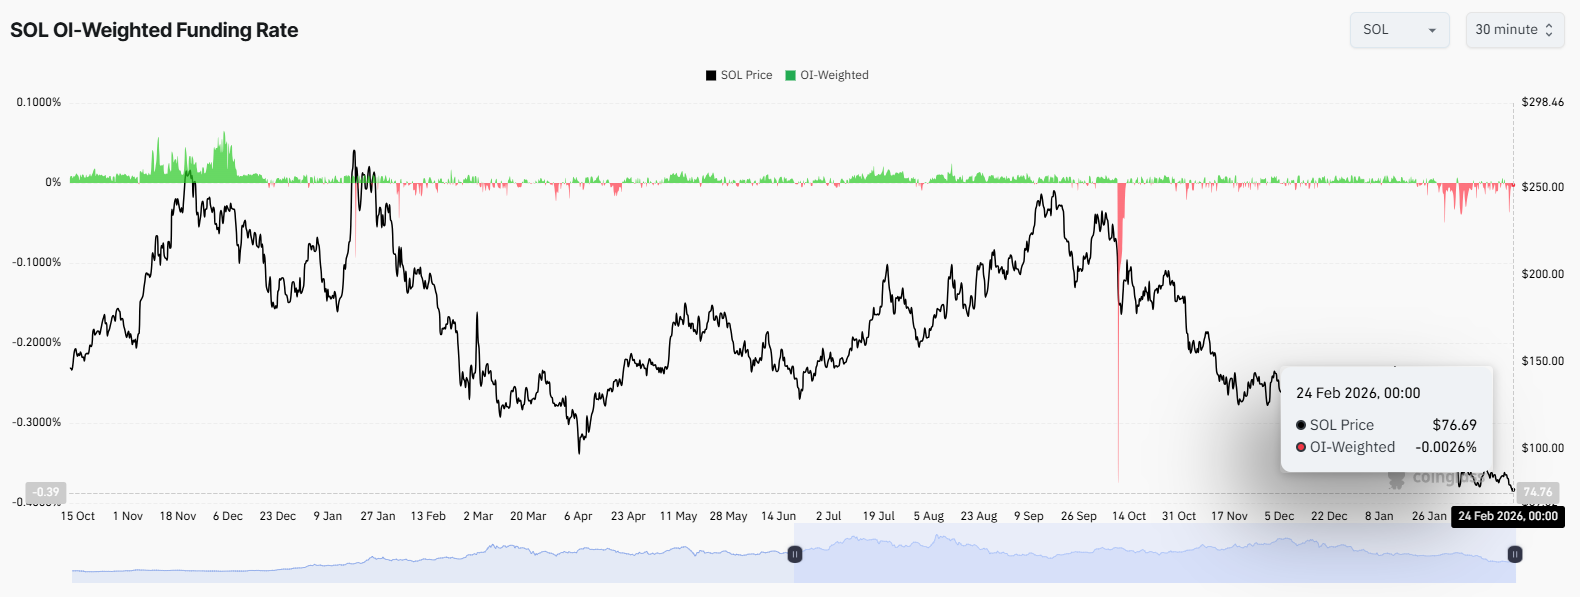
On-chain metrics highlight a slightly bearish sentiment. Solana’s (SOL) funding rate sits at -0.0026%, indicating that shorts are paying longs.
Open interest has declined by 4.45%, indicating that overall market leverage is easing. Together, these metrics point to a slightly bearish sentiment, but price moves remain largely organic.
Consequently, the low funding rate and falling open interest suggest that forced liquidations are unlikely, leaving Solana’s price to move according to natural buying and selling activity rather than leverage-driven swings.
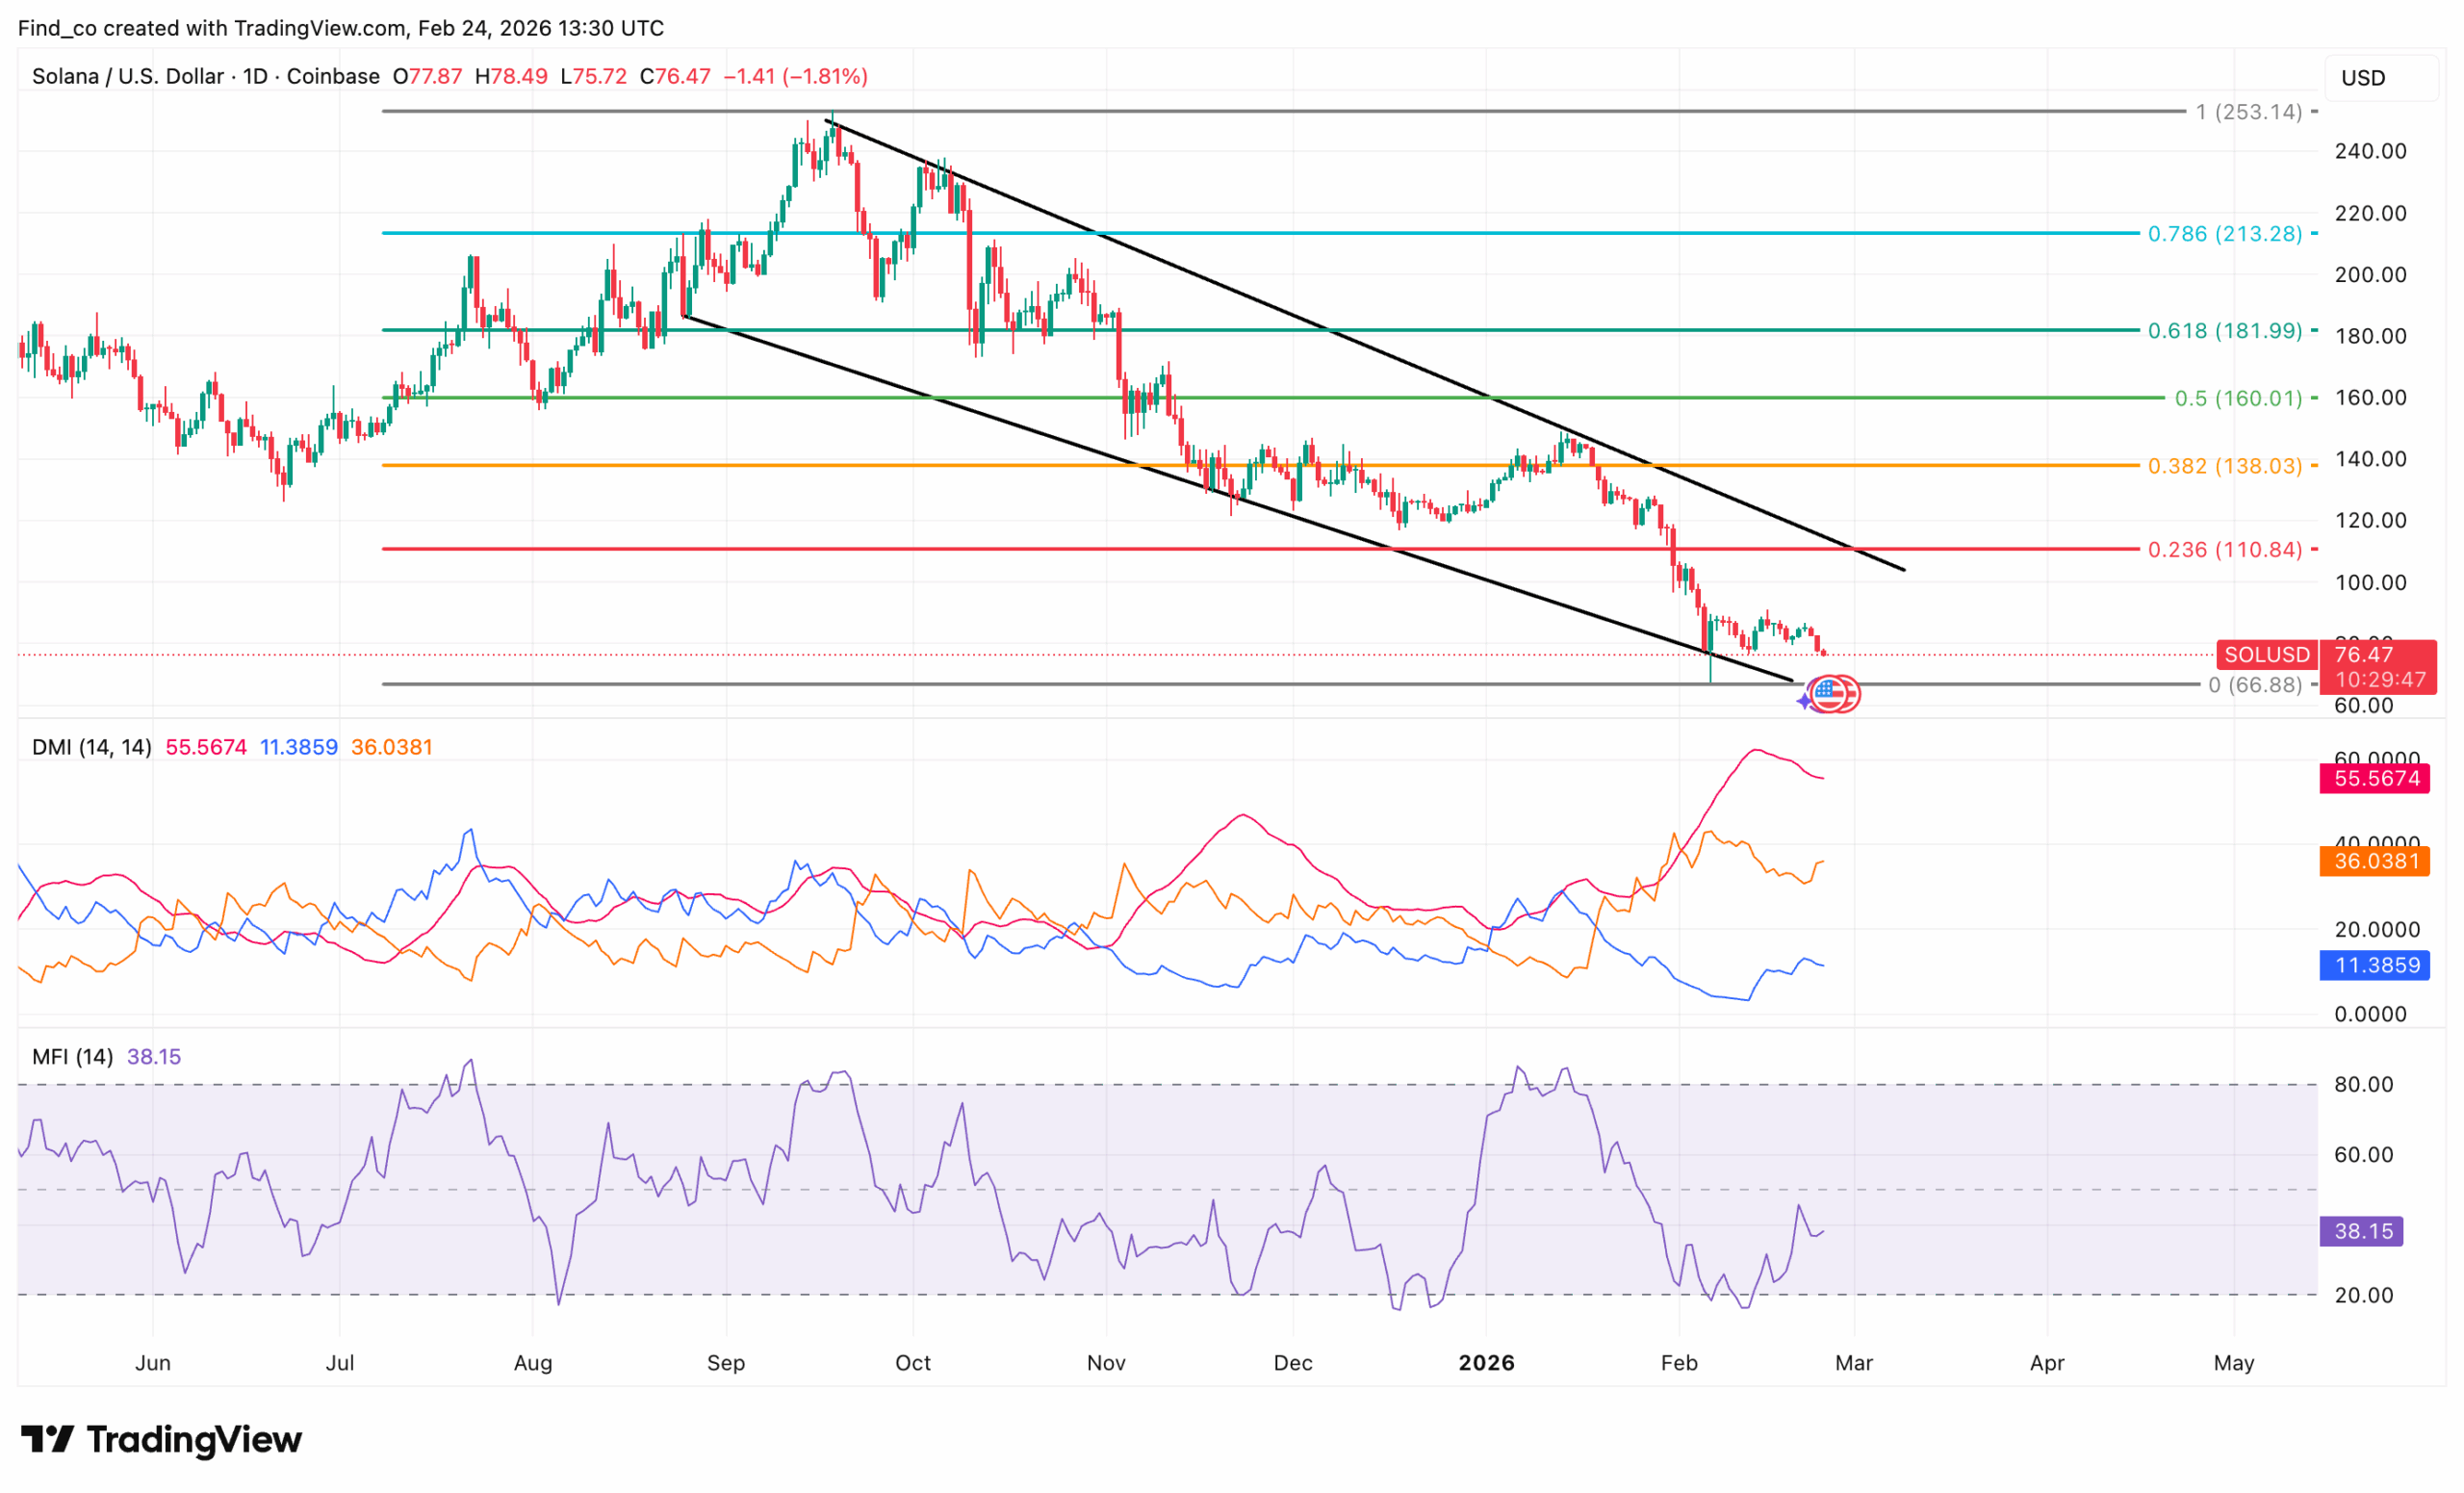
At the same time, on the daily timeframe, Solana’s price remains trapped in a persistent downtrend, struggling to reclaim key levels as price tests $76.50.
Since peaking near $256, SOL has lost nearly 70%, forming a descending channel with lower highs and lower lows.
Immediate resistance stands at $91.21, matching the channel’s upper trendline.
Beyond this, SOL must clear the $100 level before testing the next Fibonacci barrier at $112 (0.236), where sellers have historically stepped in.
On the downside, support near $67 could act as a floor if selling pressure escalates.
Technical indicators reinforce caution. The Directional Movement Index (DMI) signals strong downward pressure, with the negative DMI (red) dominating, while the Money Flow Index (MFI) hovers near 38, suggesting subdued buying activity.
Disclaimer:
The information provided in this article is for informational purposes only. It is not intended to be, nor should it be construed as, financial advice. We do not make any warranties regarding the completeness, reliability, or accuracy of this information. All investments involve risk, and past performance does not guarantee future results. We recommend consulting a financial advisor before making any investment decisions.
Victor Olanrewaju is a crypto analyst and reporter at CCN with deep roots in on-chain research and technical analysis. His crypto journey began in 2017, but it was the 2020 Uniswap airdrop that sparked a full-time pivot into the space.
With a foundation in copywriting, Victor honed his craft creating high-converting content for leading crypto brokers — most notably an XRP price prediction that ranked #1 on Google during the 2021 bull run.
He later joined AMBCrypto in 2022, where he combined storytelling with technical and on-chain analysis to cover key market narratives.
In 2024, he expanded his expertise at BeInCrypto, collaborating with analysts and using tools like Glassnode, Santiment, and IntoTheBlock to break down Bitcoin and altcoin trends.
At CCN, Victor covers the top cryptocurrencies, memecoins, macro shifts, blending real-time insights with deep-dive metrics.
He holds a Bachelor’s degree in Physics from the University of Ibadan, equipping him to simplify complex data for a wide audience. Follow his work or connect on LinkedIn or X.