Solana flips old resistance into support | Credit: Hameem Sarwar
Share
Key Takeaways
Solana has successfully reclaimed the critical $130 support-turned-resistance level
An analyst views $140 as the ultimate pivot point for a macro reversal for SOL.
The daily chart analysis indicates that Solana’s price could potentially trade higher.
The broader cryptocurrency market has finally broken out from a prolonged period of consolidation.
As a result, leading altcoins, such as Solana (SOL), have started the new year on a positive note.
At the time of writing, Solana’s price has reclaimed the critical $130 level after weeks of range-bound and corrective price action.
Additionally, SOL’s trading volume has increased by 35.77% over the past 24 hours. This increase reflects rising interest from buyers.
This move represents a notable shift in short-term market structure, with former resistance now serving as a key support zone.
Buyers are clearly regaining control, and indicators across multiple timeframes suggest that SOL could continue to build on this breakout.
What’s next for Solana’s price? Let’s find out.
Buyers Regain Control Zone
At the time of writing, Solana’s price is confined in an ascending channel. This was after the altcoin refrained from falling below the support at $117.43.
Furthermore, the Relative Strength Index (RSI) provides further evidence of strengthening bullish sentiment.
Get These Top Crypto Casino Offers Now!
Sponsored
Disclosure
We sometimes use affiliate links in our content, when clicking on those we might receive a commission at no extra cost to you. By using this website you agree to our terms and conditions and privacy policy.
On the 4-hour chart, RSI sits at 63.07 just below the overbought threshold, indicating that buying pressure has increased without immediate signs of exhaustion.
Meanwhile, the Moving Average Convergence Divergence (MACD) reinforces the positive bias.
The 12-period EMA (blue) remains above the 26-period EMA (orange), while expanding green histogram bars signal accelerating bullish momentum and potential trend continuation.
At the time of writing, SOL’s price is consolidating above $135. However, with the rising momentum, Solana’s price could surge toward the resistance level near $139.02.
A break above this area could clear the path for SOL to test the $150 mark, opening the door for further upside.
Analyst Predicts Higher Target
In the meantime, several analysts have made predictions. For instance, pseudonymous analyst CryptoRand recently weighed in on Solana’s price action, highlighting a key technical threshold.
Specifically, he noted that a break above $140 would provide the structural confirmation needed to validate a broader uptrend.
According to his analysis, this level represents more than just a psychological barrier; it serves as a critical pivot point that could flip long-term bearish sentiment into a sustained bullish phase.
“SOL breaching the 4 months downtrend resistance here. Push over $140 would confirm the bull reversal,” The analyst noted.
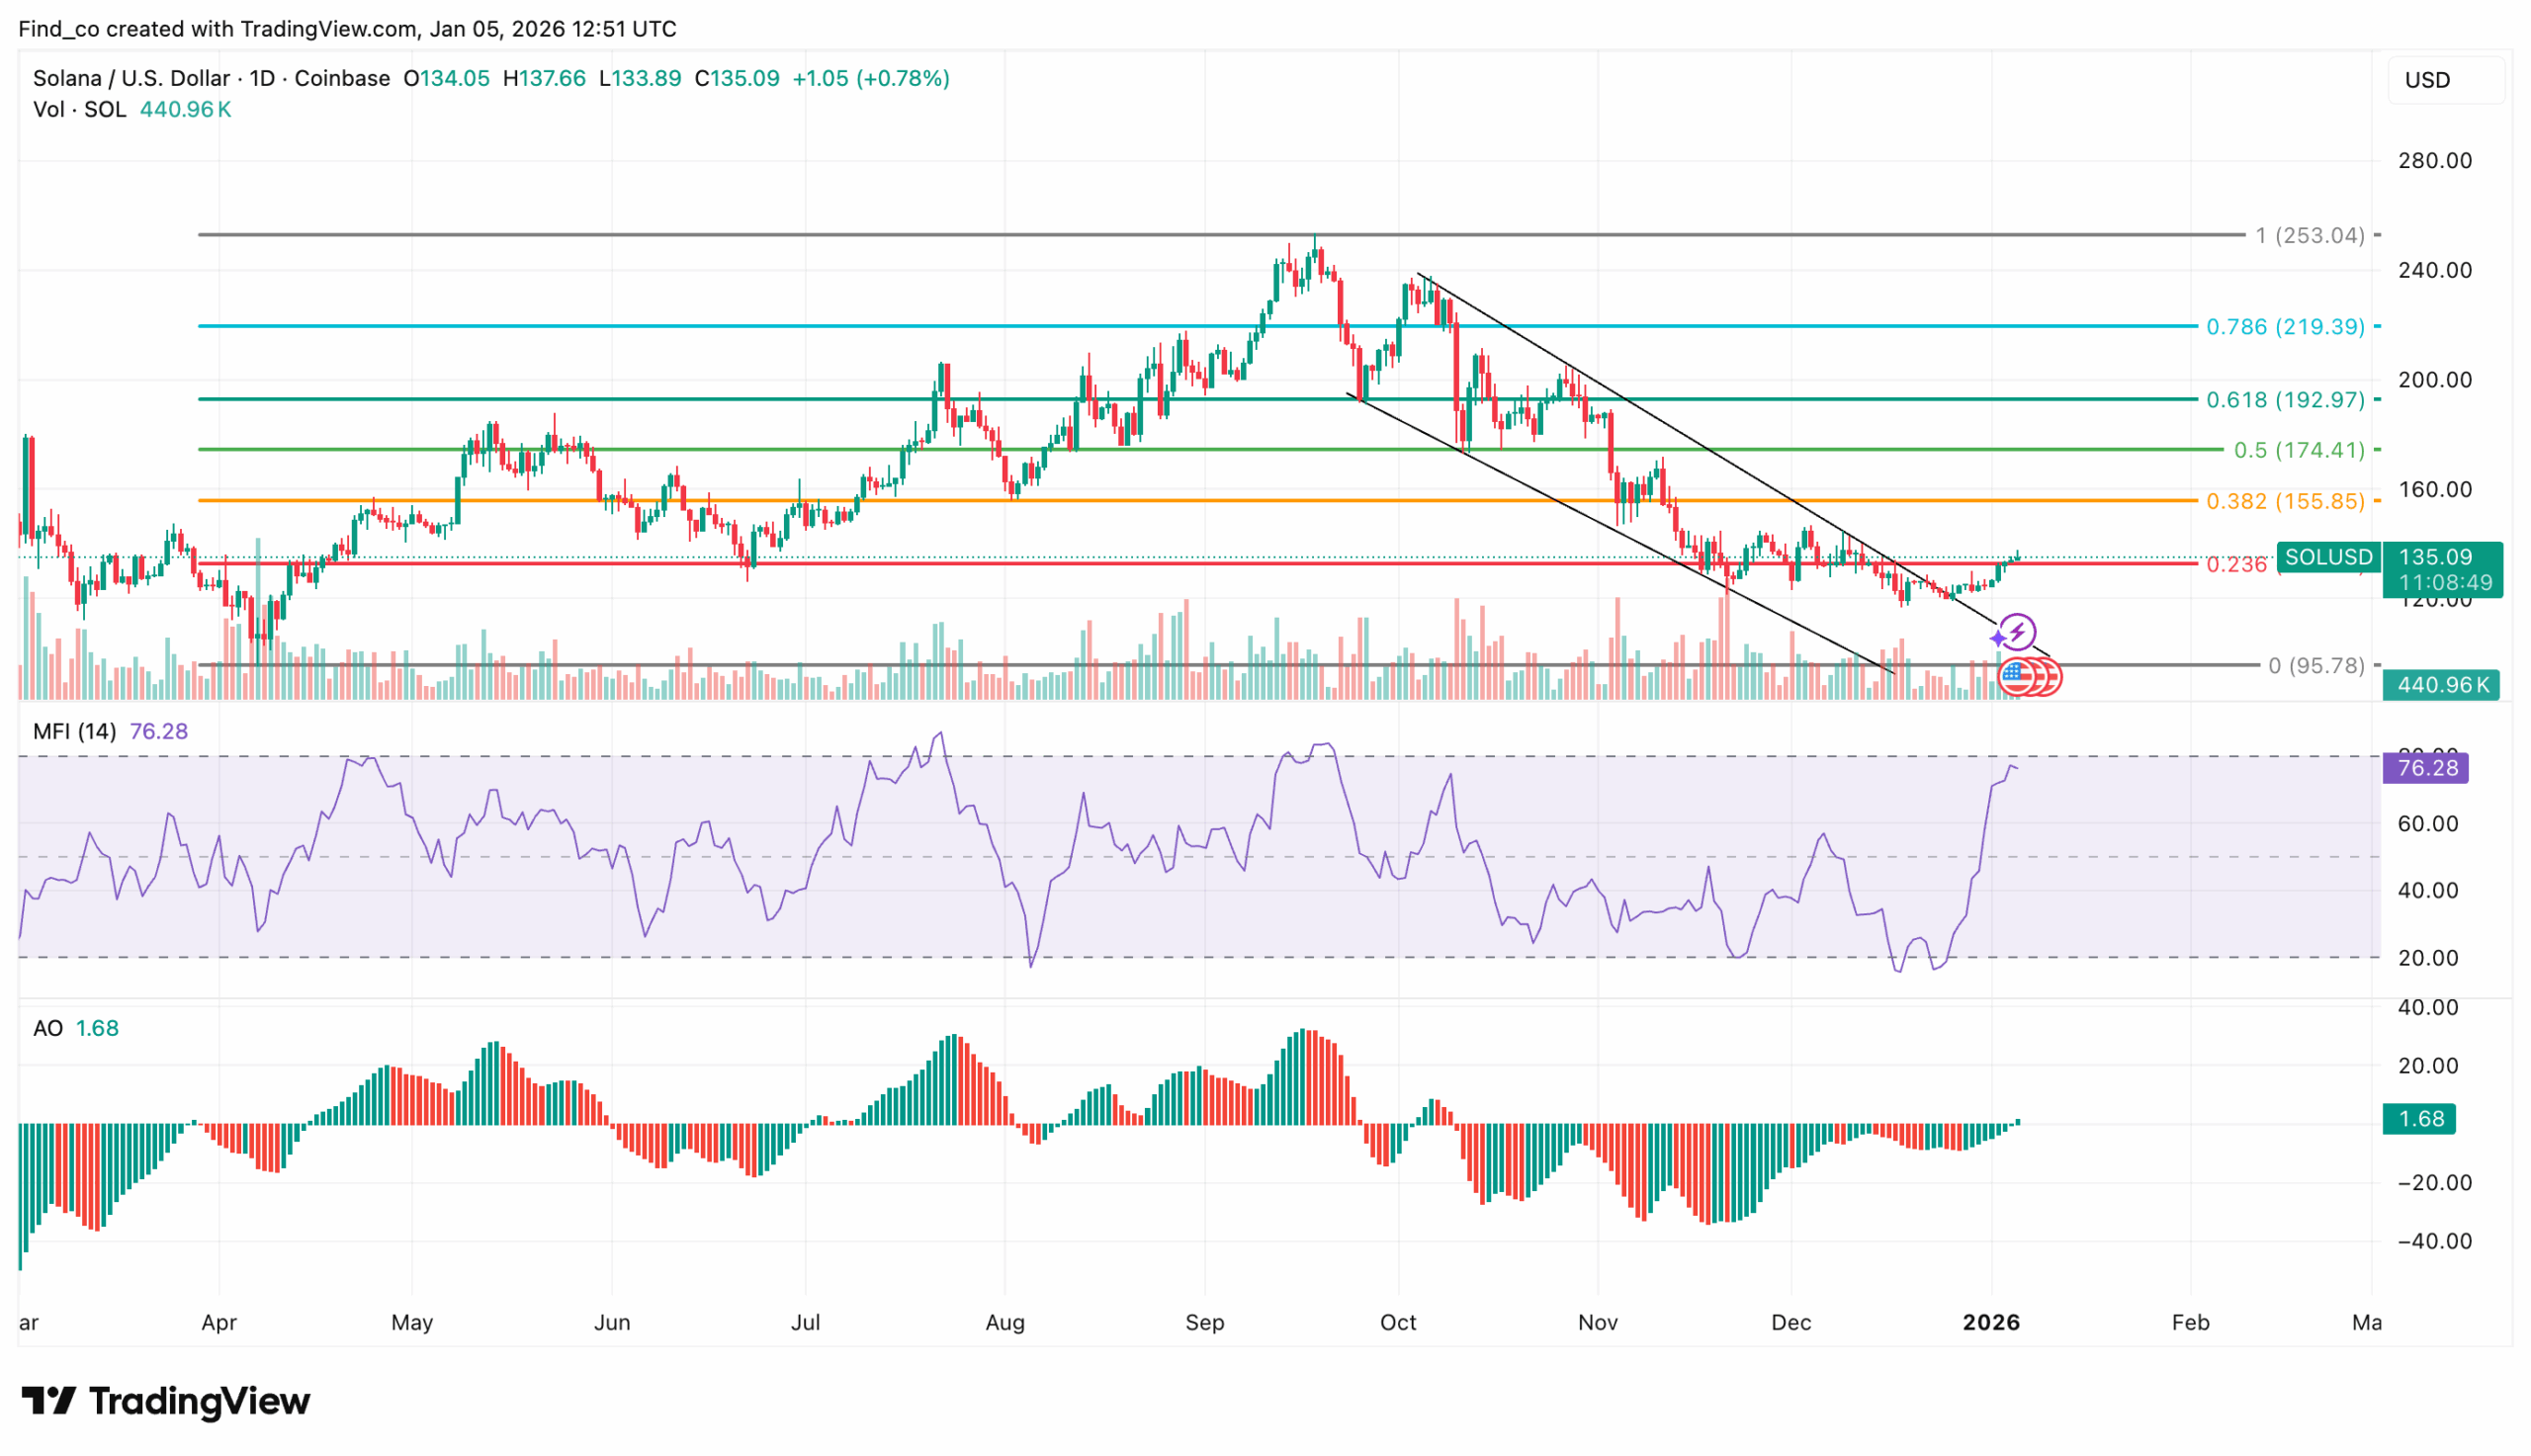
SOL Price Analysis: Setup Remains Bullish
On the daily chart, Solana’s price is trading at $135.09. The Money Flow Index (MFI) is at 76.28, indicating a trend toward overbought territory, which suggests that buying pressure remains strong while also highlighting a short-term risk of exhaustion.
The Awesome Oscillator (AO) has recently flipped into positive territory, signaling a potential shift in momentum toward the bulls.
This development aligns with SOL’s breakout above short-term resistance, confirming that buyers are stepping in with confidence.
Fibonacci retracement levels provide additional clarity on SOL’s potential action.
The price is currently above the 0.236 Fib level and moving toward the next resistance at $146.92, indicating that upside potential remains intact.
Disclaimer:
The information provided in this article is for informational purposes only. It is not intended to be, nor should it be construed as, financial advice. We do not make any warranties regarding the completeness, reliability, or accuracy of this information. All investments involve risk, and past performance does not guarantee future results. We recommend consulting a financial advisor before making any investment decisions.
Victor Olanrewaju is a crypto analyst and reporter at CCN with deep roots in on-chain research and technical analysis. His crypto journey began in 2017, but it was the 2020 Uniswap airdrop that sparked a full-time pivot into the space.
With a foundation in copywriting, Victor honed his craft creating high-converting content for leading crypto brokers — most notably an XRP price prediction that ranked #1 on Google during the 2021 bull run.
He later joined AMBCrypto in 2022, where he combined storytelling with technical and on-chain analysis to cover key market narratives.
In 2024, he expanded his expertise at BeInCrypto, collaborating with analysts and using tools like Glassnode, Santiment, and IntoTheBlock to break down Bitcoin and altcoin trends.
At CCN, Victor covers the top cryptocurrencies, memecoins, macro shifts, blending real-time insights with deep-dive metrics.
He holds a Bachelor’s degree in Physics from the University of Ibadan, equipping him to simplify complex data for a wide audience. Follow his work or connect on LinkedIn or X.