Solana's rally hits a wall at $145 | Credit: Hameem Sarwar
Share
Key Takeaways
SOL is stuck in a post-rally range after repeated rejections in the $145 to $148 zone.
Momentum hasn’t broken, but it’s not strong enough yet to force a move through $150.
Daily signals are cooling, which supports consolidation first unless volume picks up.
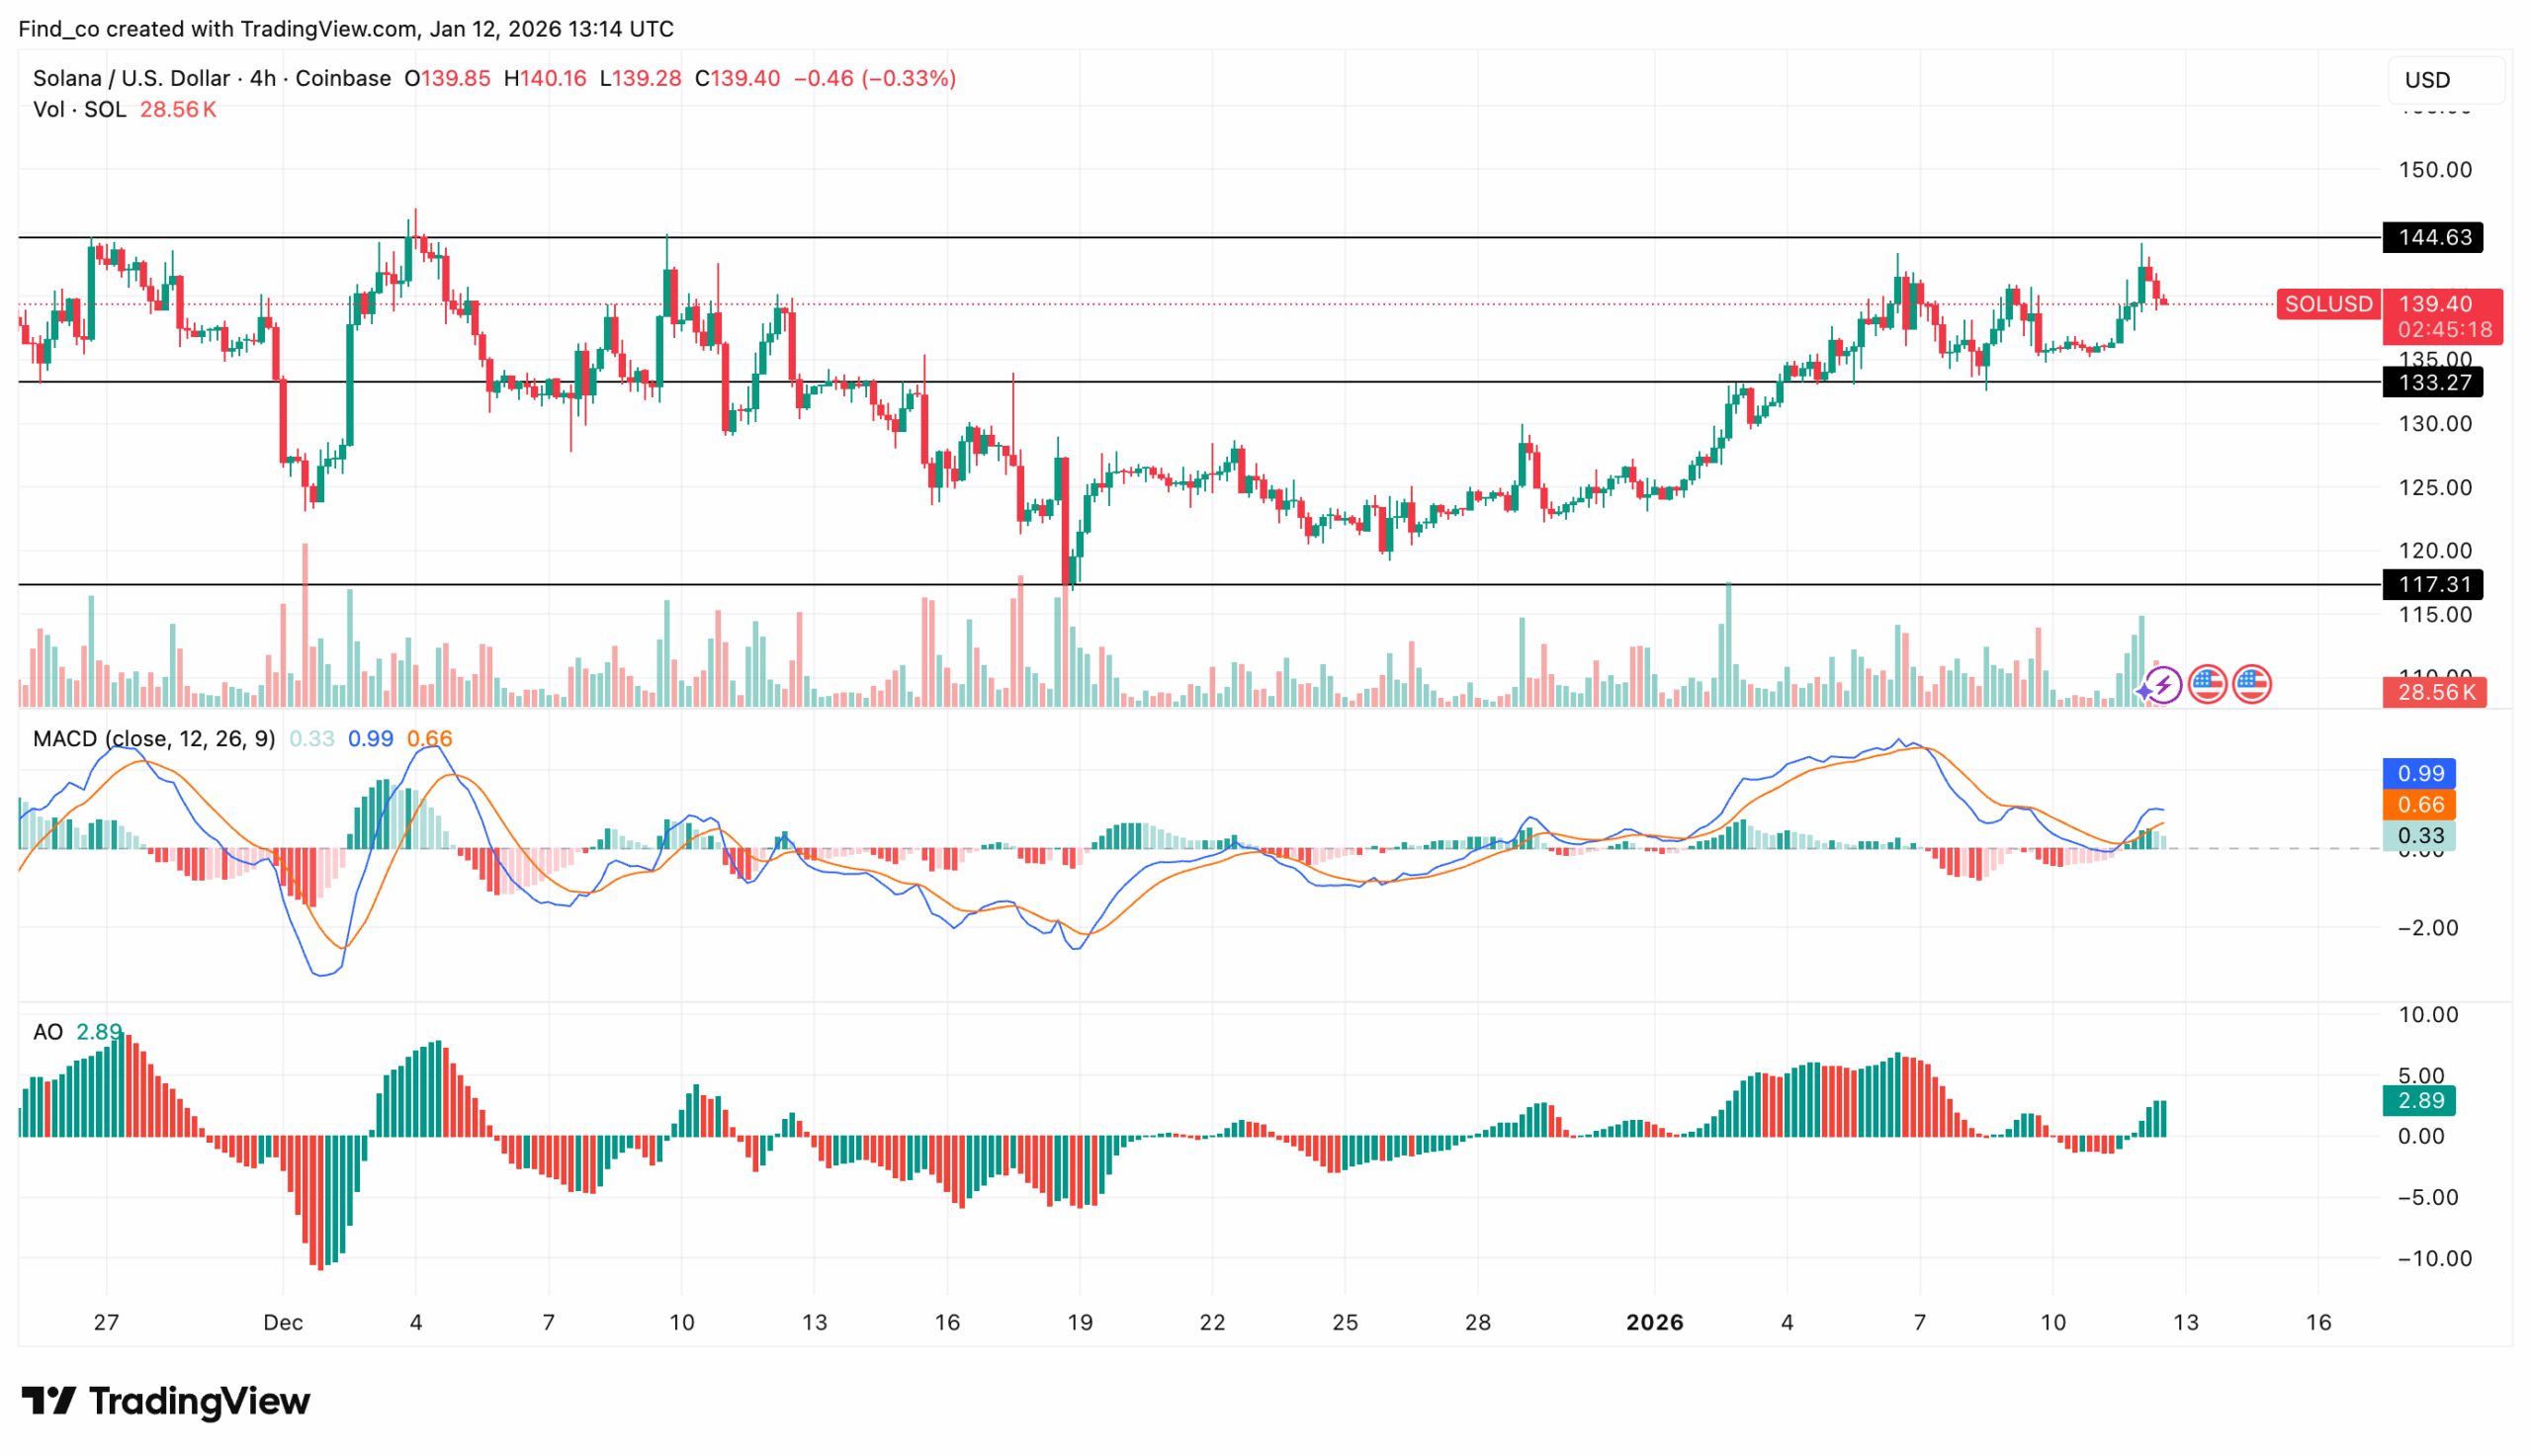
Solana’s (SOL) price has failed to break above the $150 psychological level. As a result, the cryptocurrency has slipped into consolidation after its recent rally stalled near the $145 to $148 resistance zone.
This rejection has kept SOL’s price range-bound in the short term, with bulls and bears fighting for control around $140.
While the broader trend still appears constructive, the lack of follow-through could hinder the uptrend.
The Moving Average Convergence Divergence (MACD) maintains a constructive structure, with the 12-period EMA remaining above the 26-period EMA, while the histogram returns to positive territory.
That suggests bulls are trying to rebuild momentum after the pullback, although buying pressure remains muted.
The Awesome Oscillator (AO) supports that view. At the time of writing, the AO remains positive at 2.88 and continues to print green bars. This indicates that upside momentum has not collapsed, even as the price pauses below the resistance level.
Furthermore, Solana price also continues to respect its rising channel and remains above the $134 to $136 support band.
This zone now serves as the key short-term demand area, as it previously acted as the breakout base. As long as SOL’s price holds above it, the broader uptrend stays intact.
Still, sellers continue to defend the oversupply. Repeated rejections near $144.17 confirm resistance remains active.
Bulls likely need a decisive break and close above $150 to unlock the next leg higher toward the $165 to $170 region.
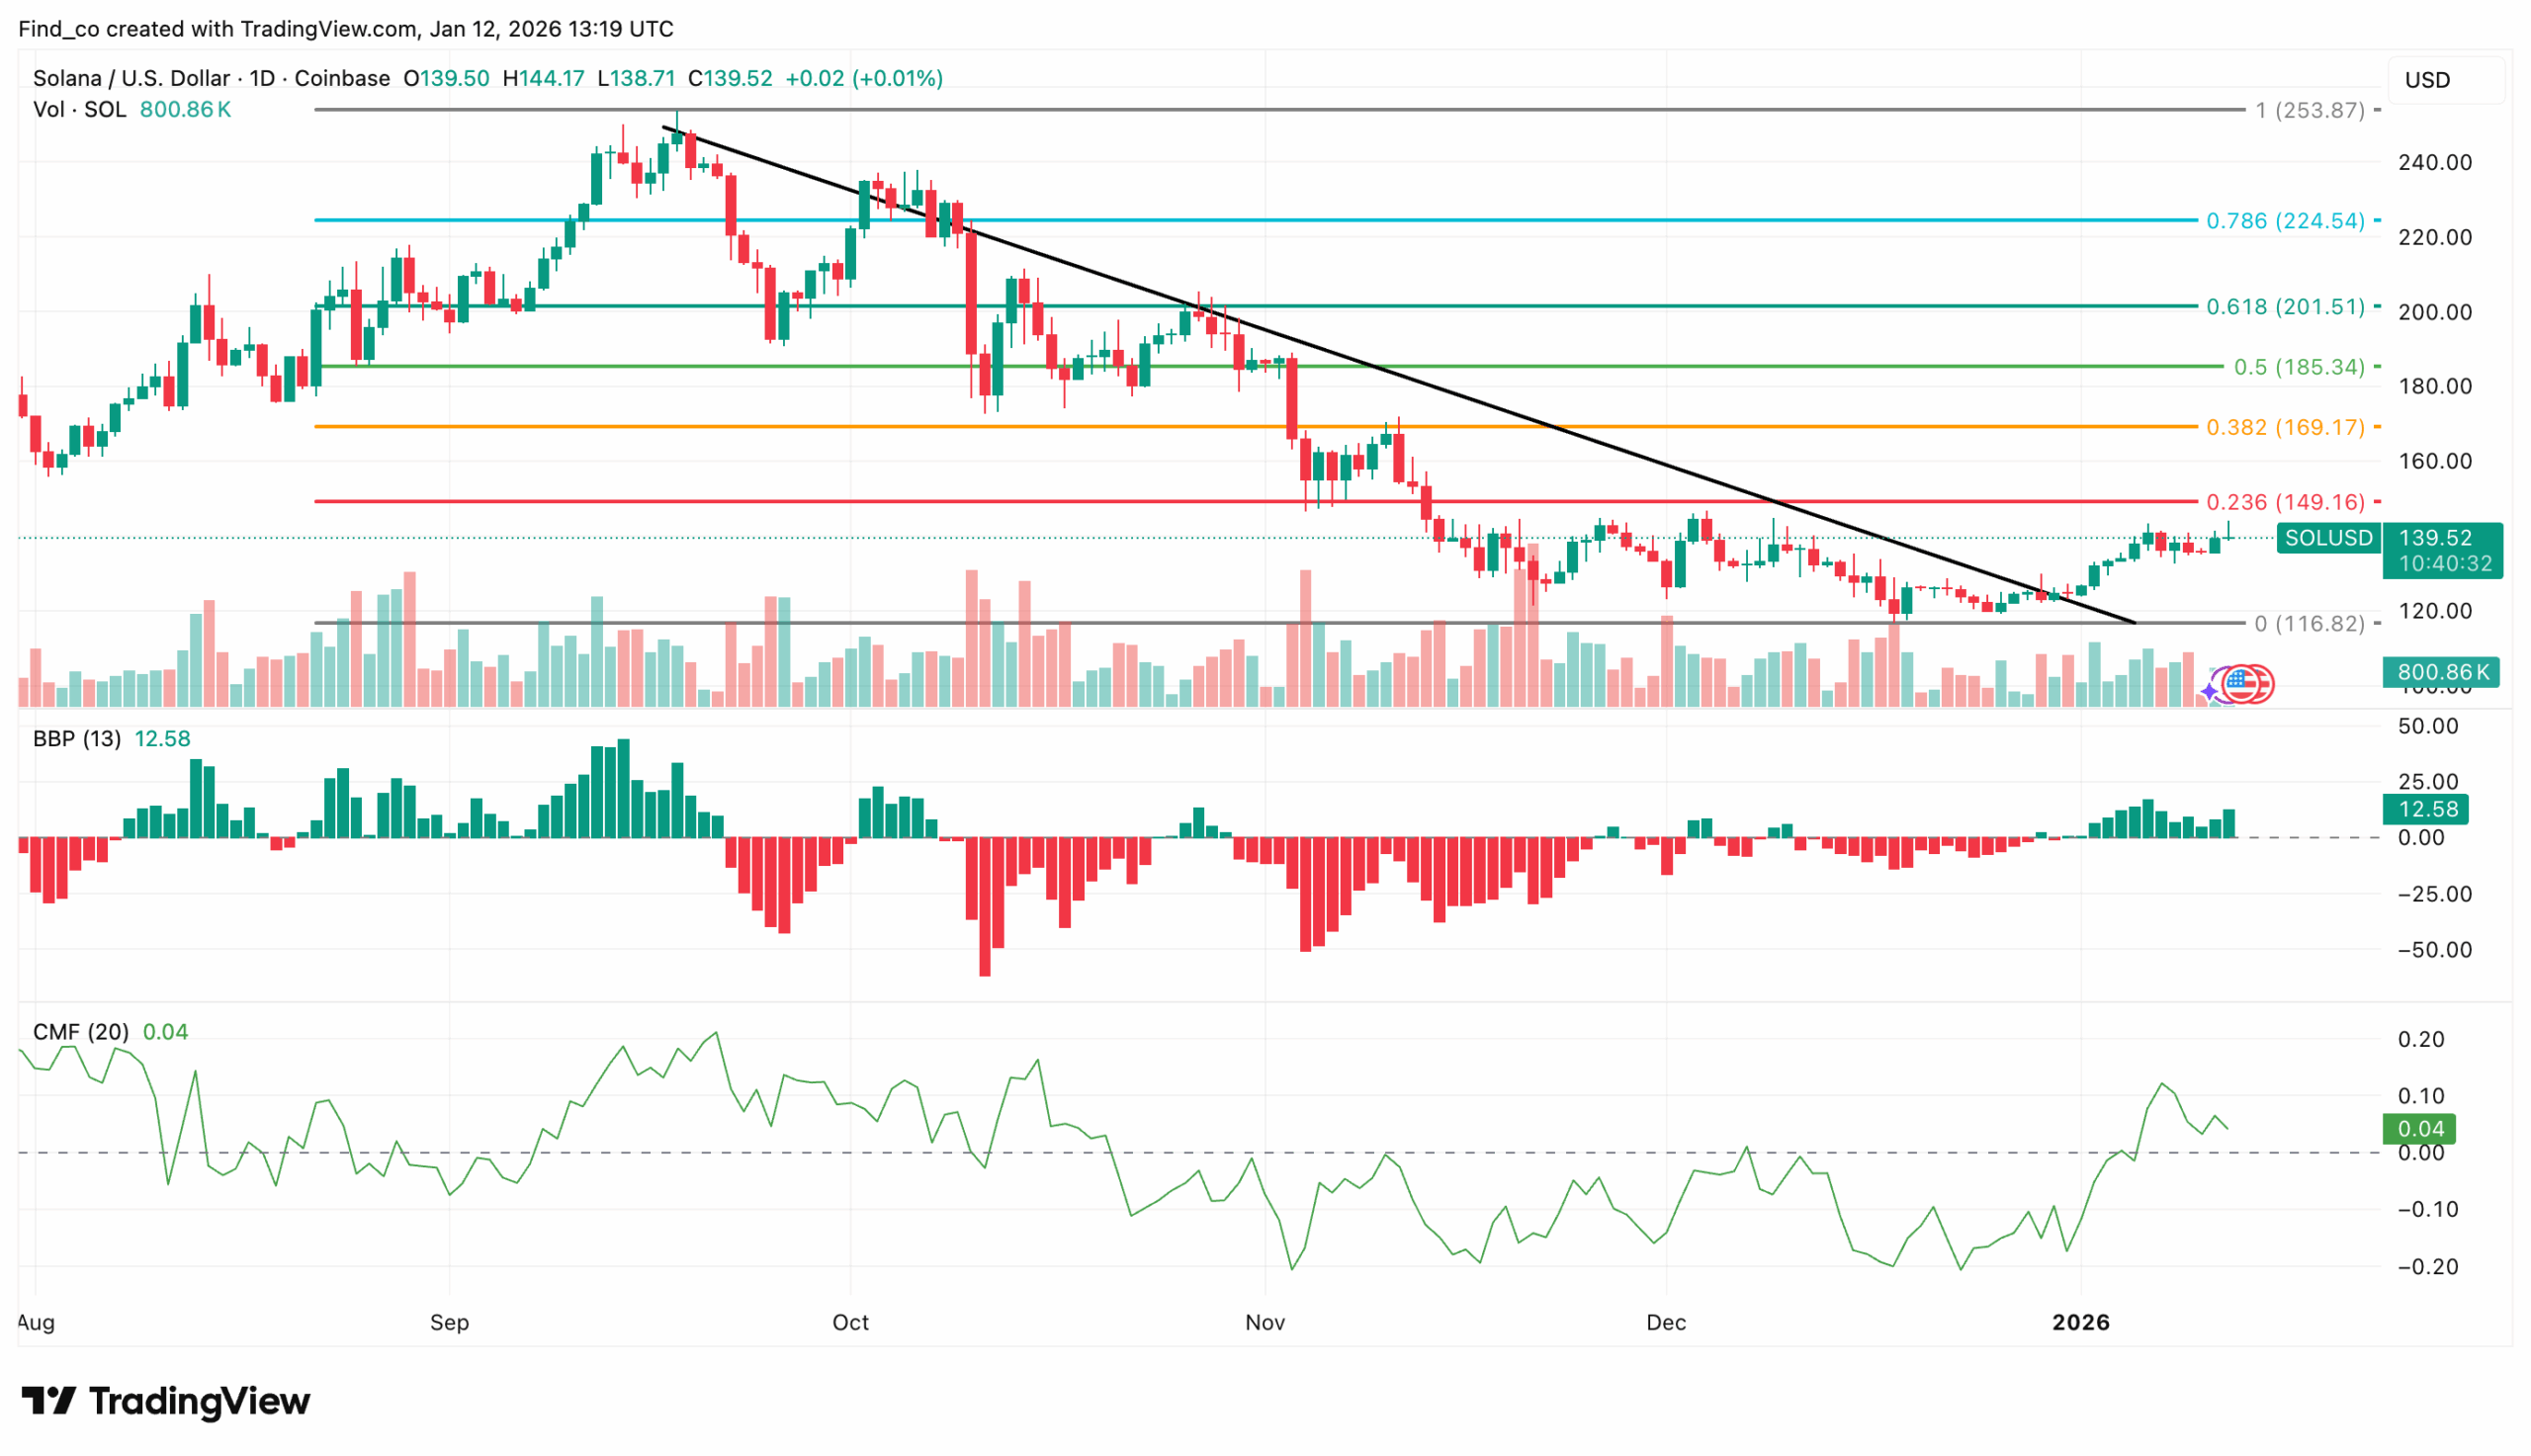
SOL Price Movement Remains Indecisive
On the daily chart, Solana’s price continues to struggle to break through resistance, maintaining consolidation as the dominant theme. Bull-Bear Power (BBP) remains positive, which means buyers still hold the edge.
However, the green bars are shrinking, and that signals that bullish strength is cooling.
At the same time, Chaikin Money Flow (CMF) remains above zero but drifts toward neutral. That points to weakening inflows, even though buyers still maintain a slight advantage.
Fibonacci levels refine the roadmap. At the time of writing, SOL trades around $139.28, sitting just below the 0.236 Fib level, which aligns with near-term resistance.
If SOL breaks below the support level near $135.56, the downside risk increases and could drag the price toward $122.21.
On the other hand, a clean breakout above $149.16 would signal renewed bullish momentum and pave the way for a move toward the next resistance level near $169.17
Disclaimer:
The information provided in this article is for informational purposes only. It is not intended to be, nor should it be construed as, financial advice. We do not make any warranties regarding the completeness, reliability, or accuracy of this information. All investments involve risk, and past performance does not guarantee future results. We recommend consulting a financial advisor before making any investment decisions.
Victor Olanrewaju is a crypto analyst and reporter at CCN with deep roots in on-chain research and technical analysis. His crypto journey began in 2017, but it was the 2020 Uniswap airdrop that sparked a full-time pivot into the space.
With a foundation in copywriting, Victor honed his craft creating high-converting content for leading crypto brokers — most notably an XRP price prediction that ranked #1 on Google during the 2021 bull run.
He later joined AMBCrypto in 2022, where he combined storytelling with technical and on-chain analysis to cover key market narratives.
In 2024, he expanded his expertise at BeInCrypto, collaborating with analysts and using tools like Glassnode, Santiment, and IntoTheBlock to break down Bitcoin and altcoin trends.
At CCN, Victor covers the top cryptocurrencies, memecoins, macro shifts, blending real-time insights with deep-dive metrics.
He holds a Bachelor’s degree in Physics from the University of Ibadan, equipping him to simplify complex data for a wide audience. Follow his work or connect on LinkedIn or X.