SHIB's price is likely to remain range-bound | Credit: Hameem Sarwar
Share
Key Takeaways
SHIB traded between $0.0000053 and $0.0000064 as volatility declined and momentum weakened.
Indicators remain neutral, as lower highs signal that bulls are gradually losing control.
Bearish pressure began to ease; however, SHIB’s price will need to hold $0.0000050.
Shiba Inu (SHIB) has shown clear signs of slowing momentum. The memecoin stopped trending and began to stall within a tightening range.
At the same time, volatility contracted, signaling that a larger move will likely follow.
However, direction remained uncertain. For now, SHIB’s price stayed range-bound, with traders watching closely for a breakout or breakdown.
What’s next?
Bulls Gradually Lose Control
SHIB entered a consolidation phase as price action compressed into a narrow horizontal range. Momentum weakened, and neither bulls nor bears established clear dominance.
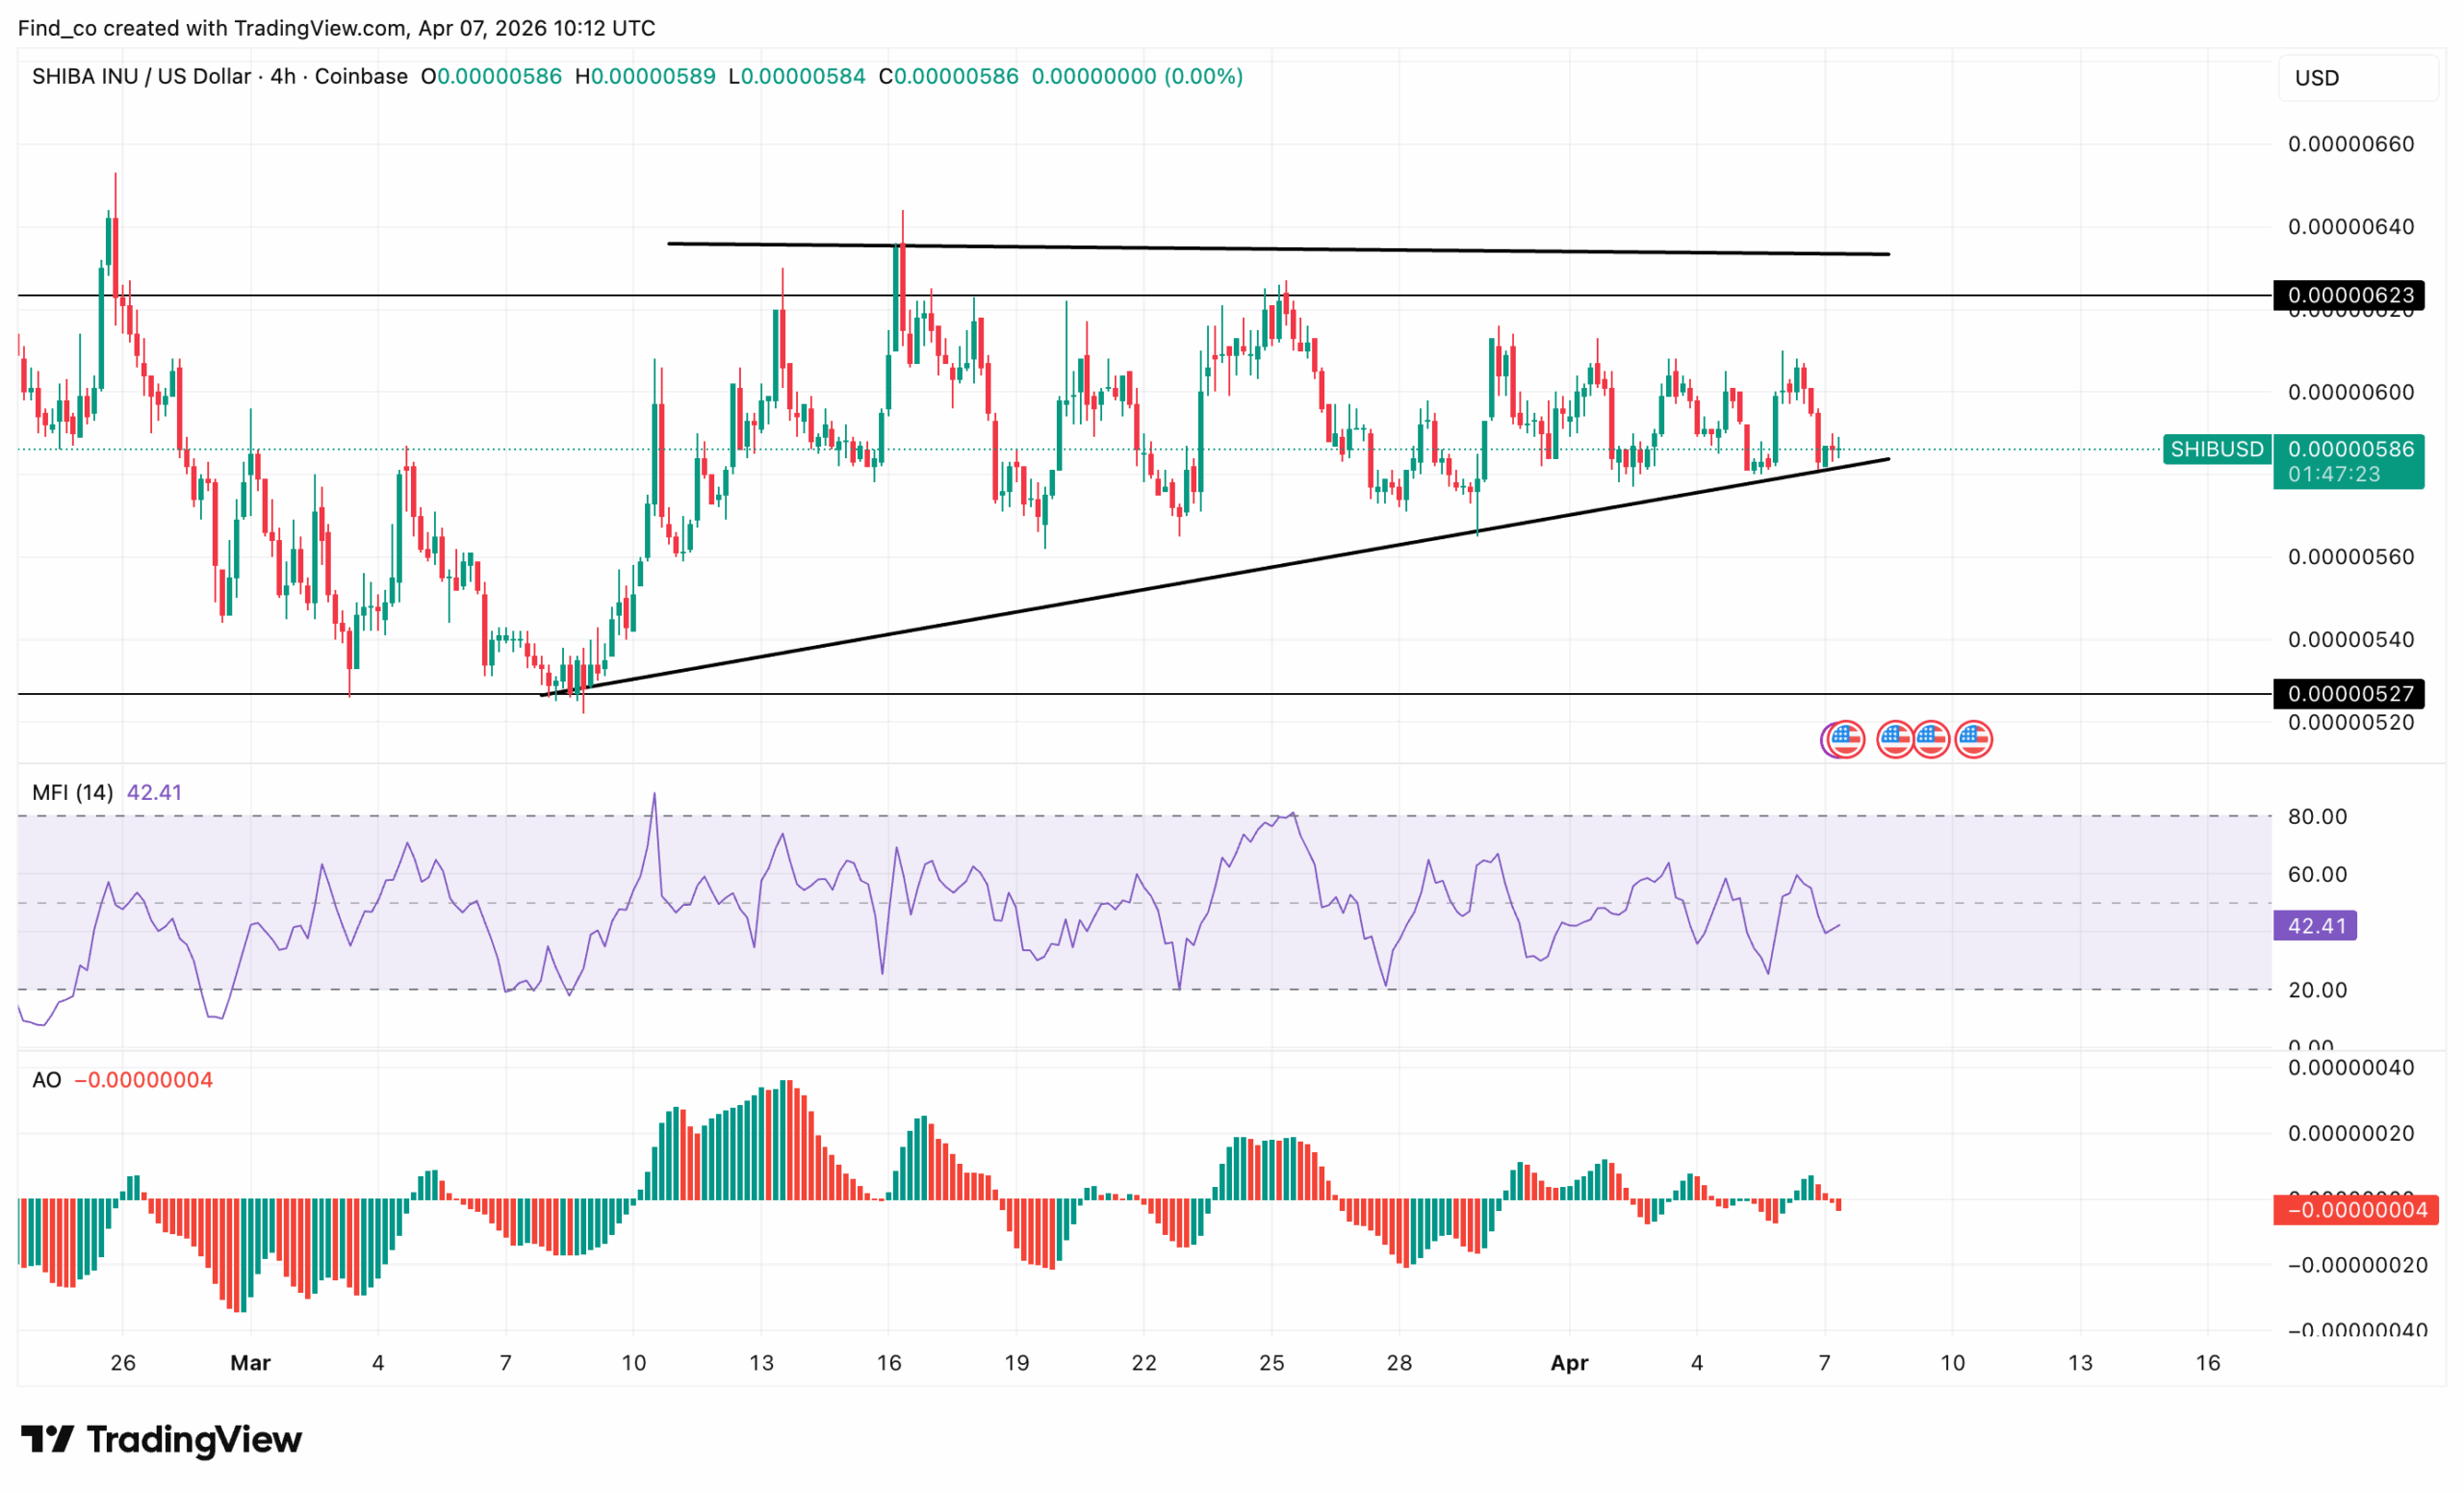
The memecoin traded around $0.0000058, repeatedly reacting between support near $0.0000053–$0.0000054 and resistance around $0.0000063.
This consistent reaction confirmed the presence of a defined trading channel.
At the same time, volatility declined noticeably. Candlestick ranges tightened, and breakout strength faded. As a result, the structure reflected range-bound accumulation rather than trend continuation.
Momentum indicators supported this view.
On the 4-hour chart, the Money Flow Index (MFI) hovered near 40, signaling weak buying pressure. It remained neither oversold nor overbought, reinforcing the lack of conviction.
Meanwhile, the Awesome Oscillator (AO) stayed flat and fluctuated around the zero line.
This behavior indicated low momentum and the absence of a strong directional bias.
Each upward move showed reduced follow-through, confirming that bullish strength had been fading progressively.
Although the range held, the price continued to print slightly lower highs. If support breaks, downside pressure will likely accelerate.
Momentum Shifts Toward Neutral
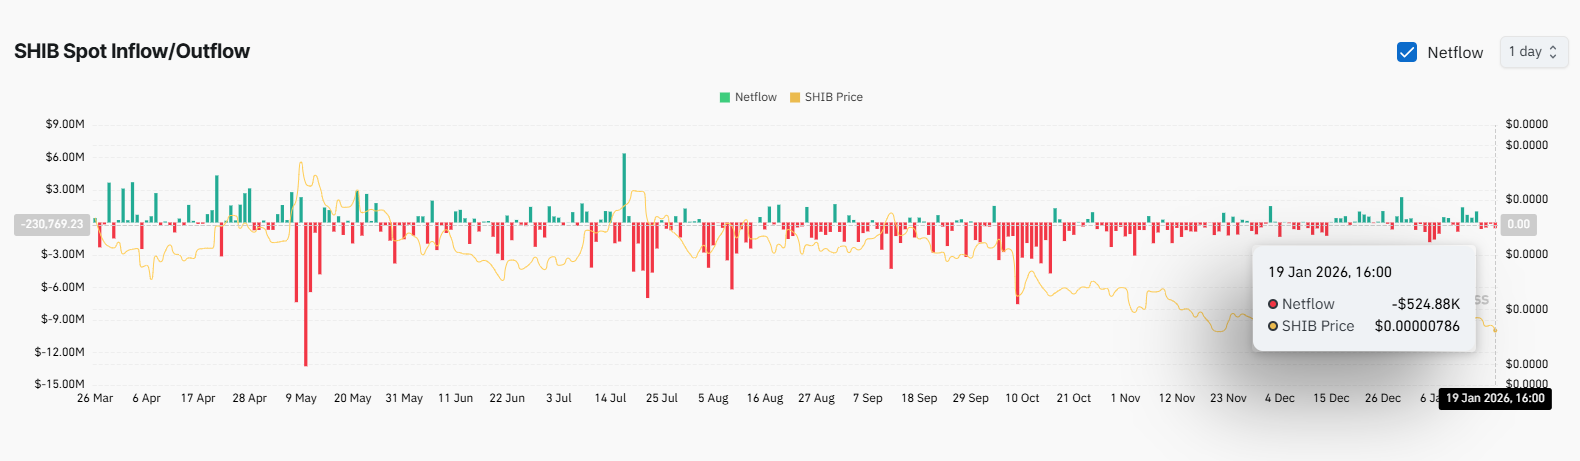
Derivative and flow data reflected a gradual shift in market dynamics. Throughout March, SHIB’s price recorded predominantly negative netflows, confirming sustained outflows aligned with the broader downtrend.
However, the intensity of these outflows declined over time.
Red spikes became less pronounced, indicating that selling pressure had started to ease.
At the same time, intermittent inflows began to appear. These inflows suggested early accumulation, even if still inconsistent.
Moving into April, netflows moved closer to neutral, with occasional positive spikes highlighting tentative buyer interest.
Meanwhile, the price stabilized near local lows. This combination, weakening outflows and emerging inflows, pointed to the early stages of base formation.
Although not yet a confirmed reversal, bearish momentum clearly softened.
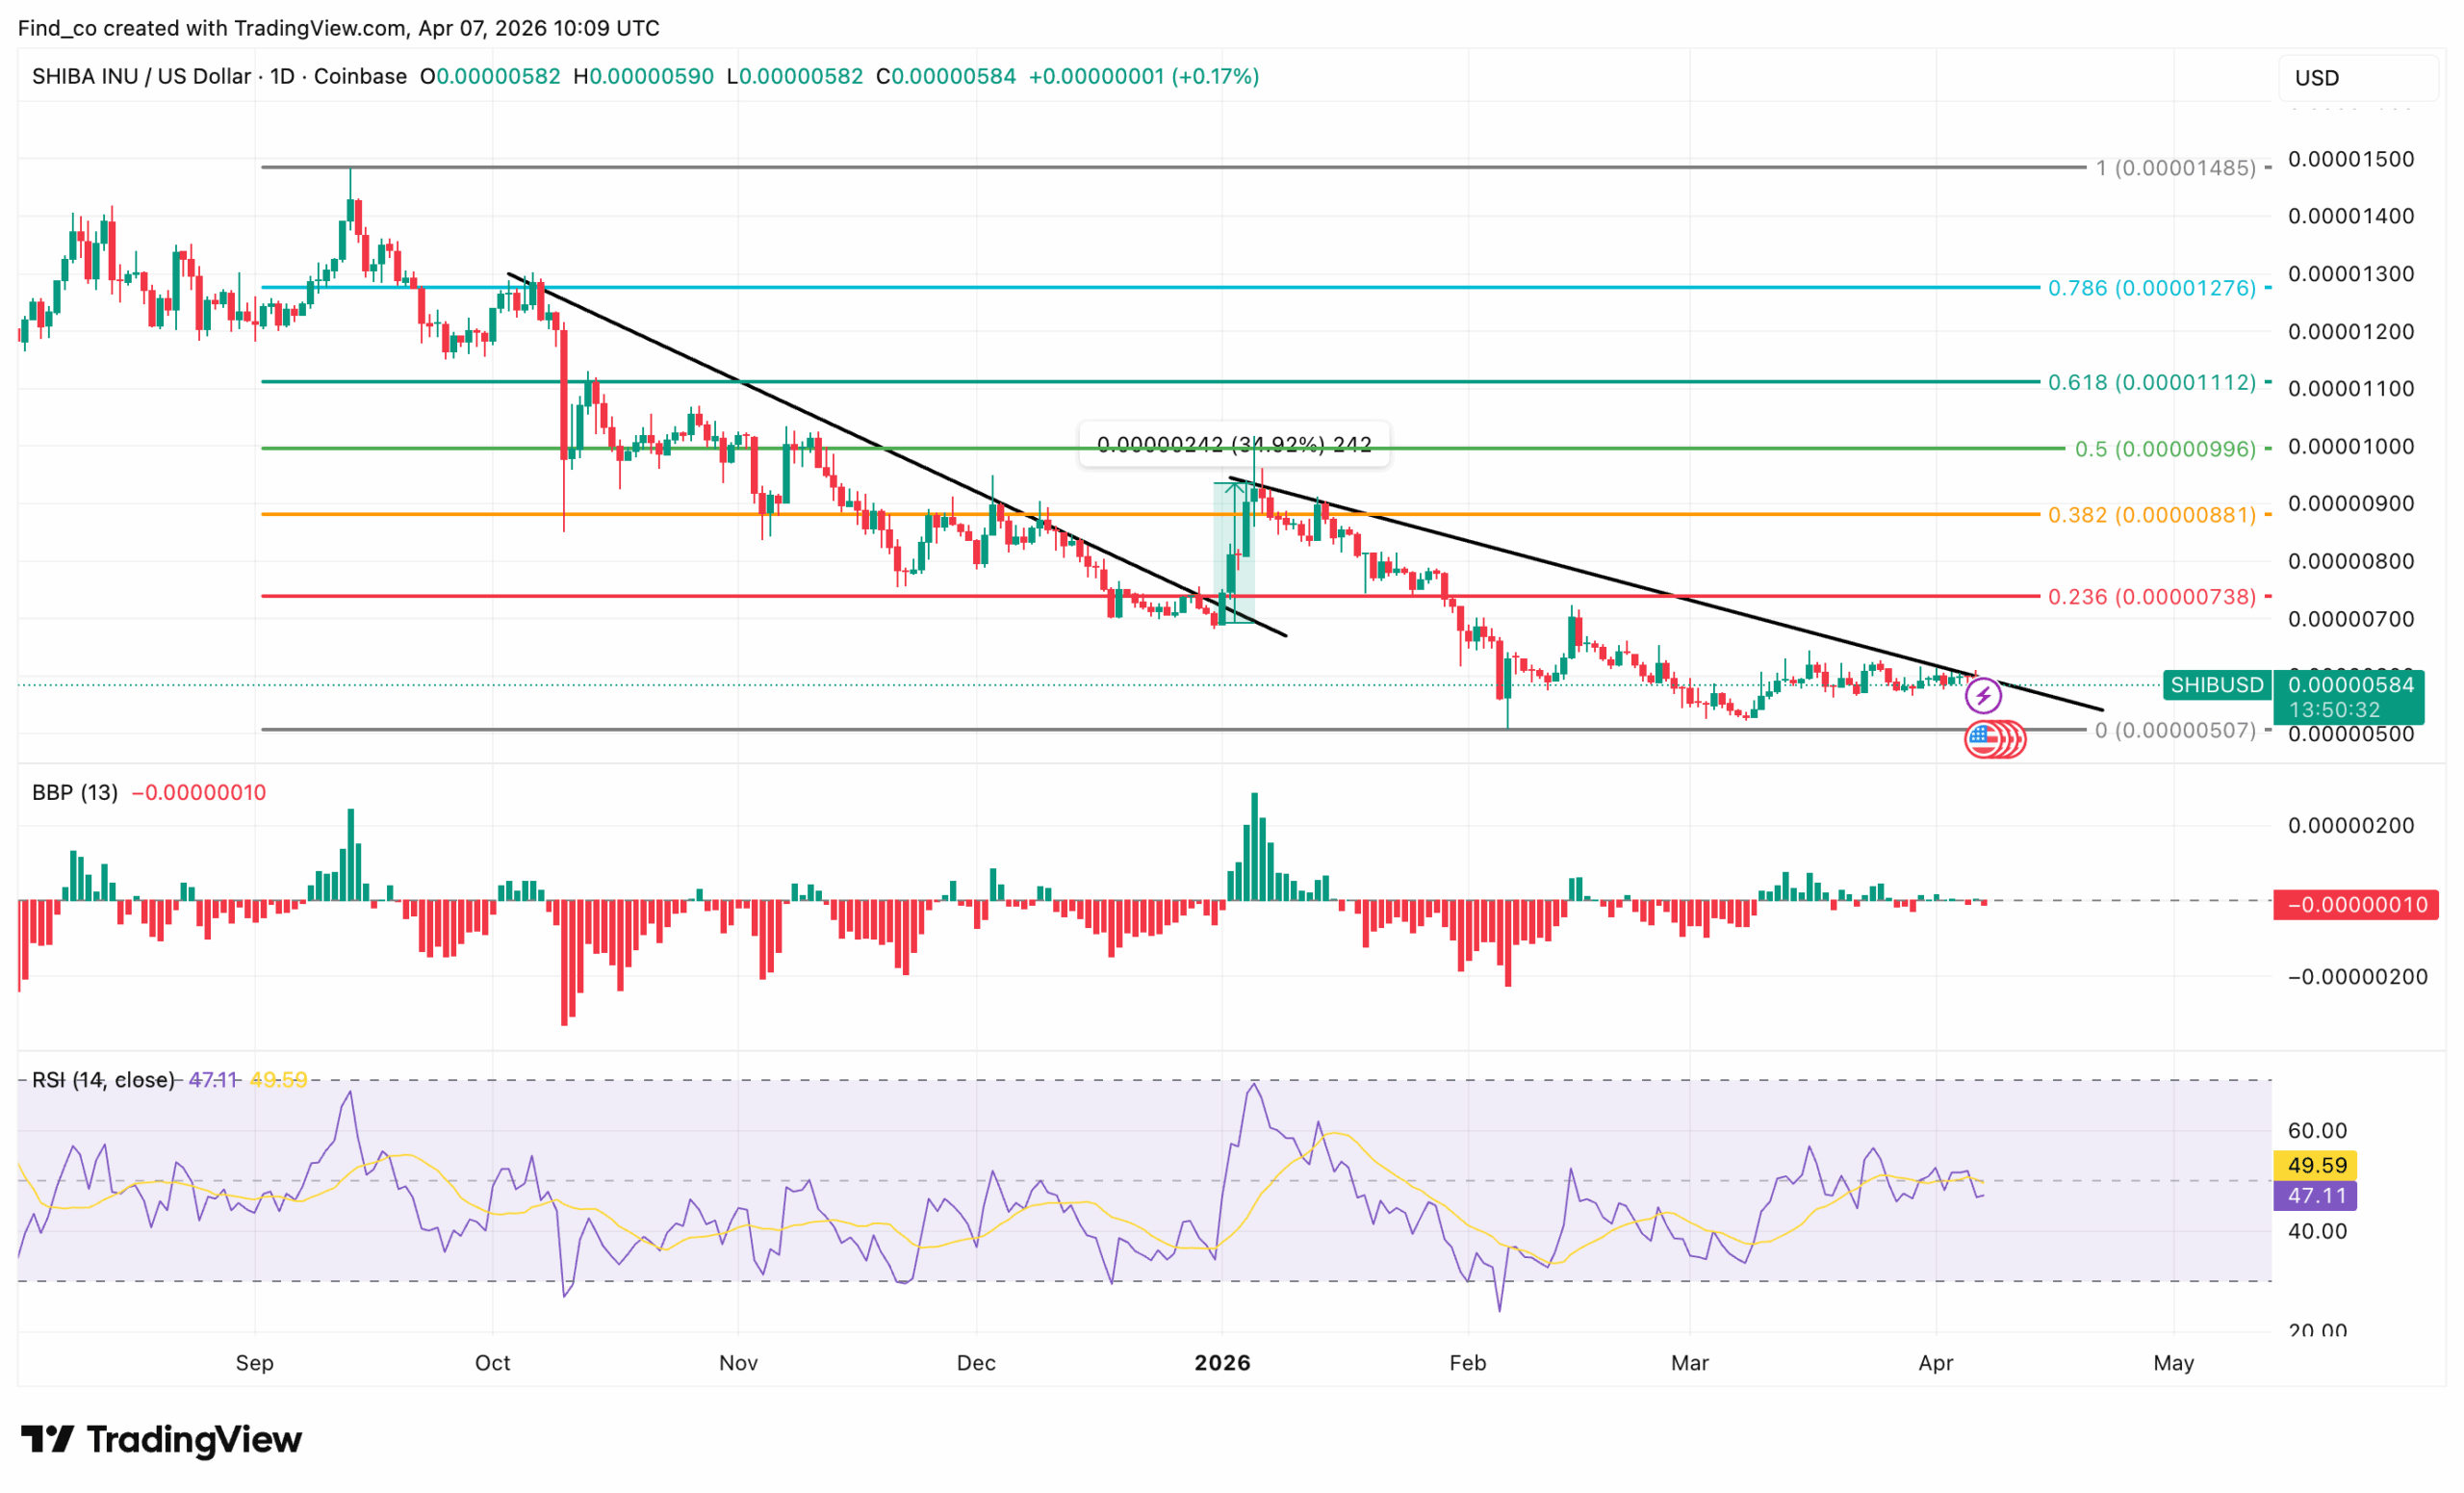
SHIB trades below the 0.236 Fibonacci level near $0.0000059 and failed to reclaim higher resistance zones after repeated rejections at the 0.382 and 0.5 levels.
This kept the overall trend tilted to the downside.
Even so, momentum began to weaken. The Bull Bear Power (BBP) histogram showed diminishing selling pressure, while the Relative Strength Index (RSI) hovers near the midline.
This indicates a growing balance between buyers and sellers.
This shift suggested that downside momentum had slowed, although bullish conviction remained limited.
SHIB Price Outlook: Range Before Direction
SHIB’s price approached a key inflection point. Price consolidated just above the critical $0.0000050 support level, which absorbed recent selling pressure.
If this level holds, SHIB will likely attempt a relief bounce toward $0.0000074. A successful move above the range resistance will signal the start of a stronger recovery phase.
However, if support fails, bearish momentum will likely return. In that case, price will extend losses and revisit lower support zones.
For now, SHIB showed early signs of base formation. However, confirmation remained absent.
Disclaimer:
The information provided in this article is for informational purposes only. It is not intended to be, nor should it be construed as, financial advice. We do not make any warranties regarding the completeness, reliability, or accuracy of this information. All investments involve risk, and past performance does not guarantee future results. We recommend consulting a financial advisor before making any investment decisions.
Victor Olanrewaju is a crypto analyst and reporter at CCN with deep roots in on-chain research and technical analysis. His crypto journey began in 2017, but it was the 2020 Uniswap airdrop that sparked a full-time pivot into the space.
With a foundation in copywriting, Victor honed his craft creating high-converting content for leading crypto brokers — most notably an XRP price prediction that ranked #1 on Google during the 2021 bull run.
He later joined AMBCrypto in 2022, where he combined storytelling with technical and on-chain analysis to cover key market narratives.
In 2024, he expanded his expertise at BeInCrypto, collaborating with analysts and using tools like Glassnode, Santiment, and IntoTheBlock to break down Bitcoin and altcoin trends.
At CCN, Victor covers the top cryptocurrencies, memecoins, macro shifts, blending real-time insights with deep-dive metrics.
He holds a Bachelor’s degree in Physics from the University of Ibadan, equipping him to simplify complex data for a wide audience. Follow his work or connect on LinkedIn or X.