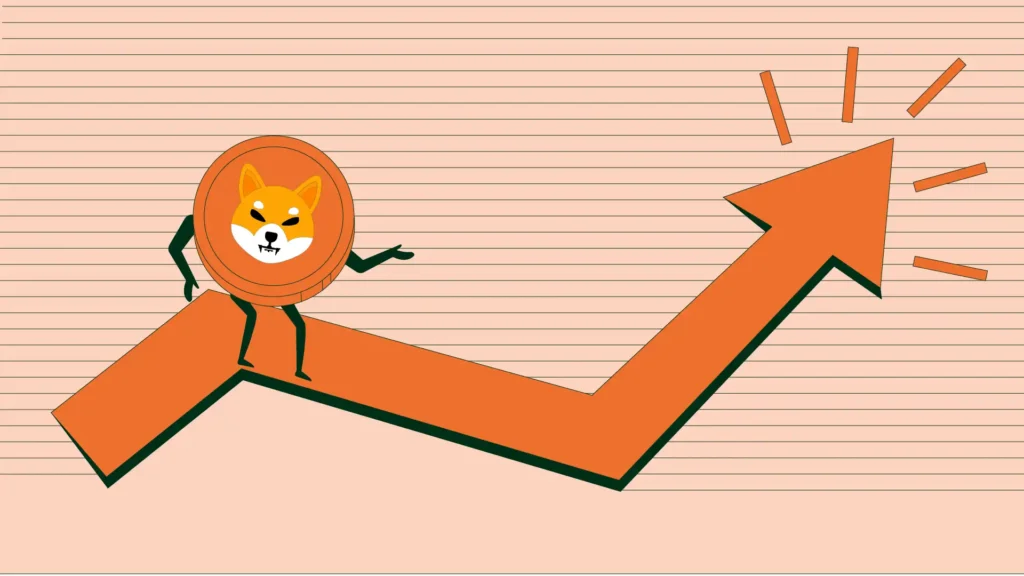
SHIB starts 2026 with a 16% surge | Credit: Hameem Sarwar
Share
Key Takeaways
SHIB has broken above its bearish trend, gaining roughly 17% in the first week of 2026.
Despite a minor rejection, the rally remains intact as SHIB holds above the 20 EMA.
Here is how a successful flip of the $0.0000099 could trigger a rally toward $0.000012.
After nearly 90 days of relentless downward pressure, Shiba Inu (SHIB) is finally biting back.
At the time of writing, the Shiba Inu price has officially broken above the bearish trendline that began around Oct. 6.
This breakout signals a potential shift in the memecoin’s structure and has caught the attention of the broader market.
While the breakout offers a breath of fresh air for the SHIB Army, the rally faces a critical test. Here are the key levels to watch and what could be next for SHIB’s price.
Shiba Inu Barks Back
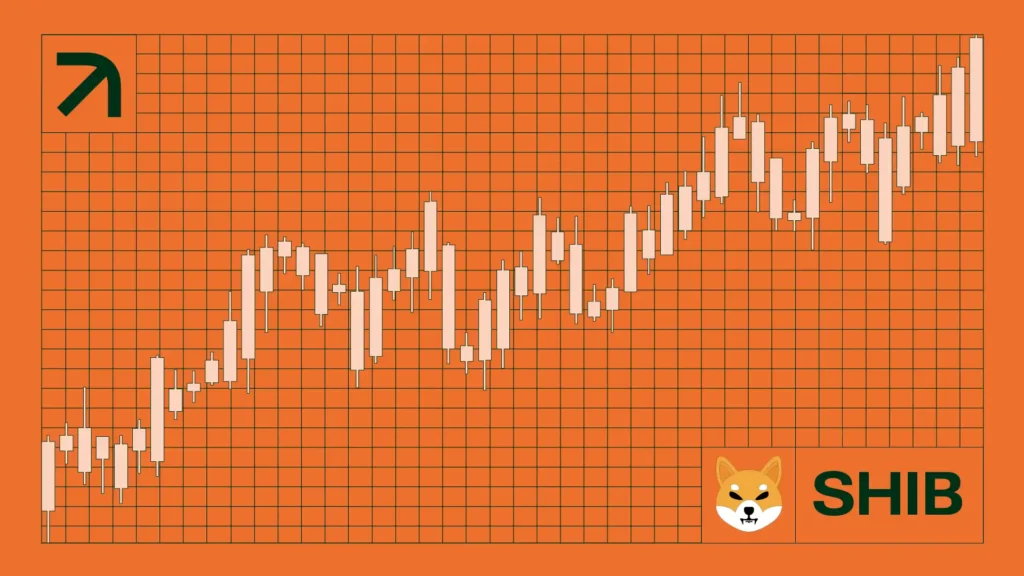
Over the last seven days, the Shiba Inu price has increased by 16.83%. This development has driven the cryptocurrency’s value to $0.0000087.
According to the 4-hour chart, SHIB’s price was able to reclaim this level after it broke out of a falling wedge.
As seen below, the memecoin had previously risked declining below the support at $0.0000076. At some point, the support at $0.0000070 was at risk.
However, bulls ensured that this crash did not happen. Since Jan. 1, SHIB buyers have taken control as indicated by the Bull Bear Power (BBP).
Consequently, the lack of an overheated MVRV ratio supports the ongoing rally. If the trend follows historical patterns, SHIB could continue its uptrend until the ratio reaches the double-digit “danger zone.”
SHIB Price Forecast: More Room to Rise
On the daily chart, SHIB recently broke above a bearish trendline that had been in place since October.
Currently, the Chaikin Money Flow (CMF) is approaching the zero signal line, indicating that selling pressure is finally waning.
While buyers have not yet seized complete control, the green Supertrend line is flashing a bullish signal. This indicator suggests that the market is poised to challenge the immediate resistance.
One critical level to watch is $0.0000099, which aligns with the 0.382 Fibonacci level.
This specific price point could make or mar SHIB’s next move. If buying pressure increases enough to flip this resistance into support, the token could rally toward a target of $0.000012.
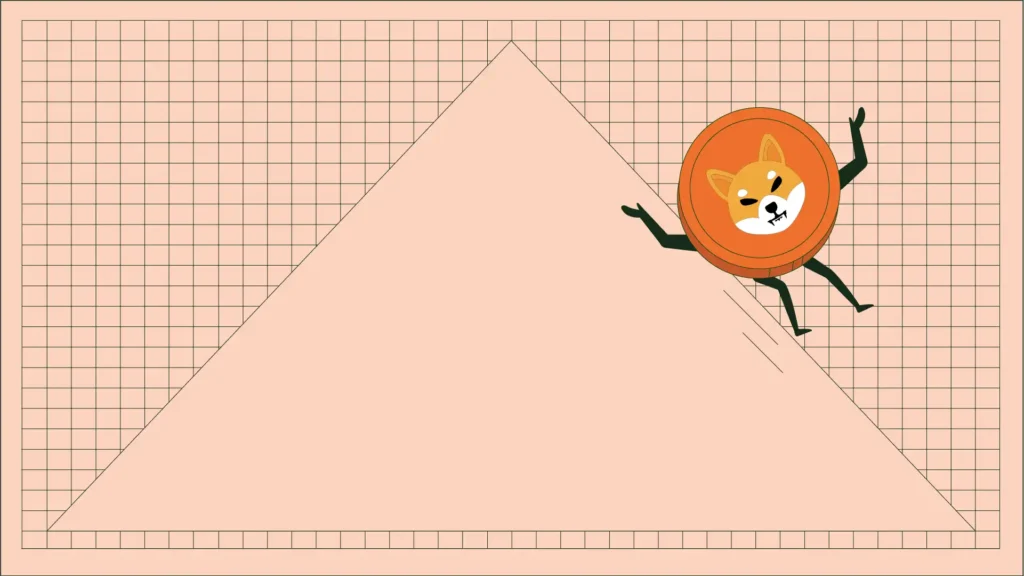
However, if bears regain their grip at this level, the bullish thesis will likely fail. In that case, SHIB’s market value could decline back to $0.0000075.
Disclaimer:
The information provided in this article is for informational purposes only. It is not intended to be, nor should it be construed as, financial advice. We do not make any warranties regarding the completeness, reliability, or accuracy of this information. All investments involve risk, and past performance does not guarantee future results. We recommend consulting a financial advisor before making any investment decisions.
Victor Olanrewaju is a crypto analyst and reporter at CCN with deep roots in on-chain research and technical analysis. His crypto journey began in 2017, but it was the 2020 Uniswap airdrop that sparked a full-time pivot into the space.
With a foundation in copywriting, Victor honed his craft creating high-converting content for leading crypto brokers — most notably an XRP price prediction that ranked #1 on Google during the 2021 bull run.
He later joined AMBCrypto in 2022, where he combined storytelling with technical and on-chain analysis to cover key market narratives.
In 2024, he expanded his expertise at BeInCrypto, collaborating with analysts and using tools like Glassnode, Santiment, and IntoTheBlock to break down Bitcoin and altcoin trends.
At CCN, Victor covers the top cryptocurrencies, memecoins, macro shifts, blending real-time insights with deep-dive metrics.
He holds a Bachelor’s degree in Physics from the University of Ibadan, equipping him to simplify complex data for a wide audience. Follow his work or connect on LinkedIn or X.