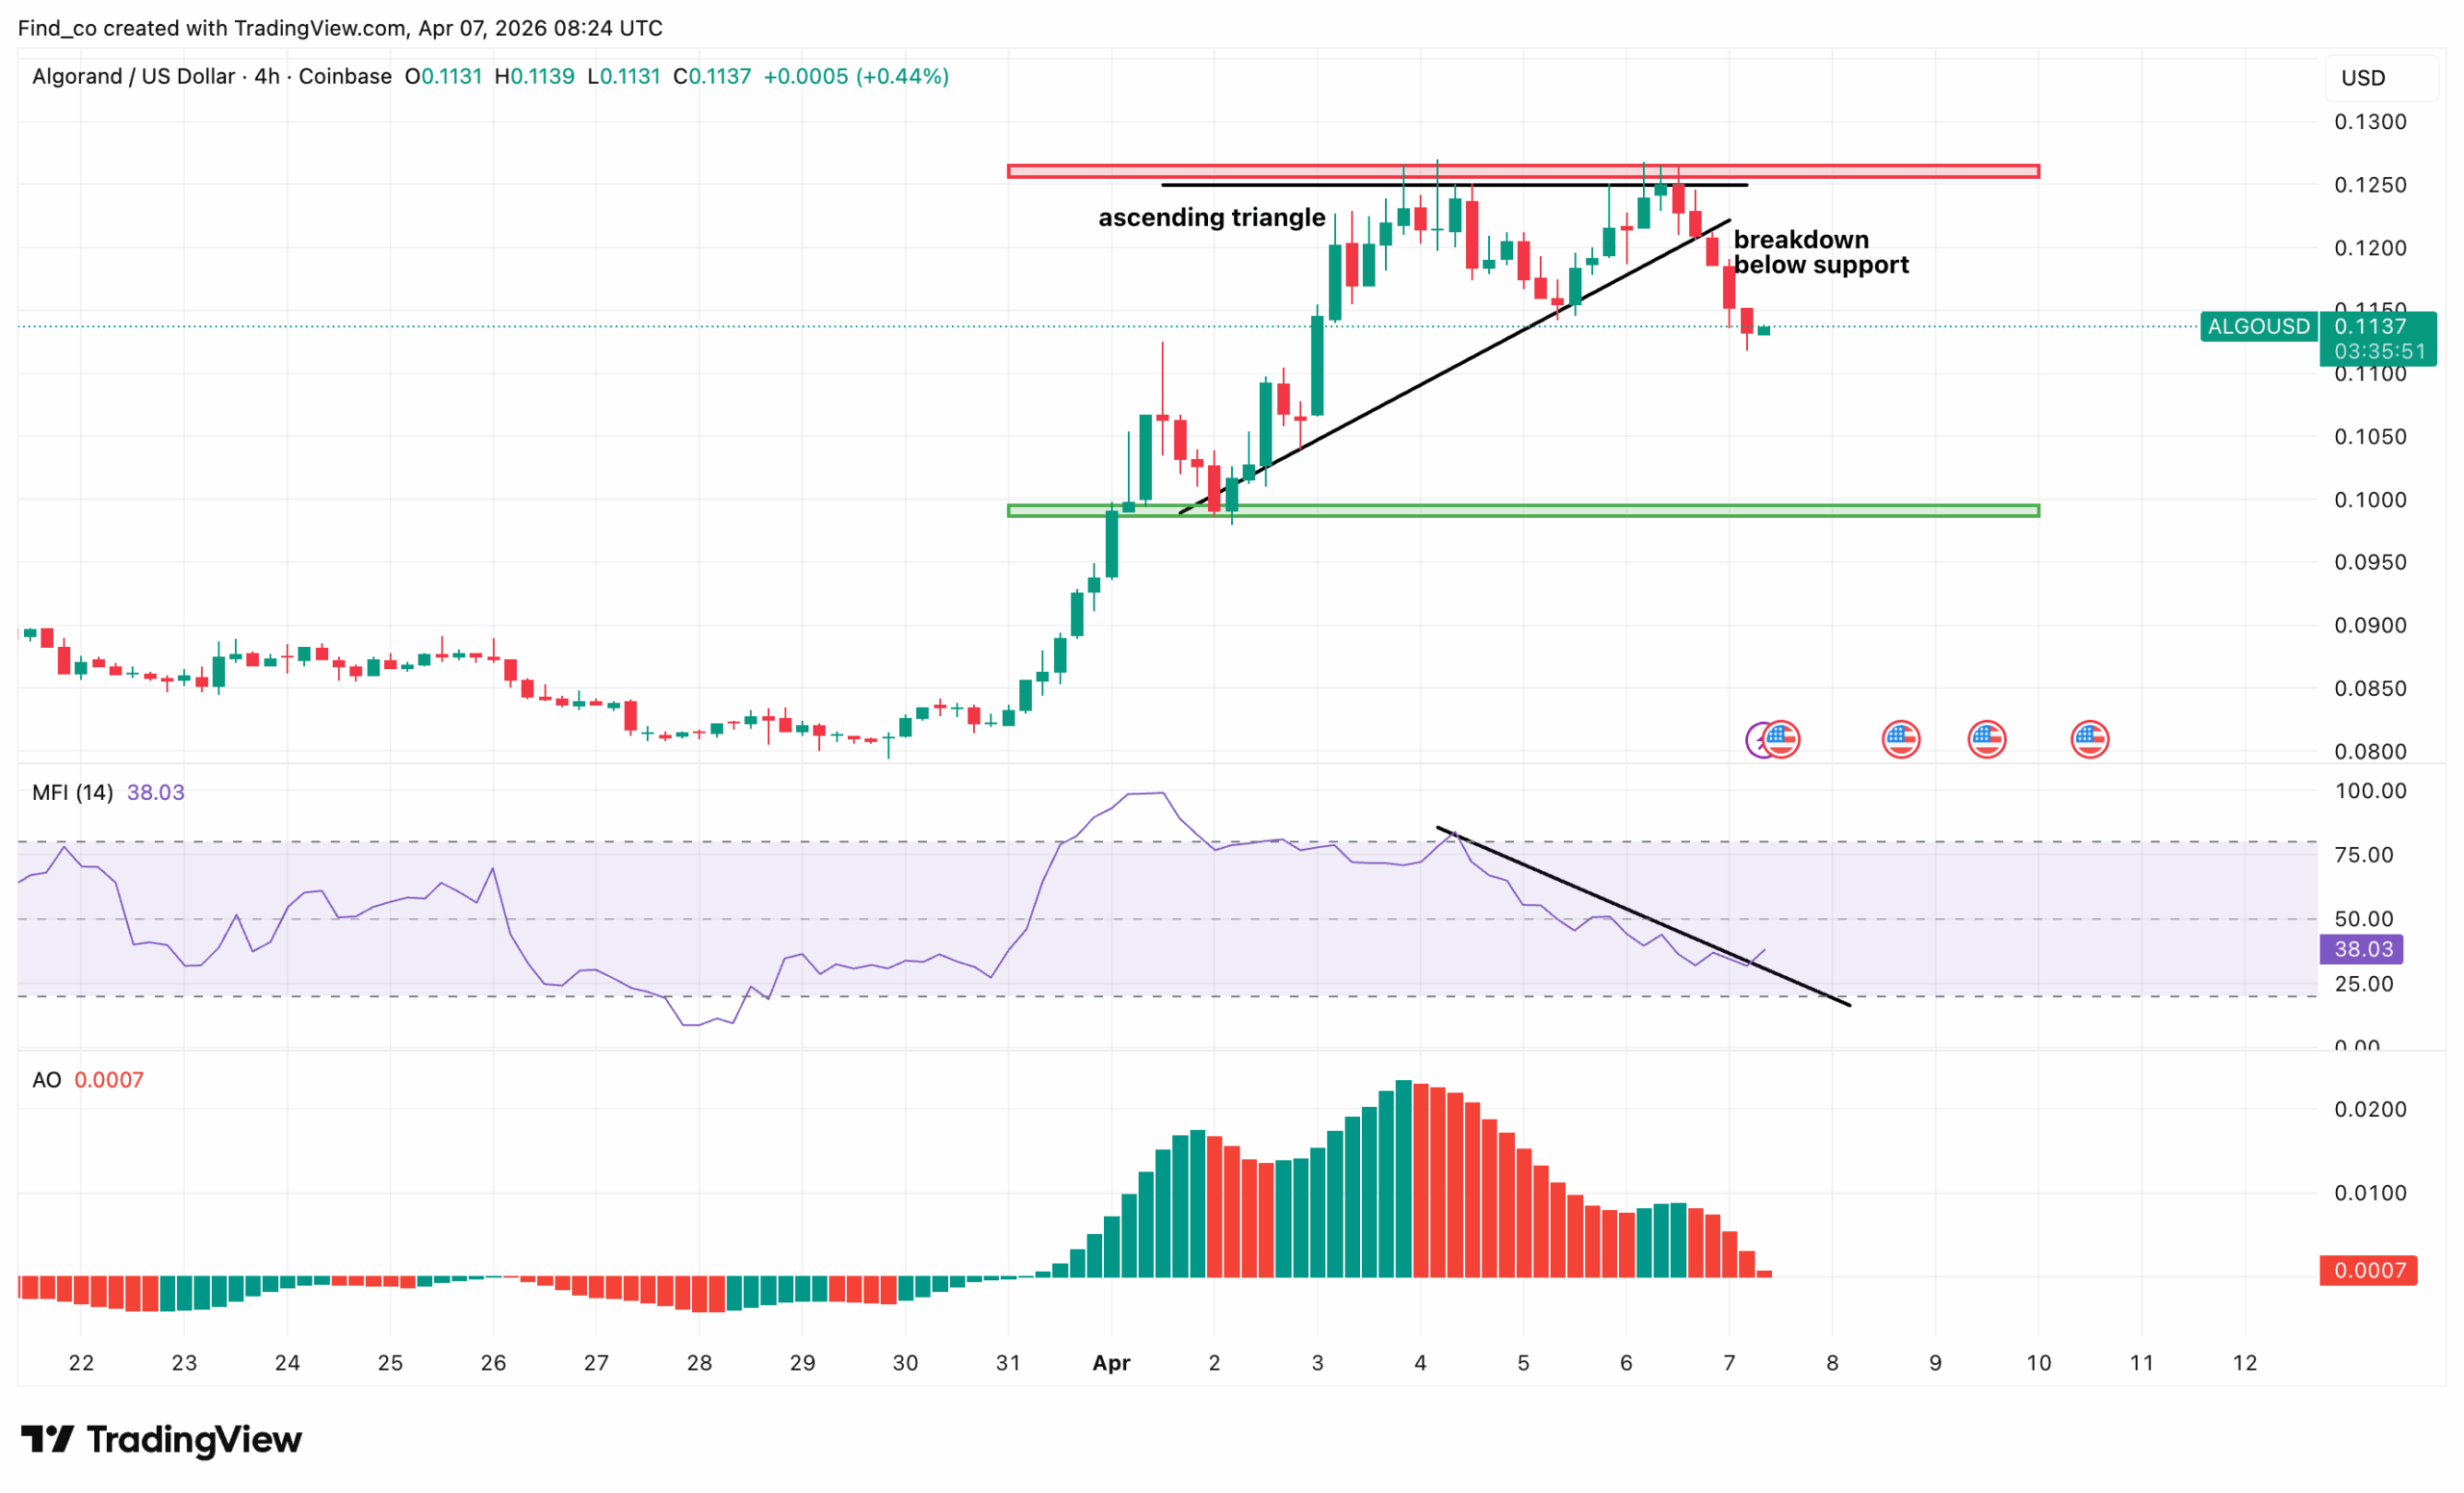
This structure typically signals bullish continuation. However, instead of breaking higher, ALGO has now broken down below the ascending trendline support.
This shift suggests that bullish momentum is fading.
The breakdown is important because it invalidates the immediate bullish pattern. As a result, sellers are starting to regain control.
Momentum indicators confirm this change. The Money Flow Index (MFI) is trending downward and currently sits near 38, indicating fading buying volume.
At the same time, the Awesome Oscillator (AO) has flipped red and is declining, showing that bullish momentum is fading quickly.
Despite this, the broader structure still offers some support. The $0.10 zone remains a key demand area that previously served as a base before the breakout.
If the price continues to decline, this level is likely to be tested.
Looking ahead, if ALGO fails to reclaim the broken trendline and remains below $0.12, further downside is likely.
In that case, the price could move toward $0.105 and potentially $0.10.
On the upside, bulls need to push the price back above $0.12 to regain momentum. A break above $0.13 would invalidate the breakdown and reopen the path toward higher resistance.
Funding Rate Adds More Context
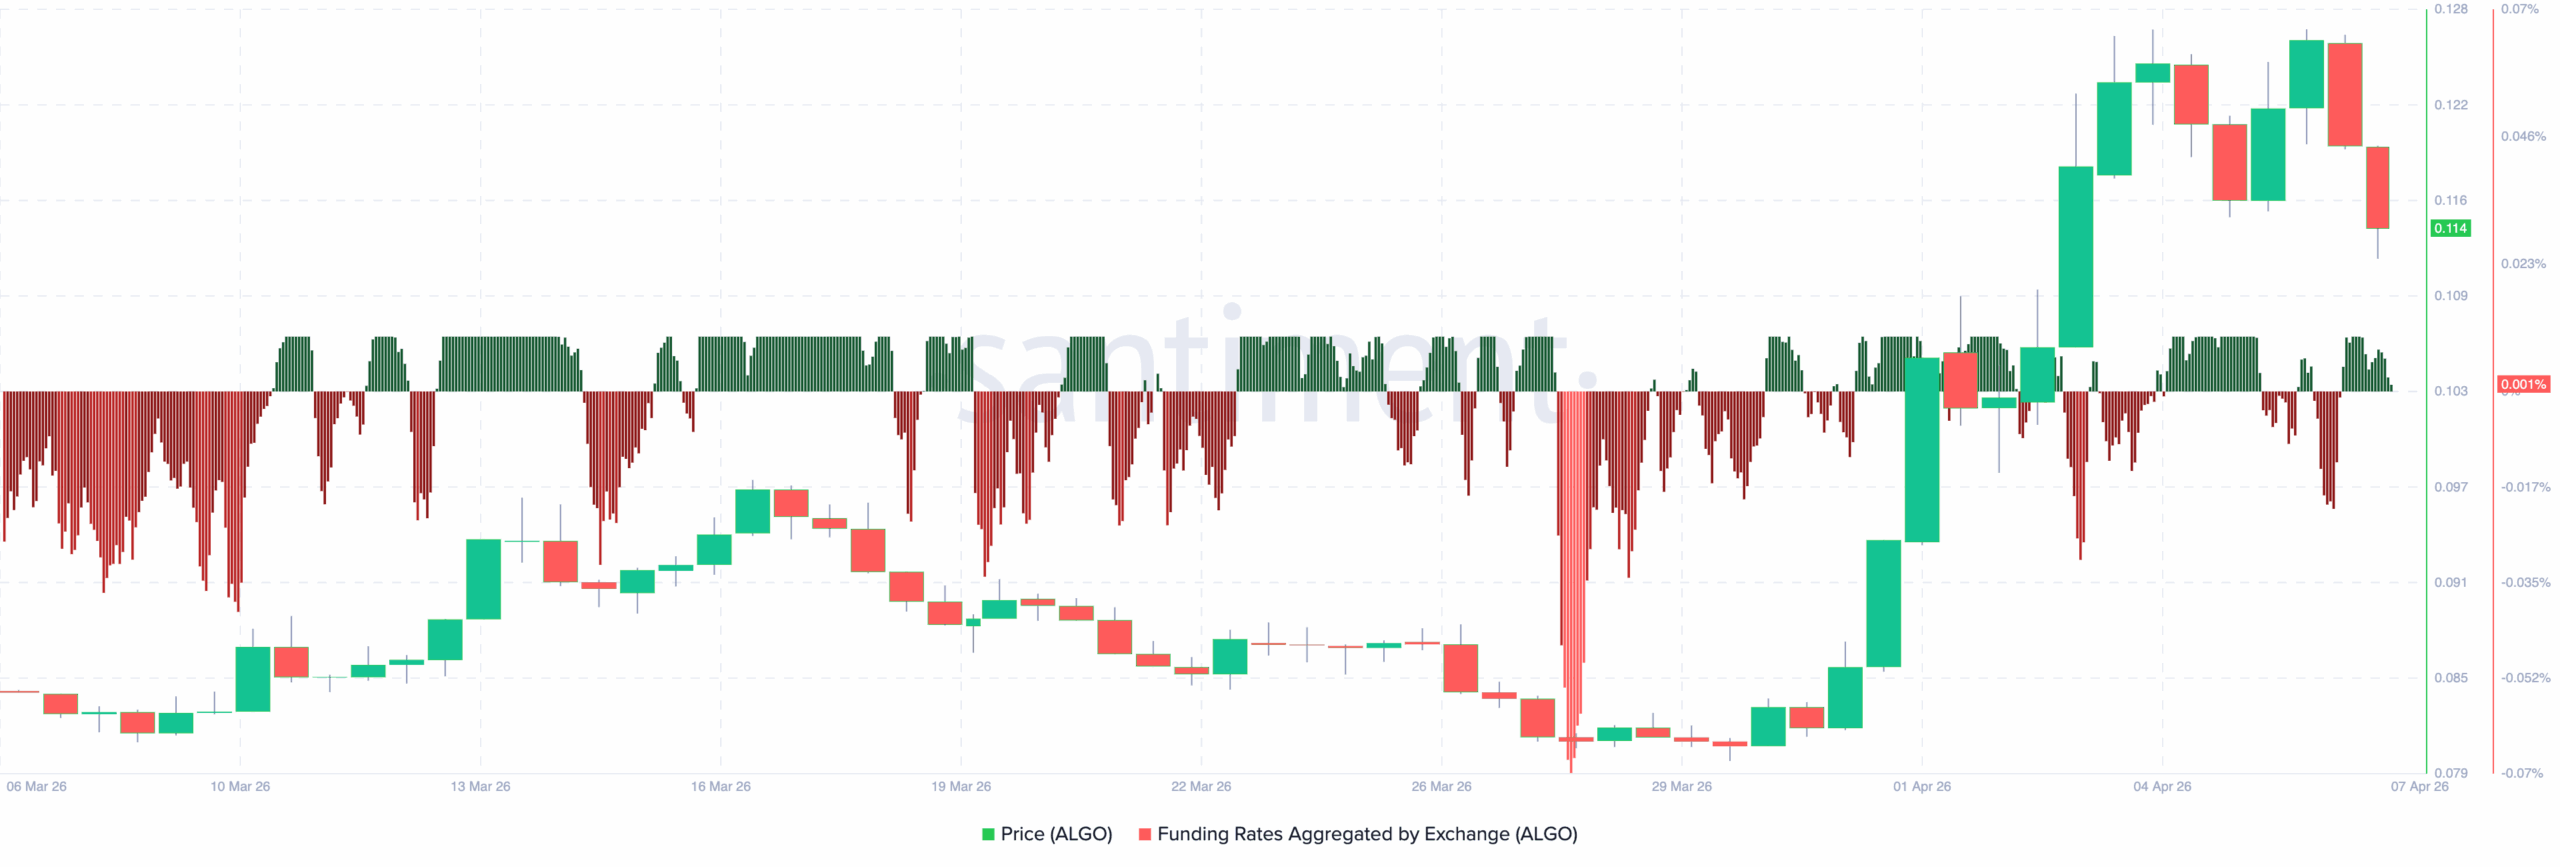
However, the funding rate data tells a more nuanced story.
Throughout the rally, funding rates have remained largely negative or unstable.
This suggests that traders are still positioned defensively, with a bias toward short positions. This kind of setup can have two outcomes.
Either Algorand’s price continues higher through a short squeeze, or the rally fades as sentiment proves correct.
More recently, funding has started to flip between positive and negative, showing indecision. At the same time, the price has stalled near $0.13.
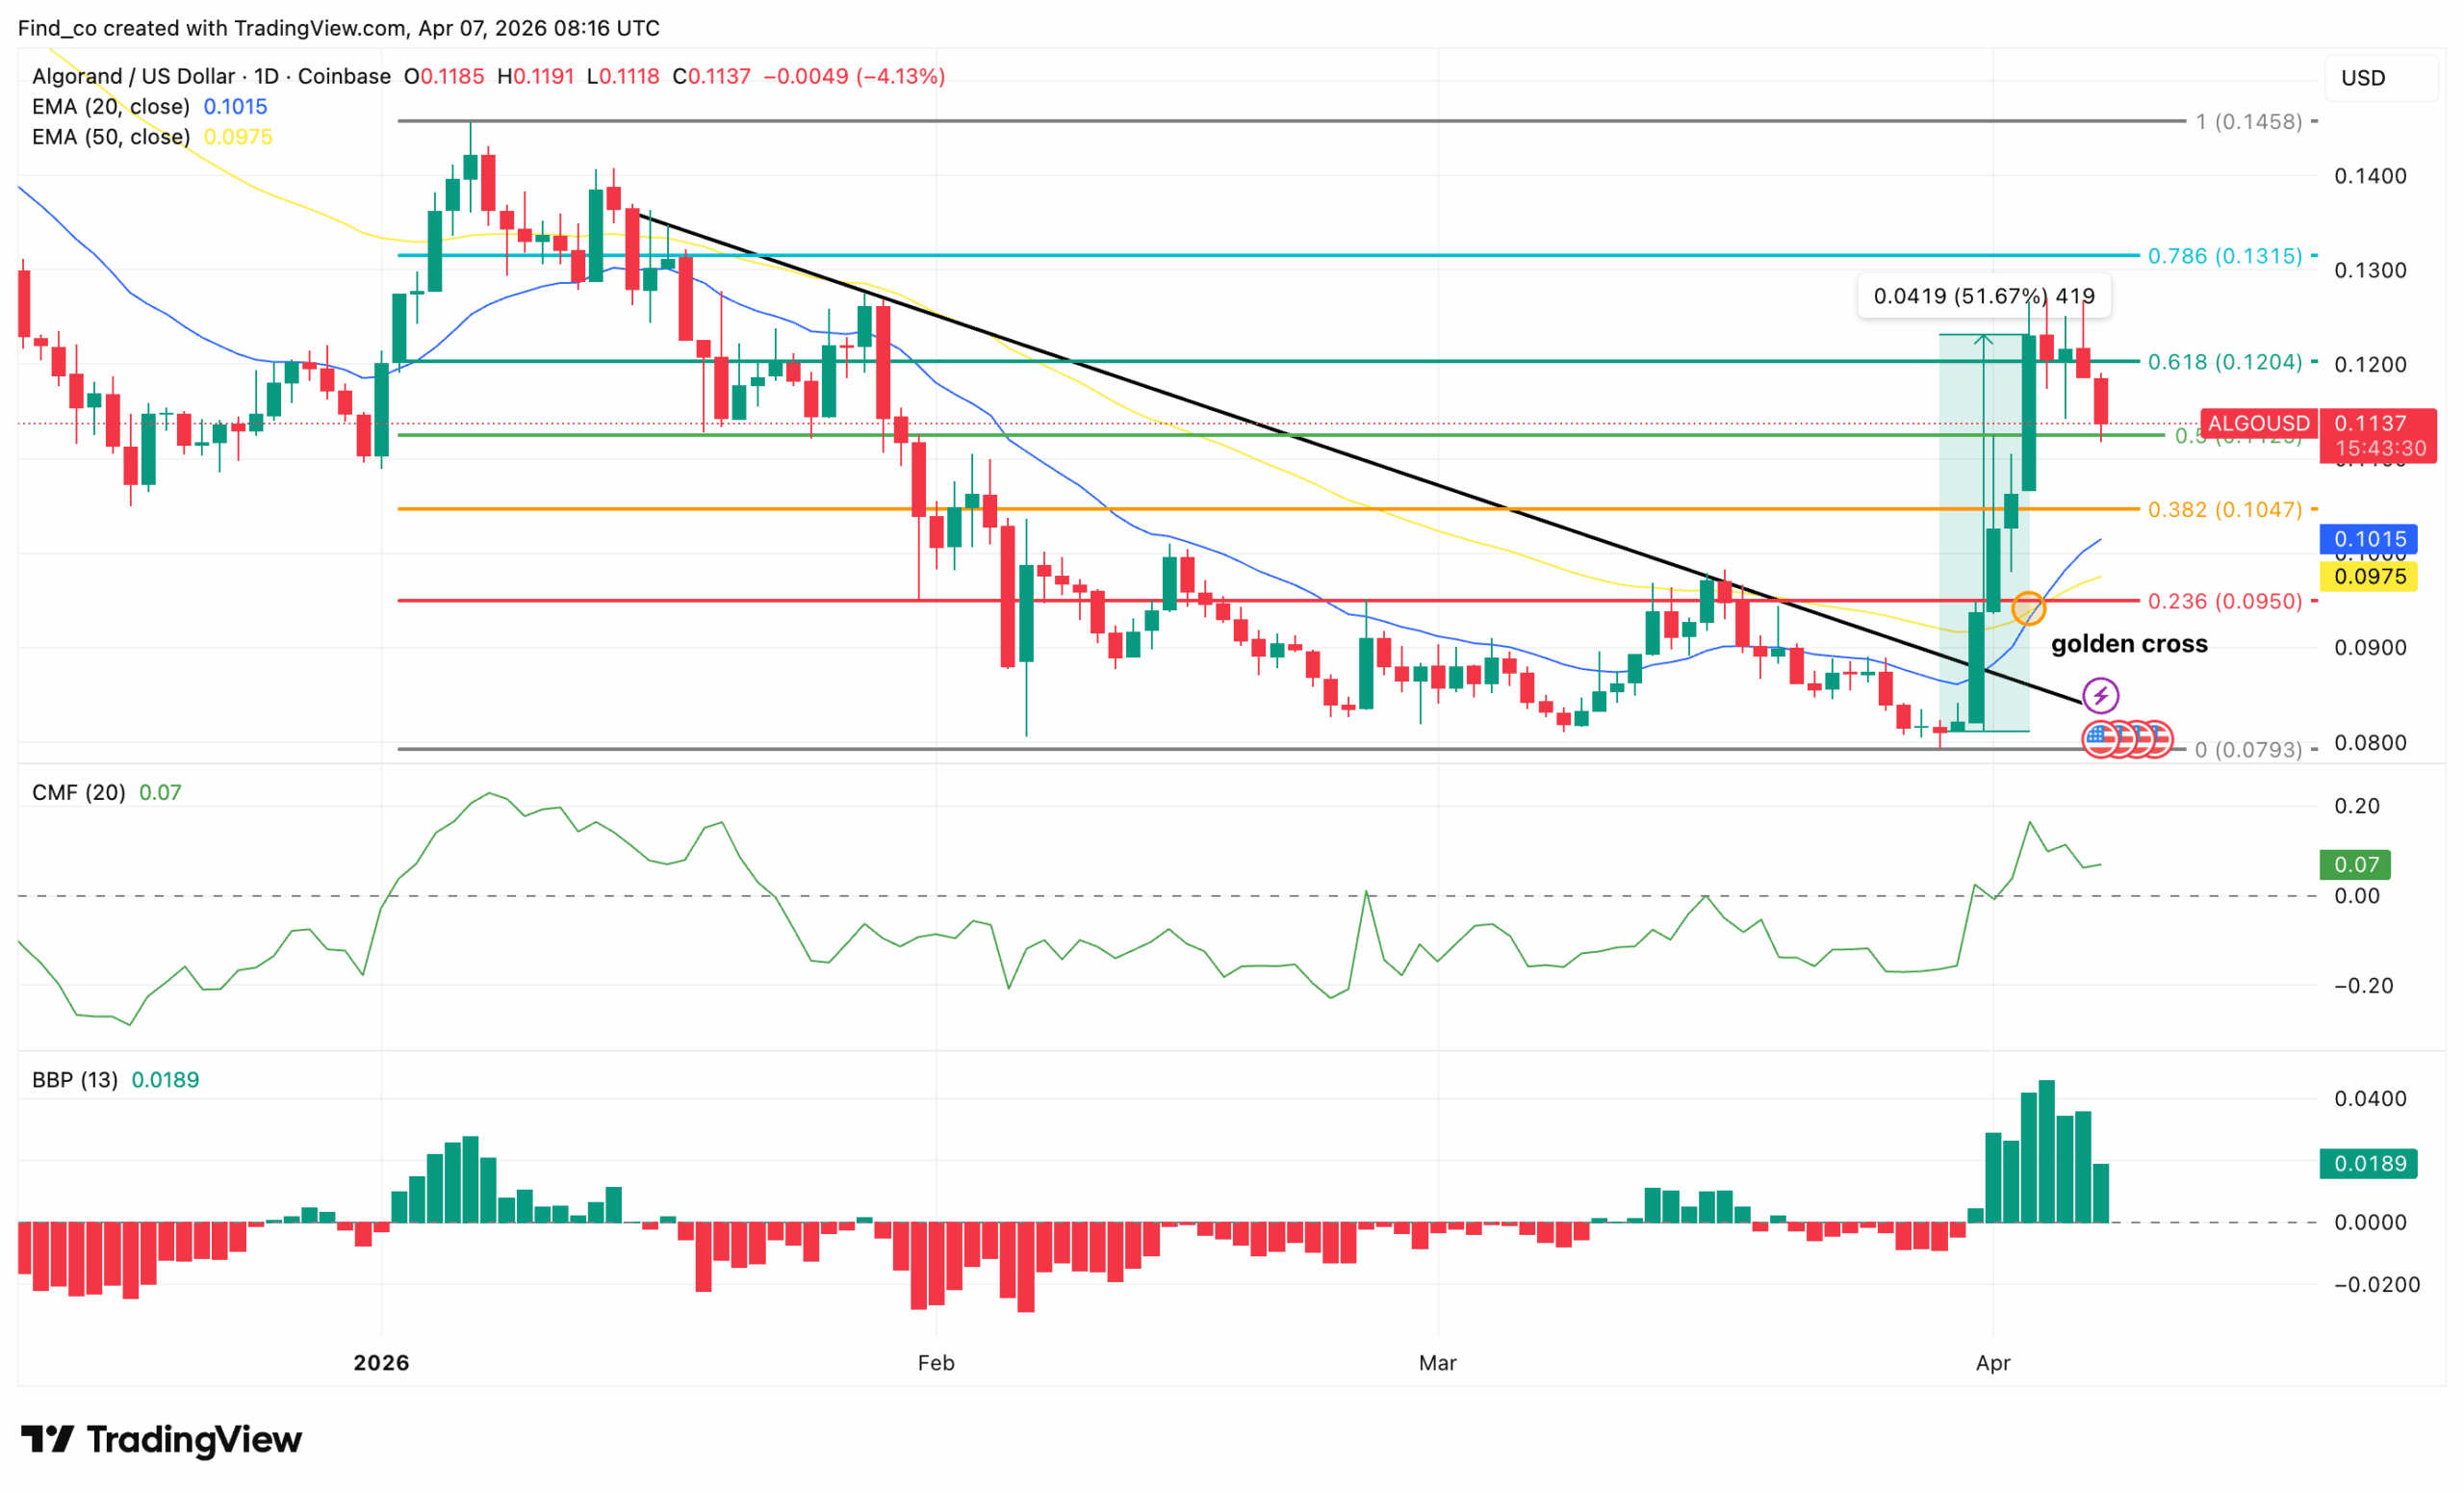
This aligns with resistance seen on higher timeframes, reinforcing it as a key rejection zone.
This creates a critical turning point. If ALGO holds above $0.11 and funding remains skewed negative, a continuation move is still possible.
In that scenario, price could push higher toward $0.13 as short positions get squeezed.
A successful break above $0.12 could push the price toward $0.13, and potentially the $0.15 region, which marks a major resistance level.
However, if the price fails to hold above $0.11, a pullback is likely. In that case, ALGO could retrace toward $0.104 (0.382 Fib), followed by the $0.095 zone near the 0.236 level.
A deeper correction could revisit the $0.08 support if selling pressure increases.
Disclaimer:
The information provided in this article is for informational purposes only. It is not intended to be, nor should it be construed as, financial advice. We do not make any warranties regarding the completeness, reliability, or accuracy of this information. All investments involve risk, and past performance does not guarantee future results. We recommend consulting a financial advisor before making any investment decisions.
Victor Olanrewaju is a crypto analyst and reporter at CCN with deep roots in on-chain research and technical analysis. His crypto journey began in 2017, but it was the 2020 Uniswap airdrop that sparked a full-time pivot into the space.
With a foundation in copywriting, Victor honed his craft creating high-converting content for leading crypto brokers — most notably an XRP price prediction that ranked #1 on Google during the 2021 bull run.
He later joined AMBCrypto in 2022, where he combined storytelling with technical and on-chain analysis to cover key market narratives.
In 2024, he expanded his expertise at BeInCrypto, collaborating with analysts and using tools like Glassnode, Santiment, and IntoTheBlock to break down Bitcoin and altcoin trends.
At CCN, Victor covers the top cryptocurrencies, memecoins, macro shifts, blending real-time insights with deep-dive metrics.
He holds a Bachelor’s degree in Physics from the University of Ibadan, equipping him to simplify complex data for a wide audience. Follow his work or connect on LinkedIn or X.