Here is how the energy shock is impacting Korean favorites like ETH, DOGE, and SHIB | Credit: Hameem Sarwar
Share
Key Takeaways
South Korea’s KOSPI index suffered its worst single-day decline in history on March 3.
ETH, DOGE, and SHIB are Korean retail traders (the backbone of the region’s liquidity), de-risk.
This analysis reveals the potential price targets for ETH, DOGE, and SHIB amid the crisis.
South Korea is in the middle of its worst two-day stock market collapse since the 2008 global financial crisis — and for crypto traders holding Ethereum (ETH), Dogecoin (DOGE), and Shiba Inu (SHIB), it is not a distant headline.
It is a direct threat to some of the most actively traded tokens in Asia.
This staggering two-day wipeout forced the Korea Exchange to activate circuit breakers and trading curbs for the first time since August 2024, temporarily halting program-driven sell orders as volatility spiraled out of control.
Critically, this is not a domestic economic failure story. It is an energy shock and geopolitical panic playing out in real time across global markets.
Get These Top Crypto Casino Offers Now!
Sponsored
Disclosure
We sometimes use affiliate links in our content, when clicking on those we might receive a commission at no extra cost to you. By using this website you agree to our terms and conditions and privacy policy.
The escalating conflict involving Israel, the U.S., and Iran has been the primary trigger.
Reports of strikes on Iranian targets and retaliatory drone attacks on Gulf oil infrastructure have hammered global risk appetite. Since South Korea is one of the world’s largest energy importers, it has become exposed.
The country sources roughly 70% of its crude oil from the Middle East, much of it passing through the Strait of Hormuz.
So, Iran’s threat to close the Strait, which would halt approximately one-fifth of global oil supply, has sent shockwaves through Korean financial markets.
Compounding the crisis, the South Korean won has weakened, briefly sliding past the psychologically critical 1,500 level against the U.S. dollar for the first time since 2009.
Asset / Company
Performance Today
Context
KOSPI Index
-11% to -12%
Lowest level in nearly a month.
Korean Won (KRW)
1,505.8 (Low)
Weakest since March 2009.
Samsung Electronics
-9.7%
AI-rally gains are being erased.
Hyundai Motor
-13.1%
Hit by global growth & shipping fears.
Brent Crude Oil
~82.00
Up 12% this week on war risks.
Finally, the KOSPI’s earlier AI-fueled semiconductor rally has unraveled violently.
Samsung Electronics and SK Hynix (two of the index’s most important anchors) dropped between 7% and 11% in less than 24 hours, as global funds de-risked from what analysts are calling an overheated, crowded positioning unwind.
So, Why Are These Cryptos involved in the Crossfire?
South Korea is not just a major equity market. It is one of Asia’s most powerful crypto trading hubs. While XRP leads in trading volume in the region, ETH, DOGE, and SHIB consistently rank among the top on Upbit and Bithumb.
For those unfamiliar, these are two of the region’s largest exchanges. Korean retail traders have a well-documented appetite for these tokens, and the so-called “Kimchi premium” reflects the extent to which local demand influences their global pricing.
Ethereum (ETH) Price Analysis
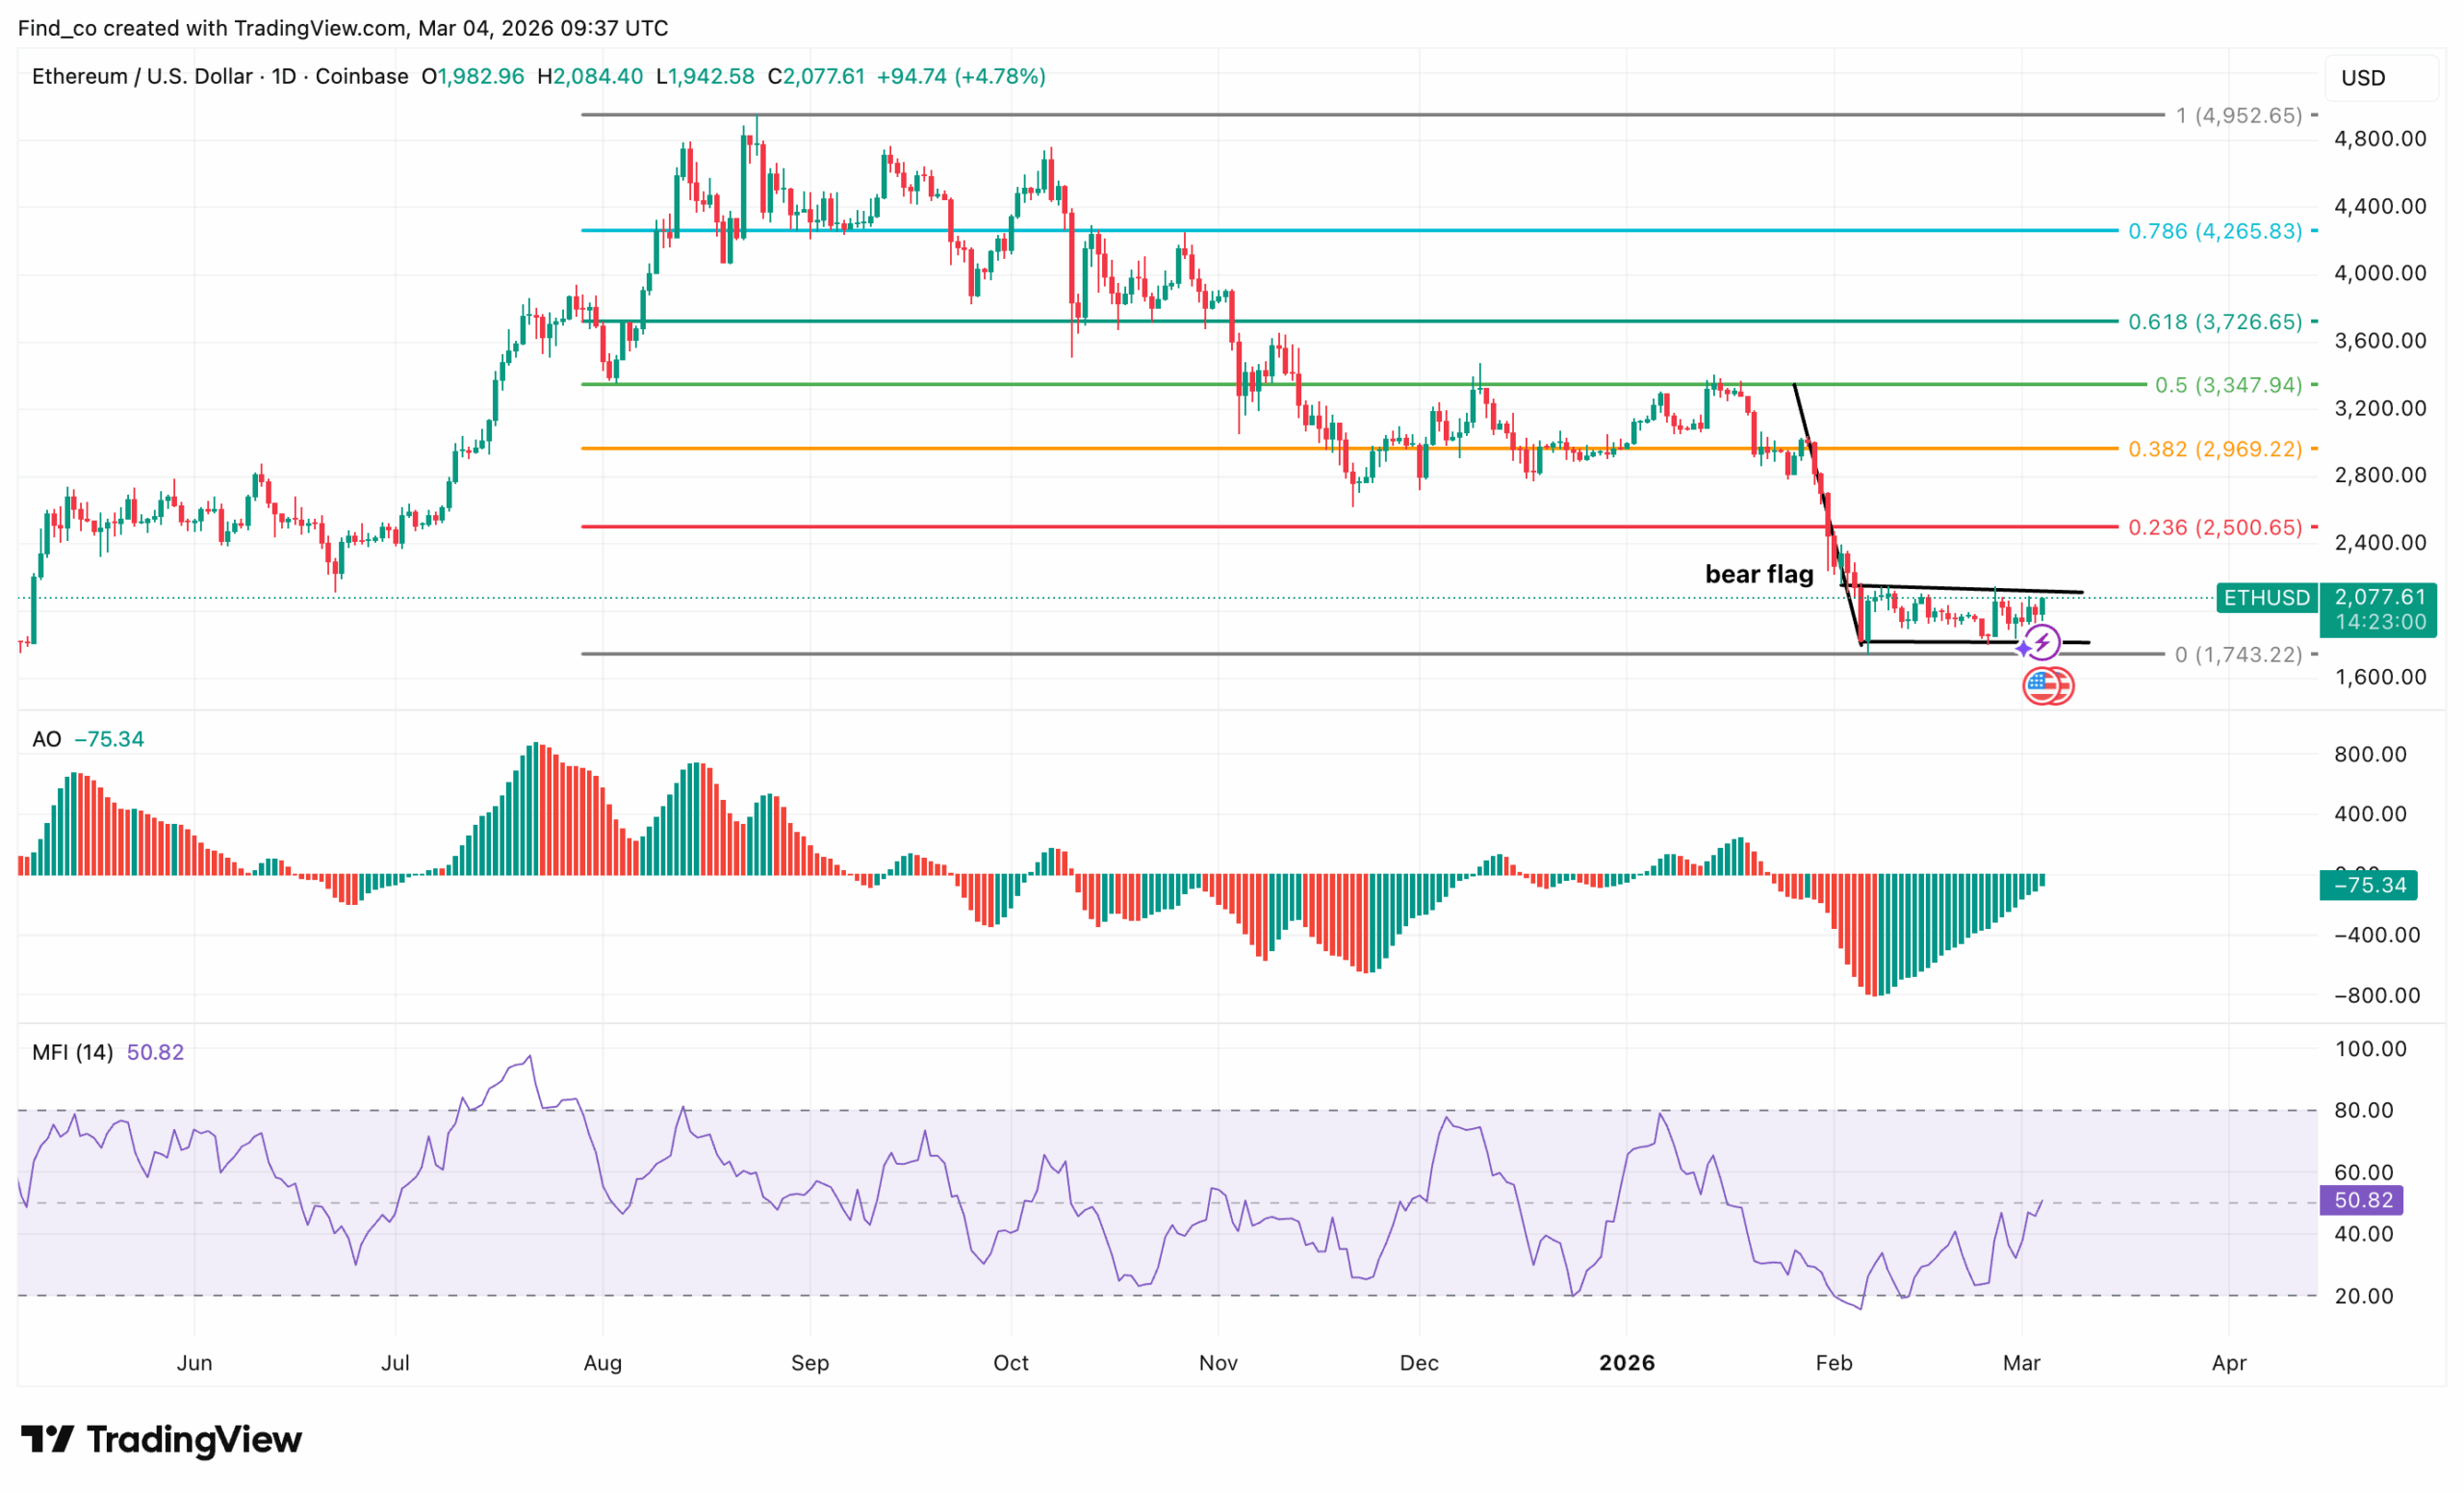
Ethereum’s price is currently consolidating above a critical support zone following an earlier selloff in February.
From the image below, ETH is trading around $2,070 and forming a small bear flag just above the major horizontal support near $1,740.
This level previously served as a strong reaction zone, attracting buyers and preventing a breakdown after the aggressive drop from the $3,200 region.
The broader structure remains bearish. Ethereum has been making lower highs since its cycle top, and the recent rejection near the 0.5 Fibonacci level around $3,347 reinforced that downward trend.
Momentum indicators suggest the market is attempting a short-term stabilization. As shown below, the Awesome Oscillator (AO) is recovering from negative levels, showing that bearish momentum is fading.
This could also have happened due to the decline in trading volume amid the South Korea market decline.
Meanwhile, the Money Flow Index (MFI) is hovering near neutral territory around 50, indicating balanced buying and selling pressure.
For bulls to regain control, ETH would need to break above the flag’s upper boundary and reclaim the $2,500 region, which aligns with the 0.236 Fibonacci level.
Dogecoin (DOGE) Price Outlook
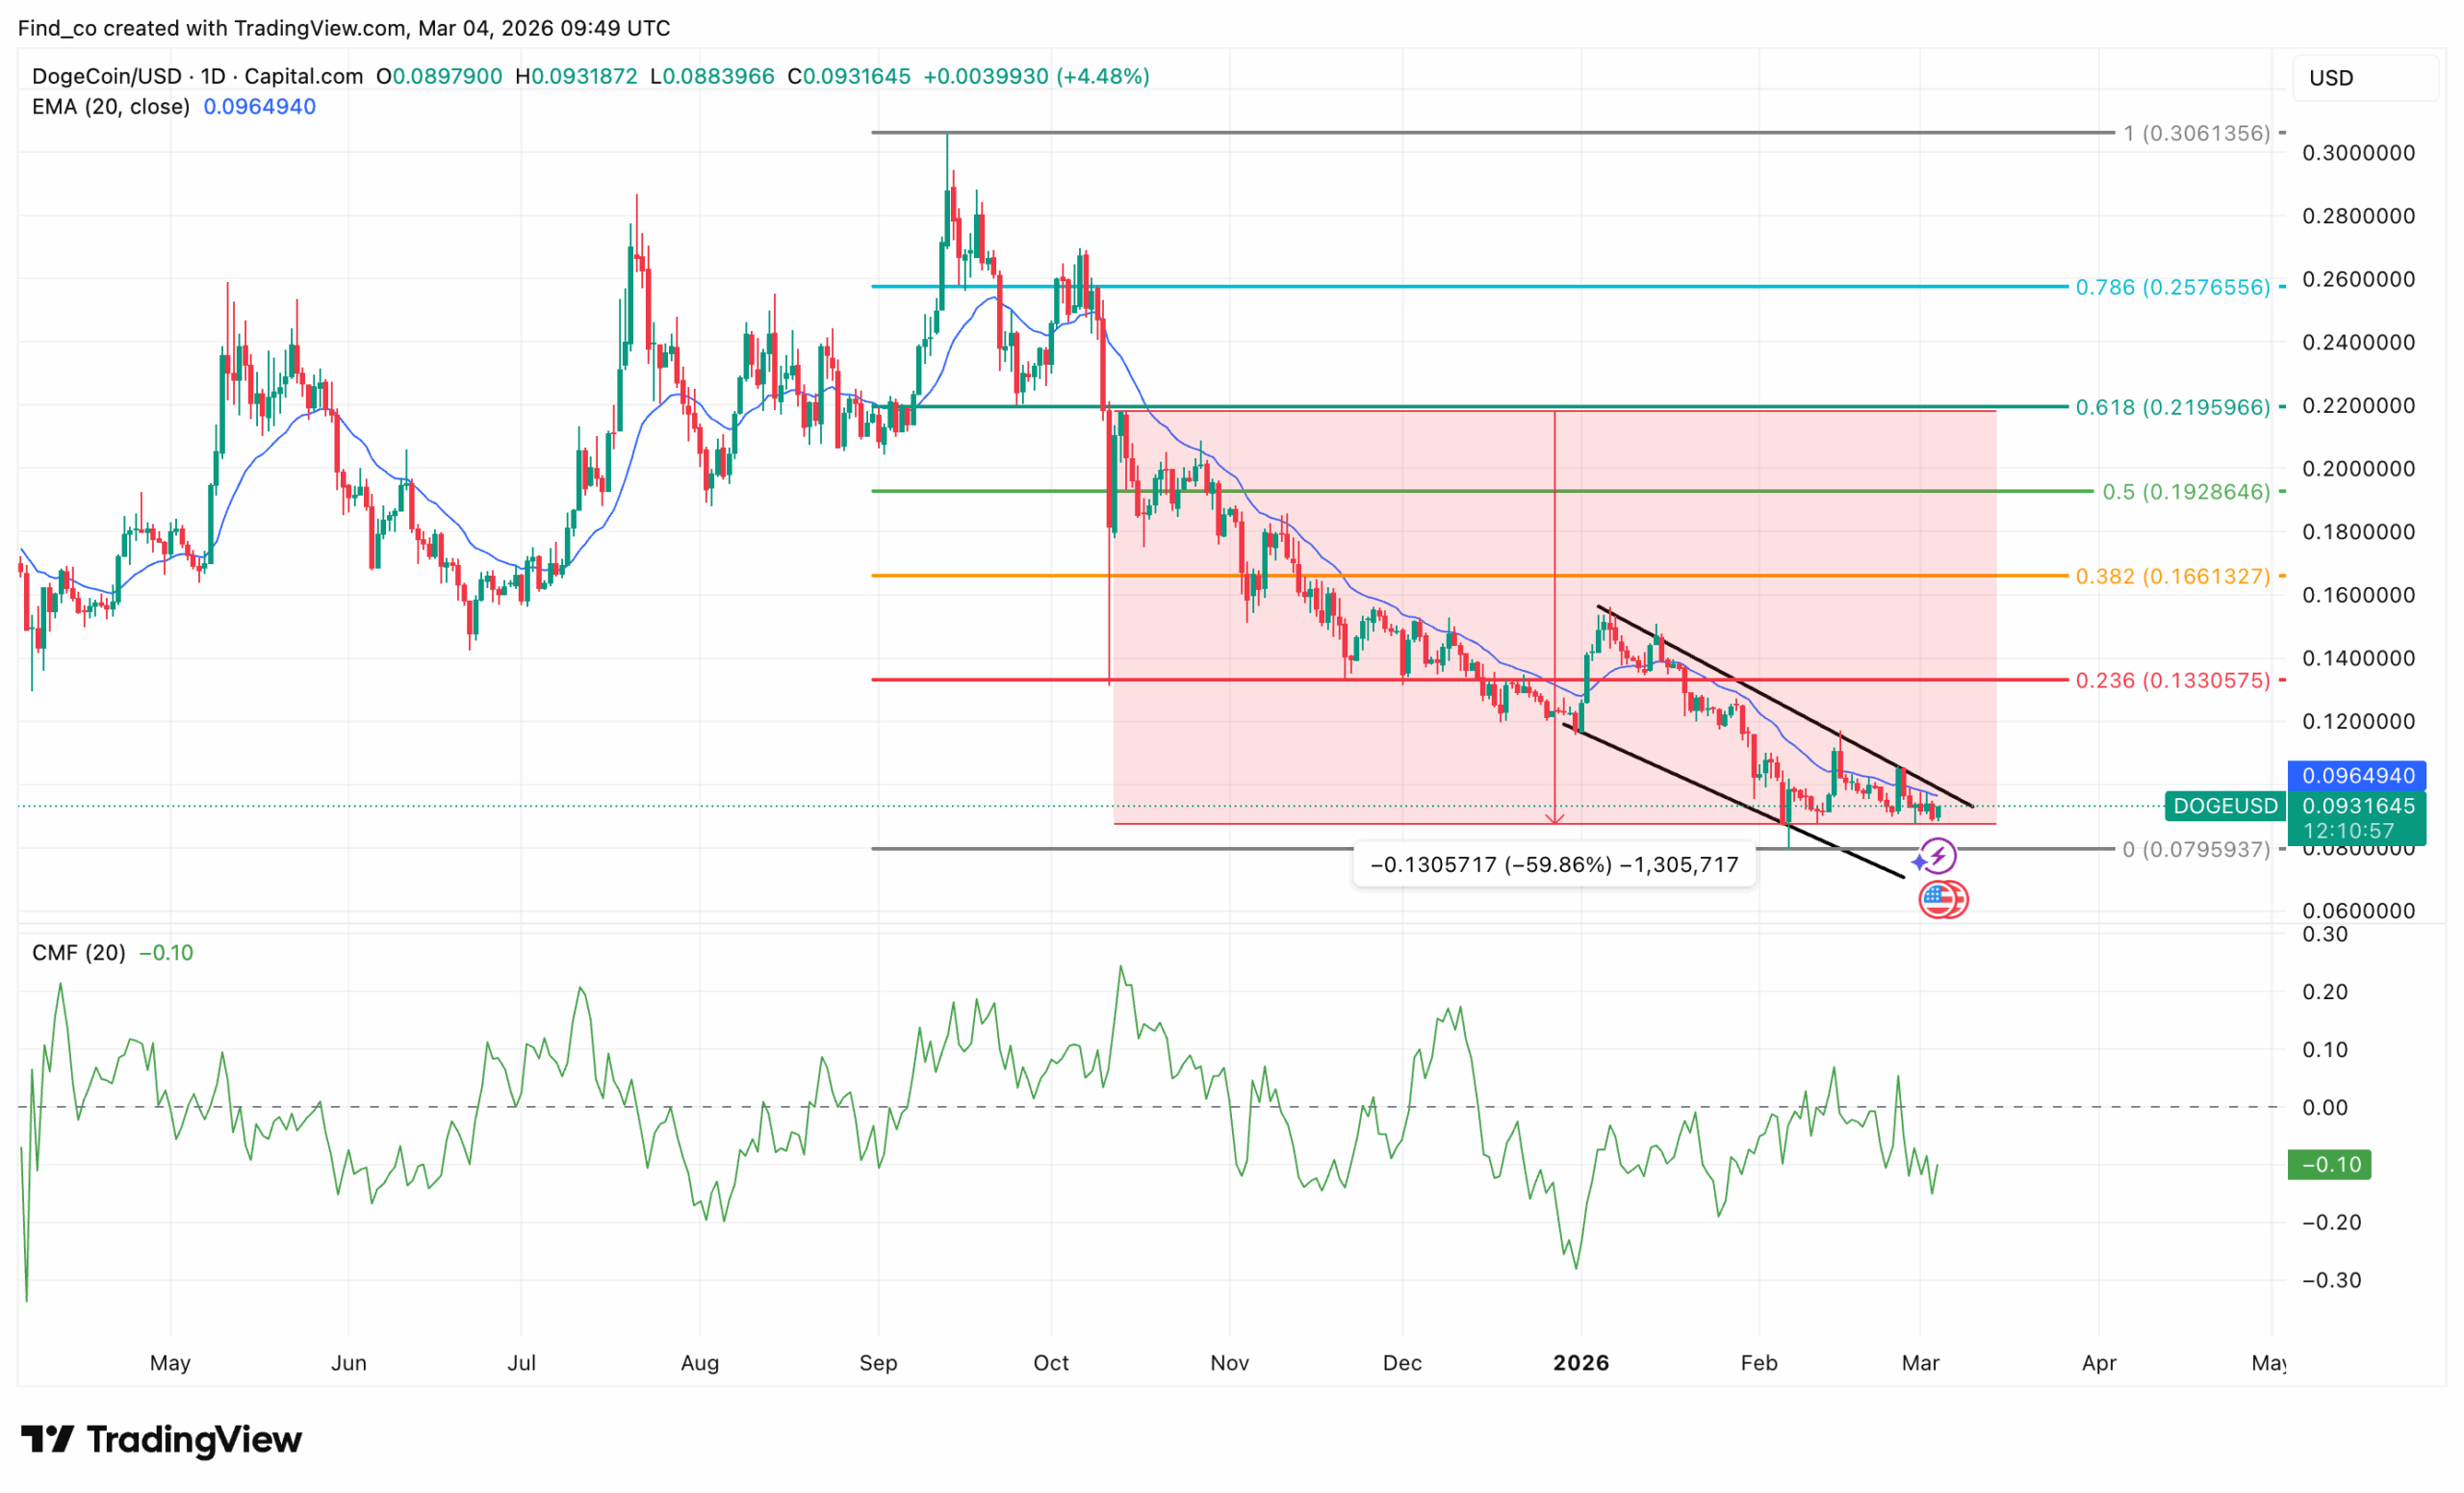
For Dogecoin, it remains under strong bearish pressure amid the South Korean market crisis.
However, the overall structure still shows a clear sequence of lower highs and lower lows. This position confirms that the broader trend remains downward.
The current price action is forming a small consolidation near the bottom of the channel, just below the descending resistance trendline.
This area could lead to a short-term bounce, but the market would need to reclaim the $0.13 level, which aligns with the 0.236 Fibonacci retracement
In the meantime, the Chaikin Money Flow (CMF) remains slightly negative. This suggests that capital outflows persist despite the recent stabilization.
Unless Dogecoin’s price breaks above the descending channel and reclaims key Fibonacci resistance levels, the current move looks more like a pause in the downtrend rather than the start of a sustained recovery.
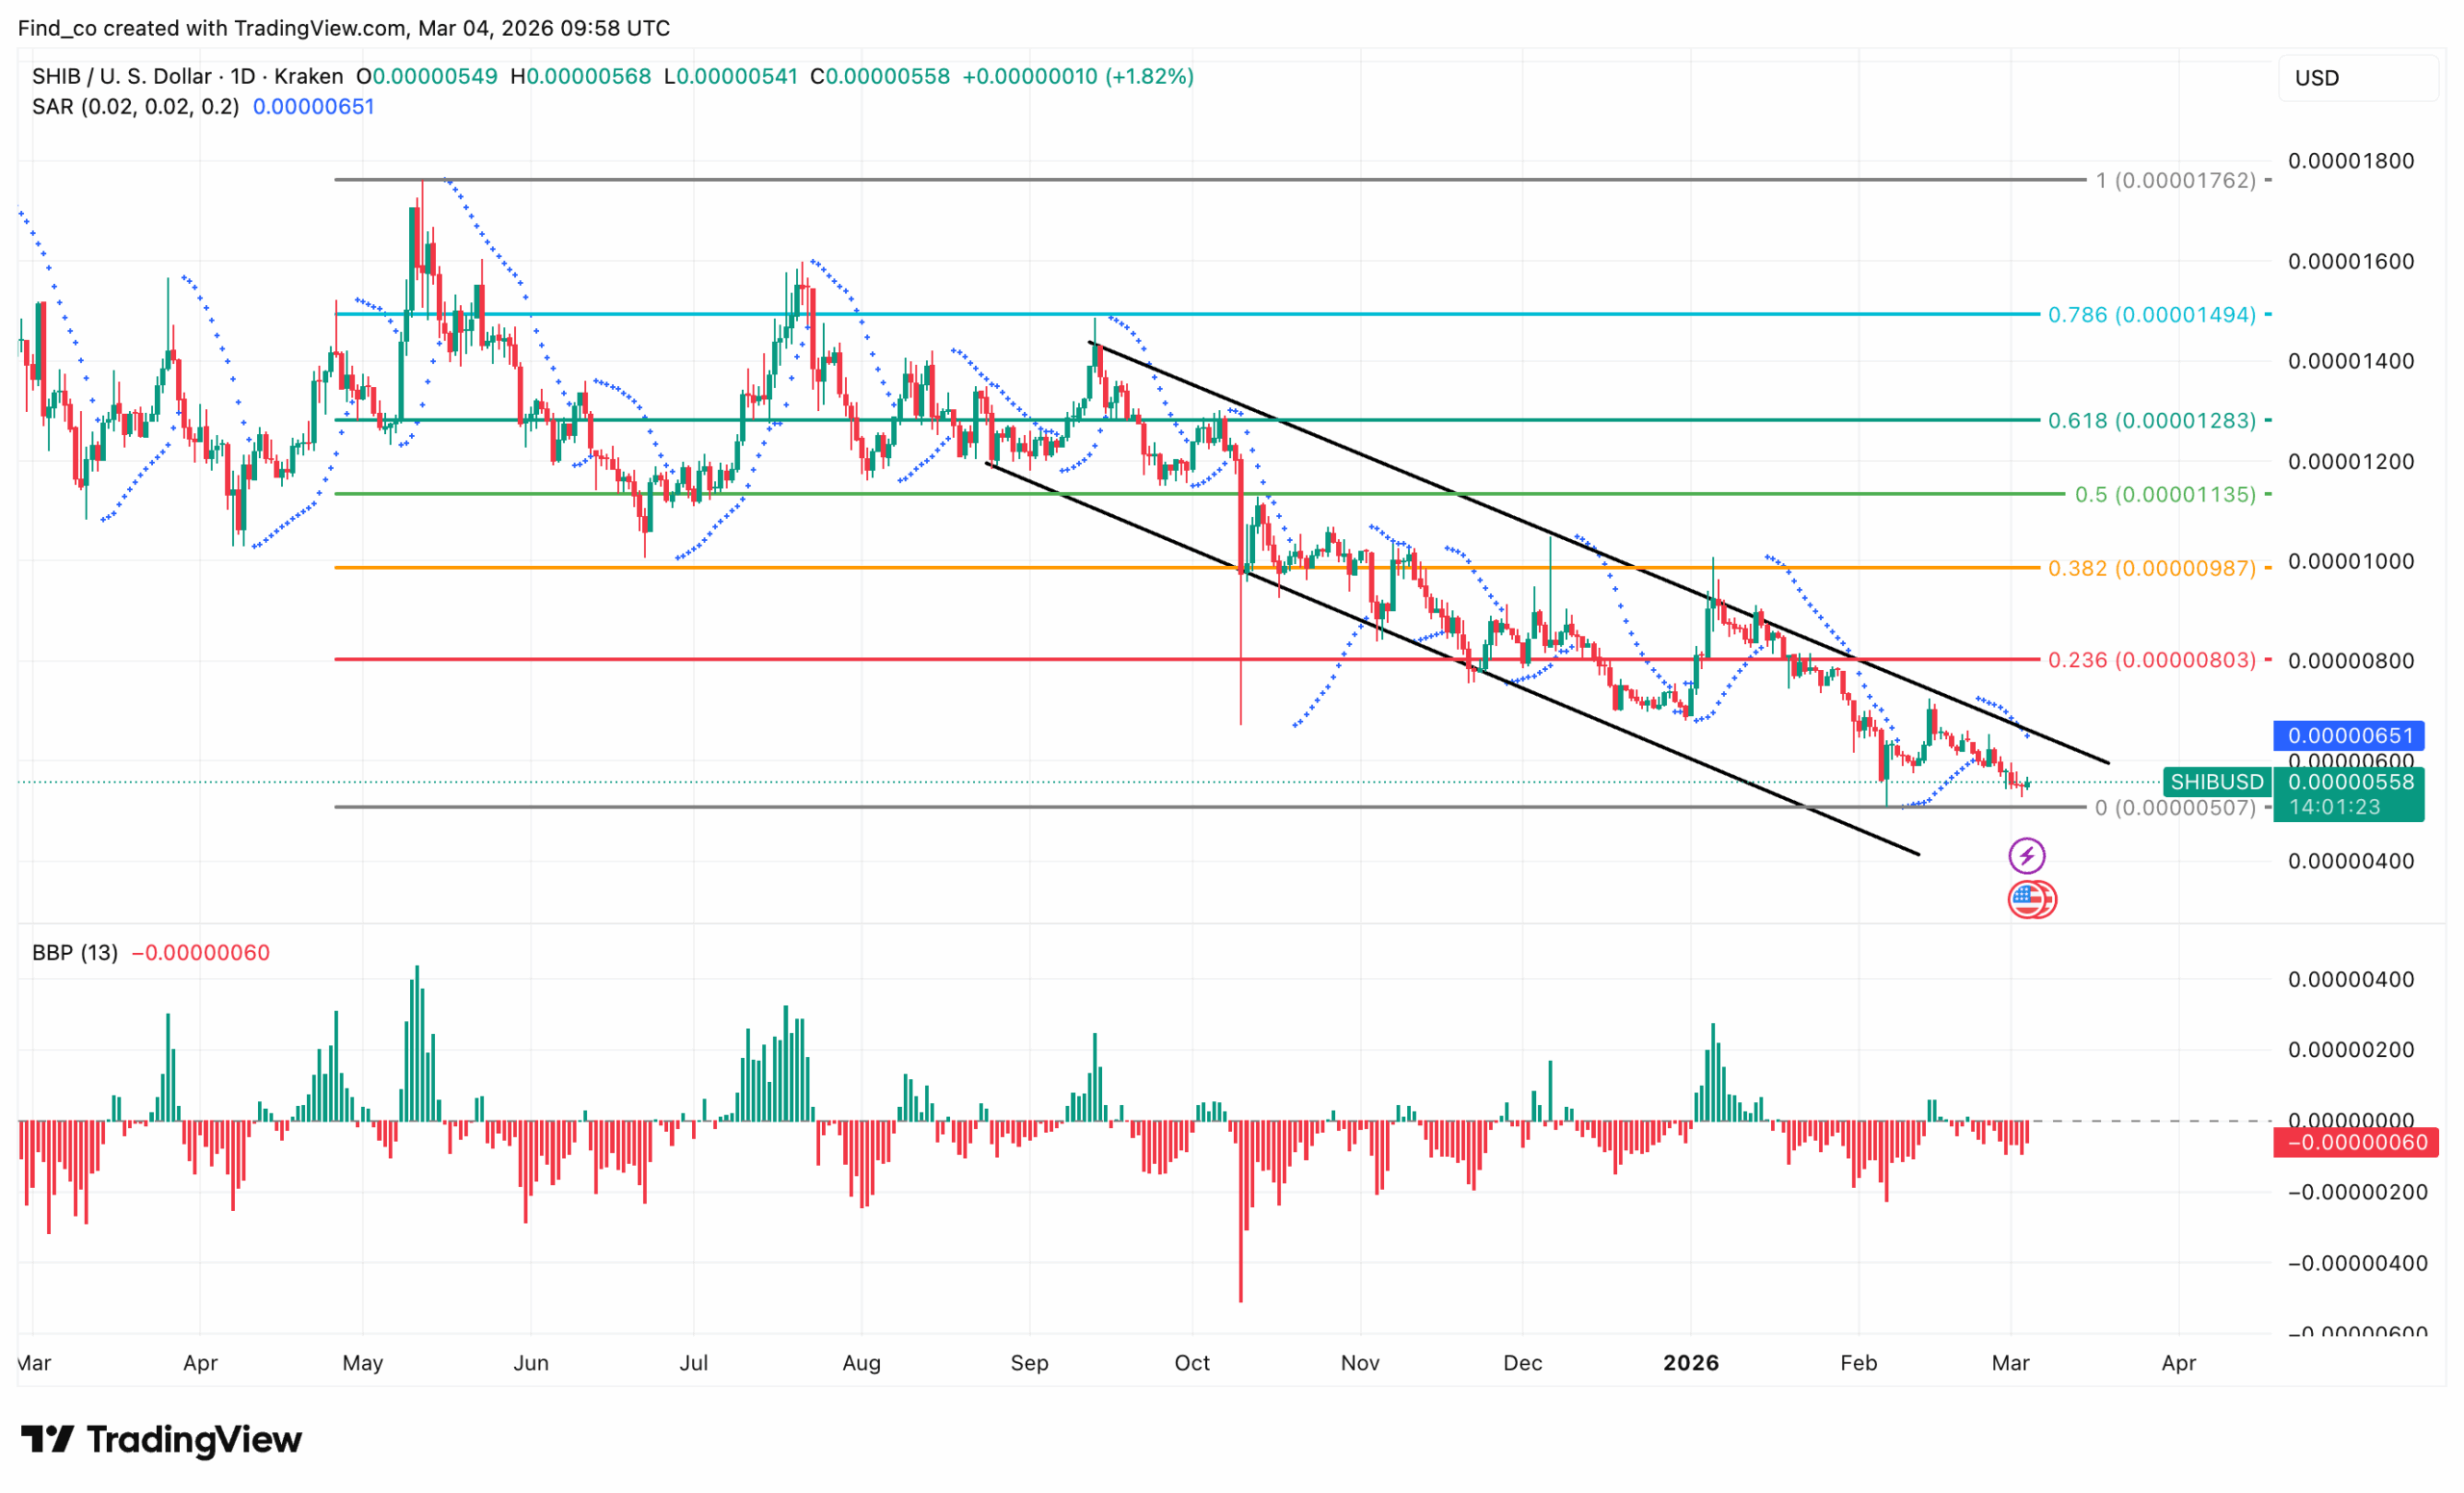
SHIB is currently trading near $0.0000056 after gradually sliding toward the lower boundary of the channel. The memecoin recently approached the major support region around $0.0000050, which has historically acted as a demand zone.
The Fibonacci structure highlights how each rebound has been capped at progressively lower levels.
The 0.236 retracement near $0.0000080 and the 0.382 level around $0.0000098 have repeatedly acted as resistance during the decline. Until SHIB’s price can reclaim these levels, the broader trend remains bearish.
The Parabolic SAR dots remain above the price, confirming that the prevailing momentum still favors sellers.
Meanwhile, the Bull Bear Power indicator remains negative, indicating that bearish pressure is still dominant despite occasional short-lived bounces.
Disclaimer:
The information provided in this article is for informational purposes only. It is not intended to be, nor should it be construed as, financial advice. We do not make any warranties regarding the completeness, reliability, or accuracy of this information. All investments involve risk, and past performance does not guarantee future results. We recommend consulting a financial advisor before making any investment decisions.
Victor Olanrewaju is a crypto analyst and reporter at CCN with deep roots in on-chain research and technical analysis. His crypto journey began in 2017, but it was the 2020 Uniswap airdrop that sparked a full-time pivot into the space.
With a foundation in copywriting, Victor honed his craft creating high-converting content for leading crypto brokers — most notably an XRP price prediction that ranked #1 on Google during the 2021 bull run.
He later joined AMBCrypto in 2022, where he combined storytelling with technical and on-chain analysis to cover key market narratives.
In 2024, he expanded his expertise at BeInCrypto, collaborating with analysts and using tools like Glassnode, Santiment, and IntoTheBlock to break down Bitcoin and altcoin trends.
At CCN, Victor covers the top cryptocurrencies, memecoins, macro shifts, blending real-time insights with deep-dive metrics.
He holds a Bachelor’s degree in Physics from the University of Ibadan, equipping him to simplify complex data for a wide audience. Follow his work or connect on LinkedIn or X.