What next for SHIB in March? | Credit: Hameem Sarwar
Share
Key Takeaways
SHIB inflows have crossed 110B tokens while price trades inside a descending channel.
Reversal needs structural reclaim, as momentum indicators still favor SHIB bears.
Price is hovering just above the critical $0.0000055 range, backed by the zero Fib level.
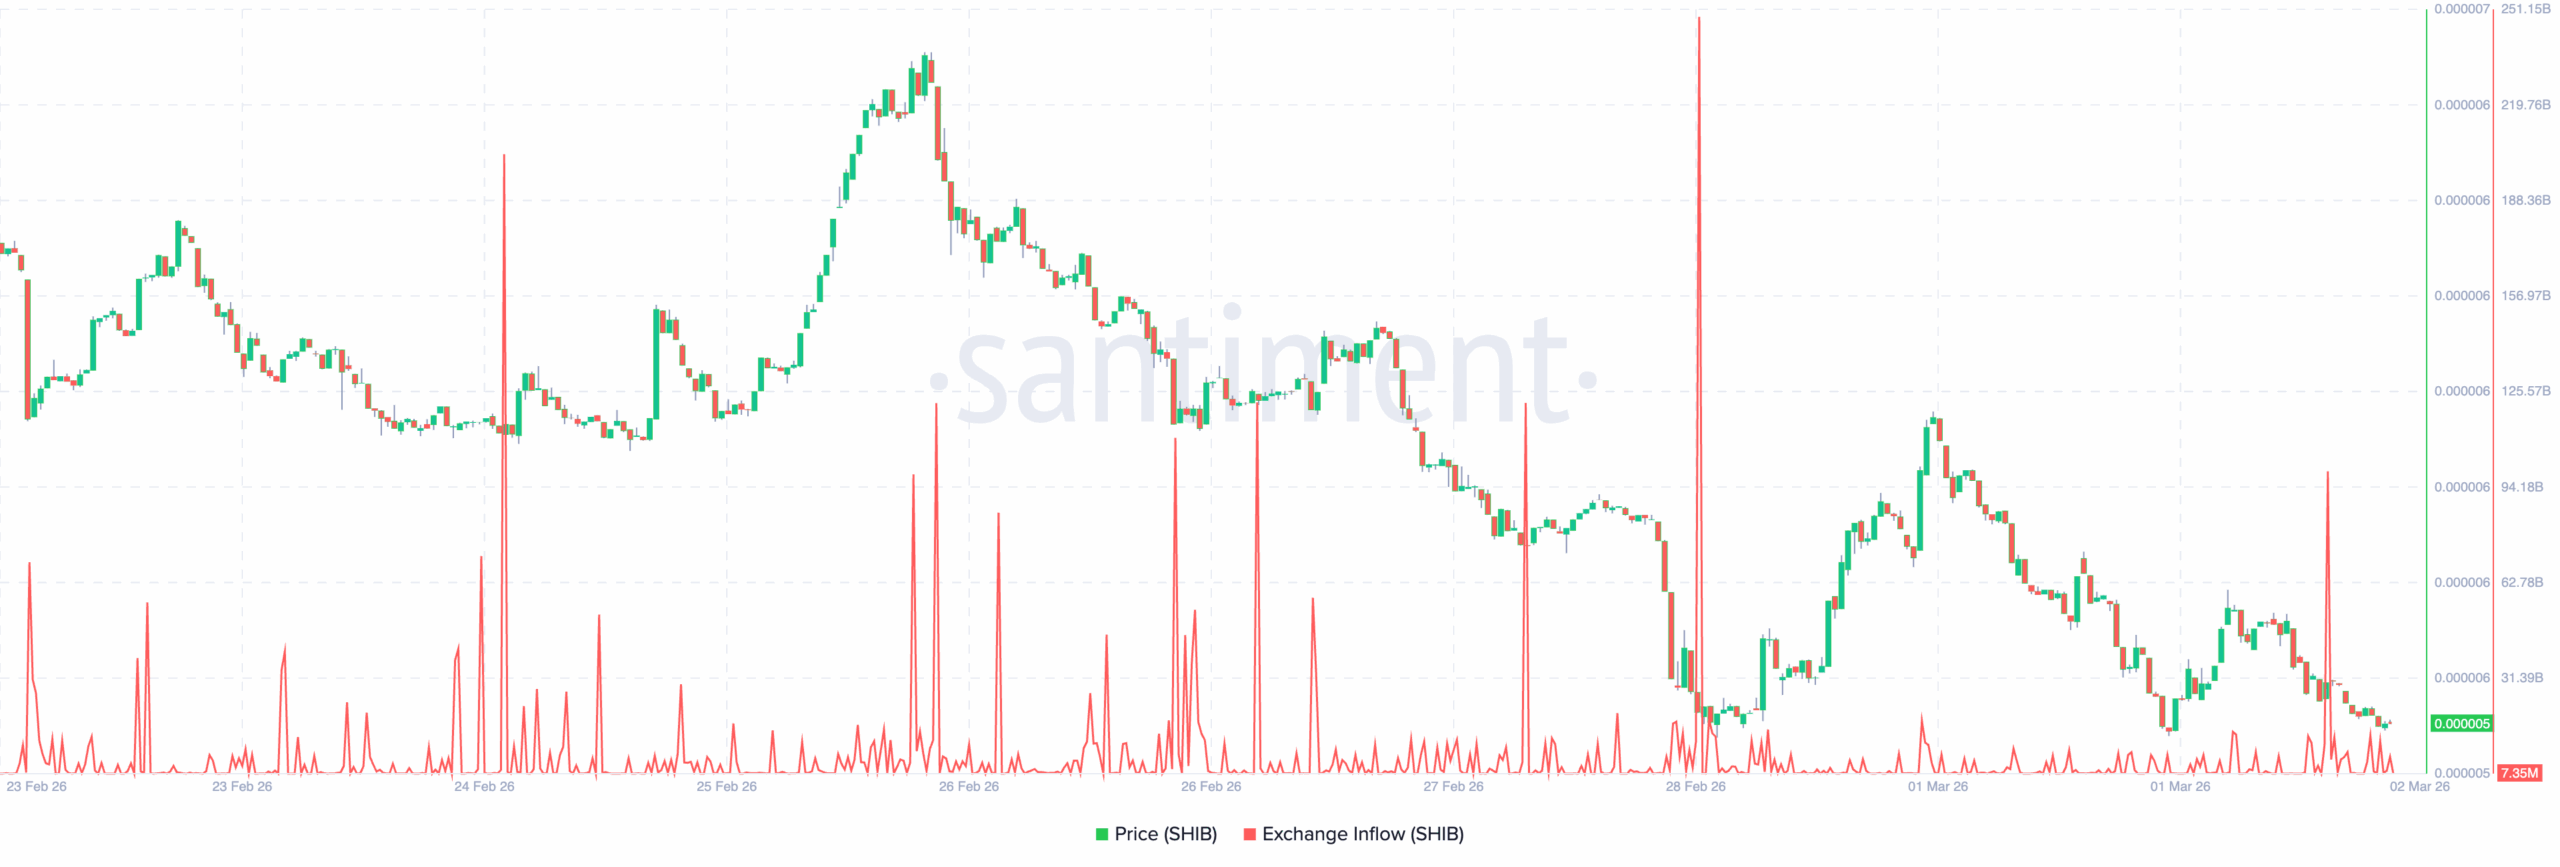
More than 110 billion Shiba Inu (SHIB) tokens have been detected flowing into centralized exchanges this week. But that number could be the tip of the iceberg if care is not taken
Meanwhile, momentum remains weak, and support is weakening.
Amid the set, traders are now asking a critical question: Is this surge positioning for a selloff for SHIB’s price, or setting the stage for a fake-out before a reversal?
Shiba Inu Fails to Overturn Setup
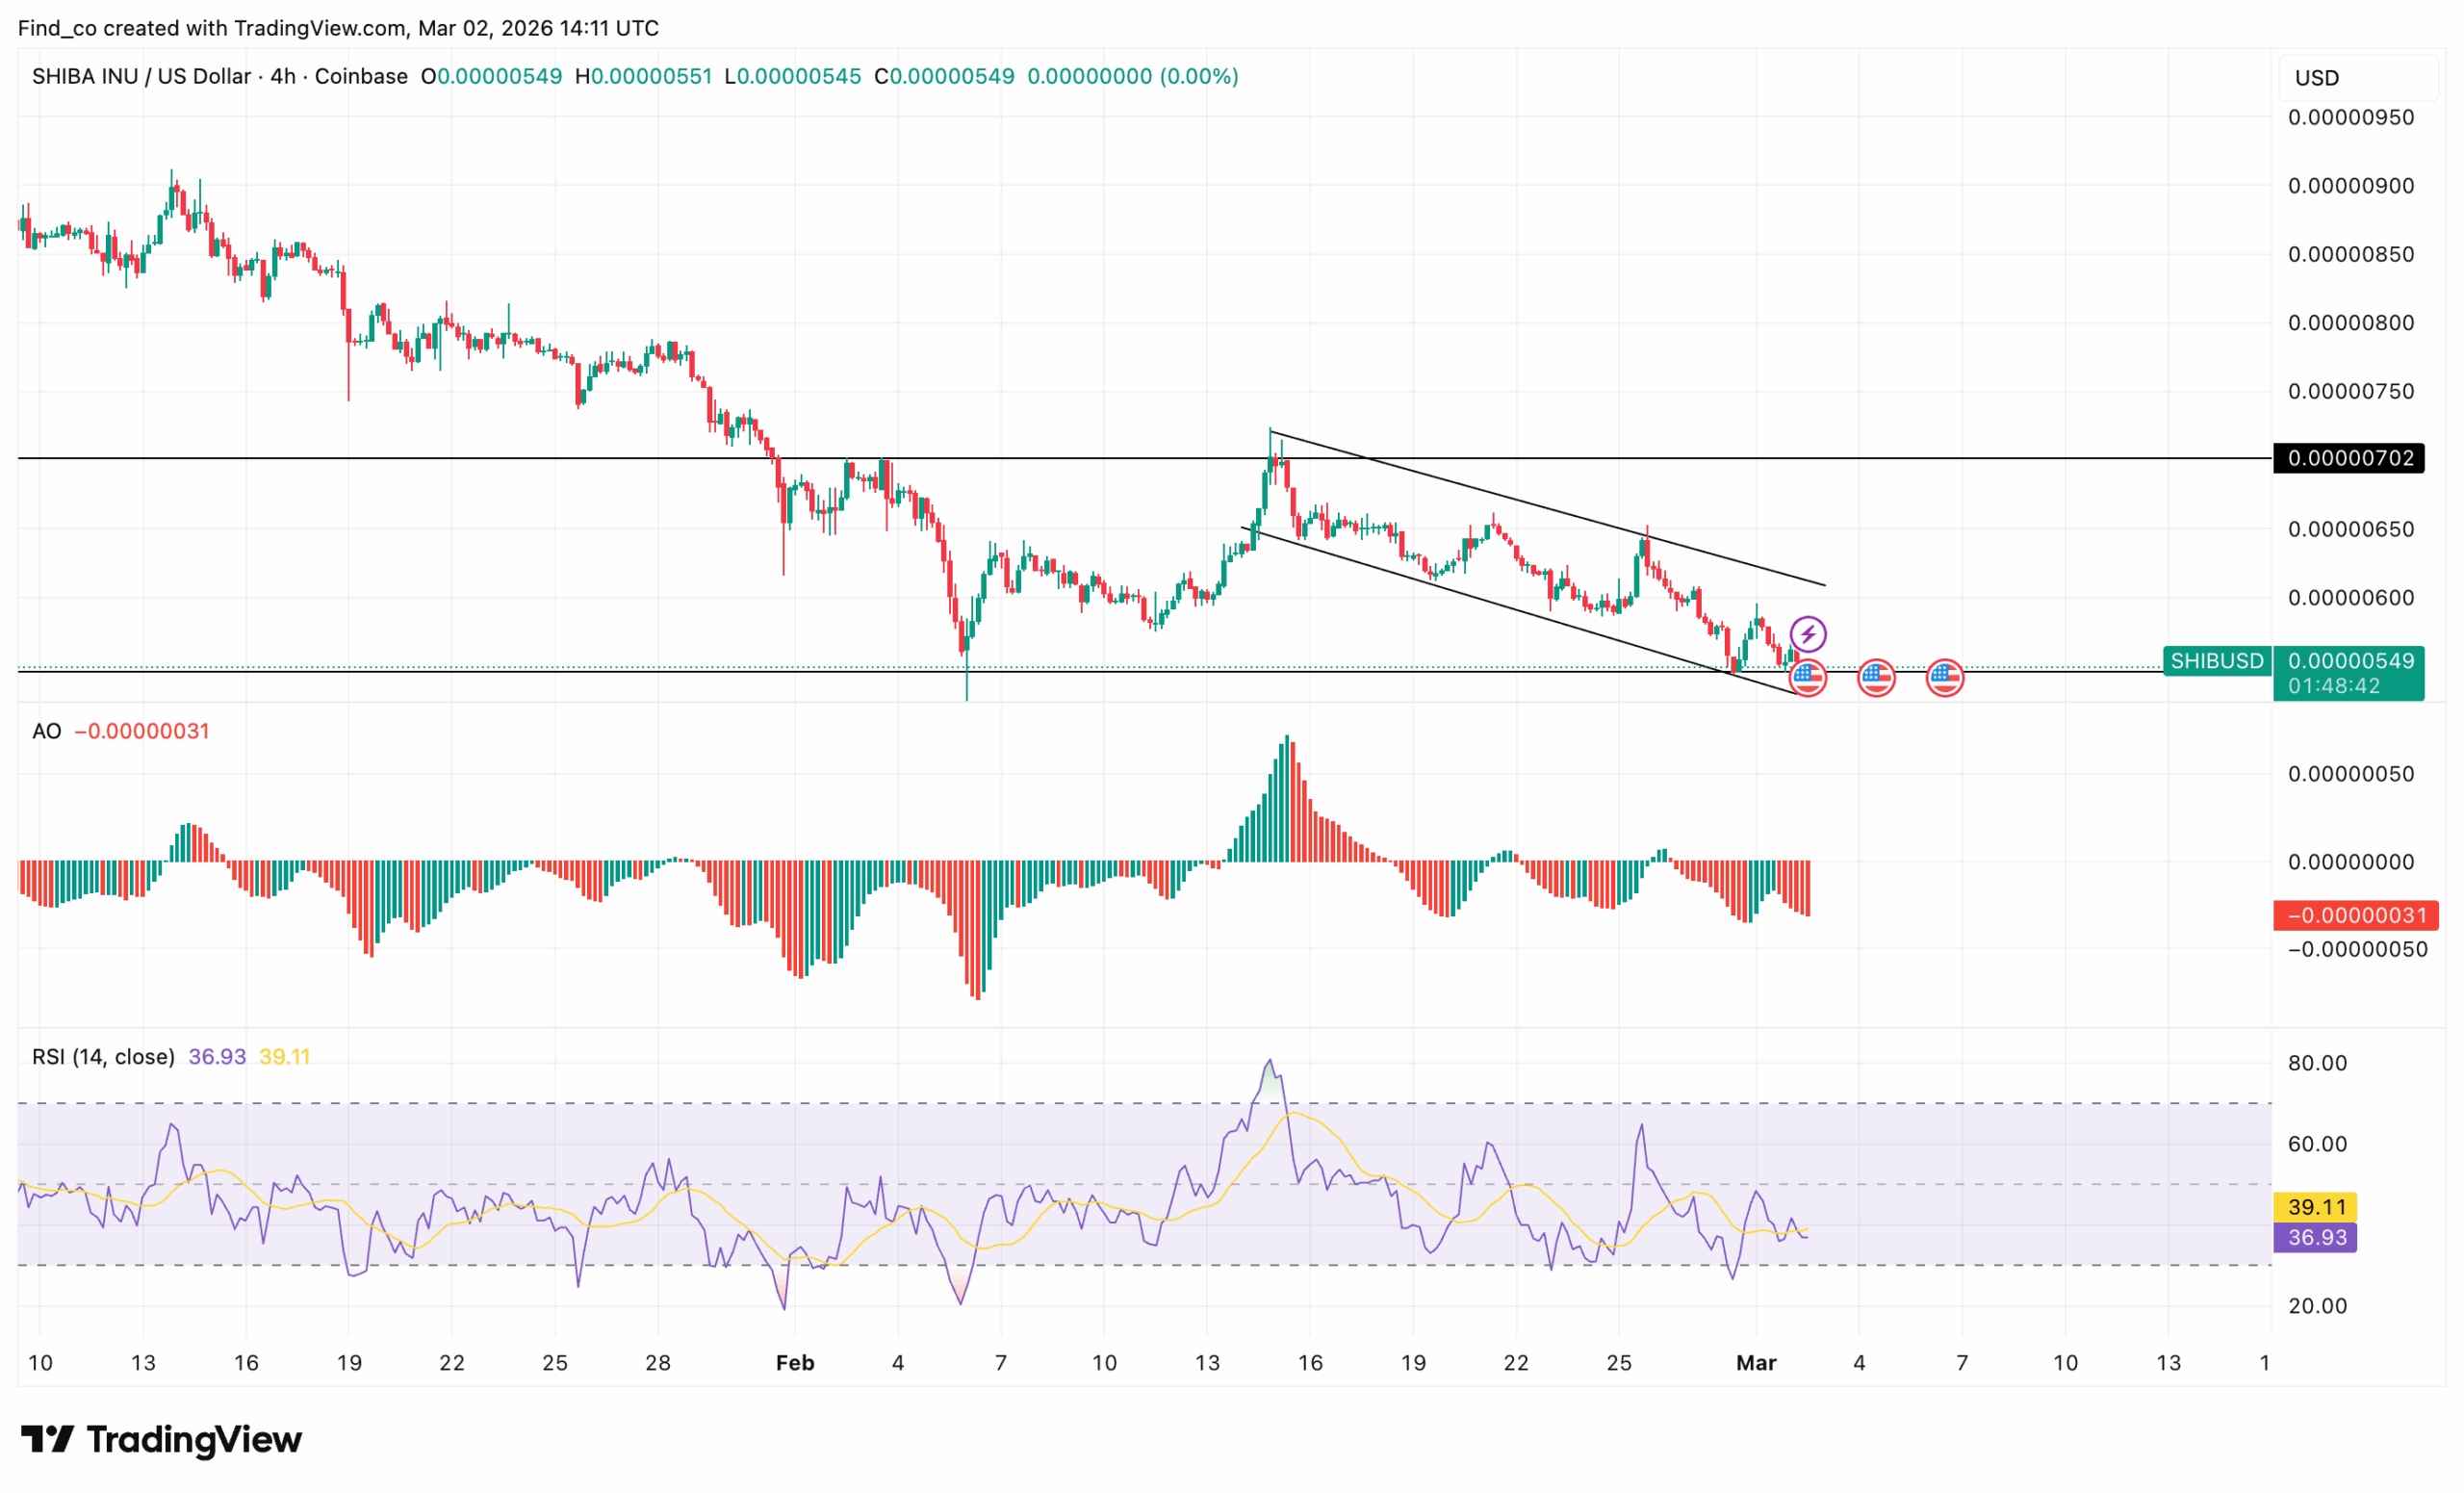
SHIB’s price has remained under pressure from bears. The memecoin continues to print lower highs and lower lows within a defined descending channel.
Each bounce fades quickly, with sellers still controlling the structure of the SHIB price action.
Furthermore, the memecoin’s price now hovers just above a horizontal support zone between $0.0000053 and $0.0000055. This level has previously served as a reaction floor.
Therefore, it is critical. It is worth noting that a break below it would likely accelerate the downside.
At the same time, momentum confirms weakness on the 4-hour chart. The Awesome Oscillator (AO) remains negative, printing consecutive red bars.
That signals a persistent bearish force; although selling intensity is not extreme, it is steady. Consequently, bulls struggle to regain control.
Similarly, the Relative Strength Index (RSI) sits near 36. This keeps the cryptocurrency close to oversold territory but not yet at reversal levels.
In other words, there is room for more downside before exhaustion appears.
Technically, the descending channel is the key structure. Until price breaks above the upper trendline, rallies remain corrective rather than bullish.
Higher Inflows, Lower Value
The mechanics of exchange inflows are straightforward in theory.
Tokens held in private wallets cannot be sold on open markets.
The moment they land on Binance, Coinbase, or OKX, they enter the order book as available supply. More supply without corresponding demand puts price pressure on SHIB, which seems to be affecting its price.
Historically, whale-sized exchange inflows at scale (hundreds of billions, not millions) have preceded a notable SHIB price correction
The pattern, when sustained across multiple sessions, is harder to dismiss than a single isolated spike. What makes this week’s data particularly notable is the simultaneous collapse in burn rate.
On March 1, 2026, SHIB’s daily burn fell 98.94% to just 305,490 tokens. Against a circulating supply of 584.5 trillion SHIB, that is statistically zero.
The deflationary mechanism that bulls point to as SHIB’s long-term value driver has effectively gone dark — at the exact moment exchange supply is surging.
Besides that, the technical picture reinforces the caution. SHIB’s price is trading at $0.0000056, down 93.5% from its all-time high and currently sitting approximately 40% below its 200-day simple moving average of $0.0000095.
SHIB Price Prediction: Bearish
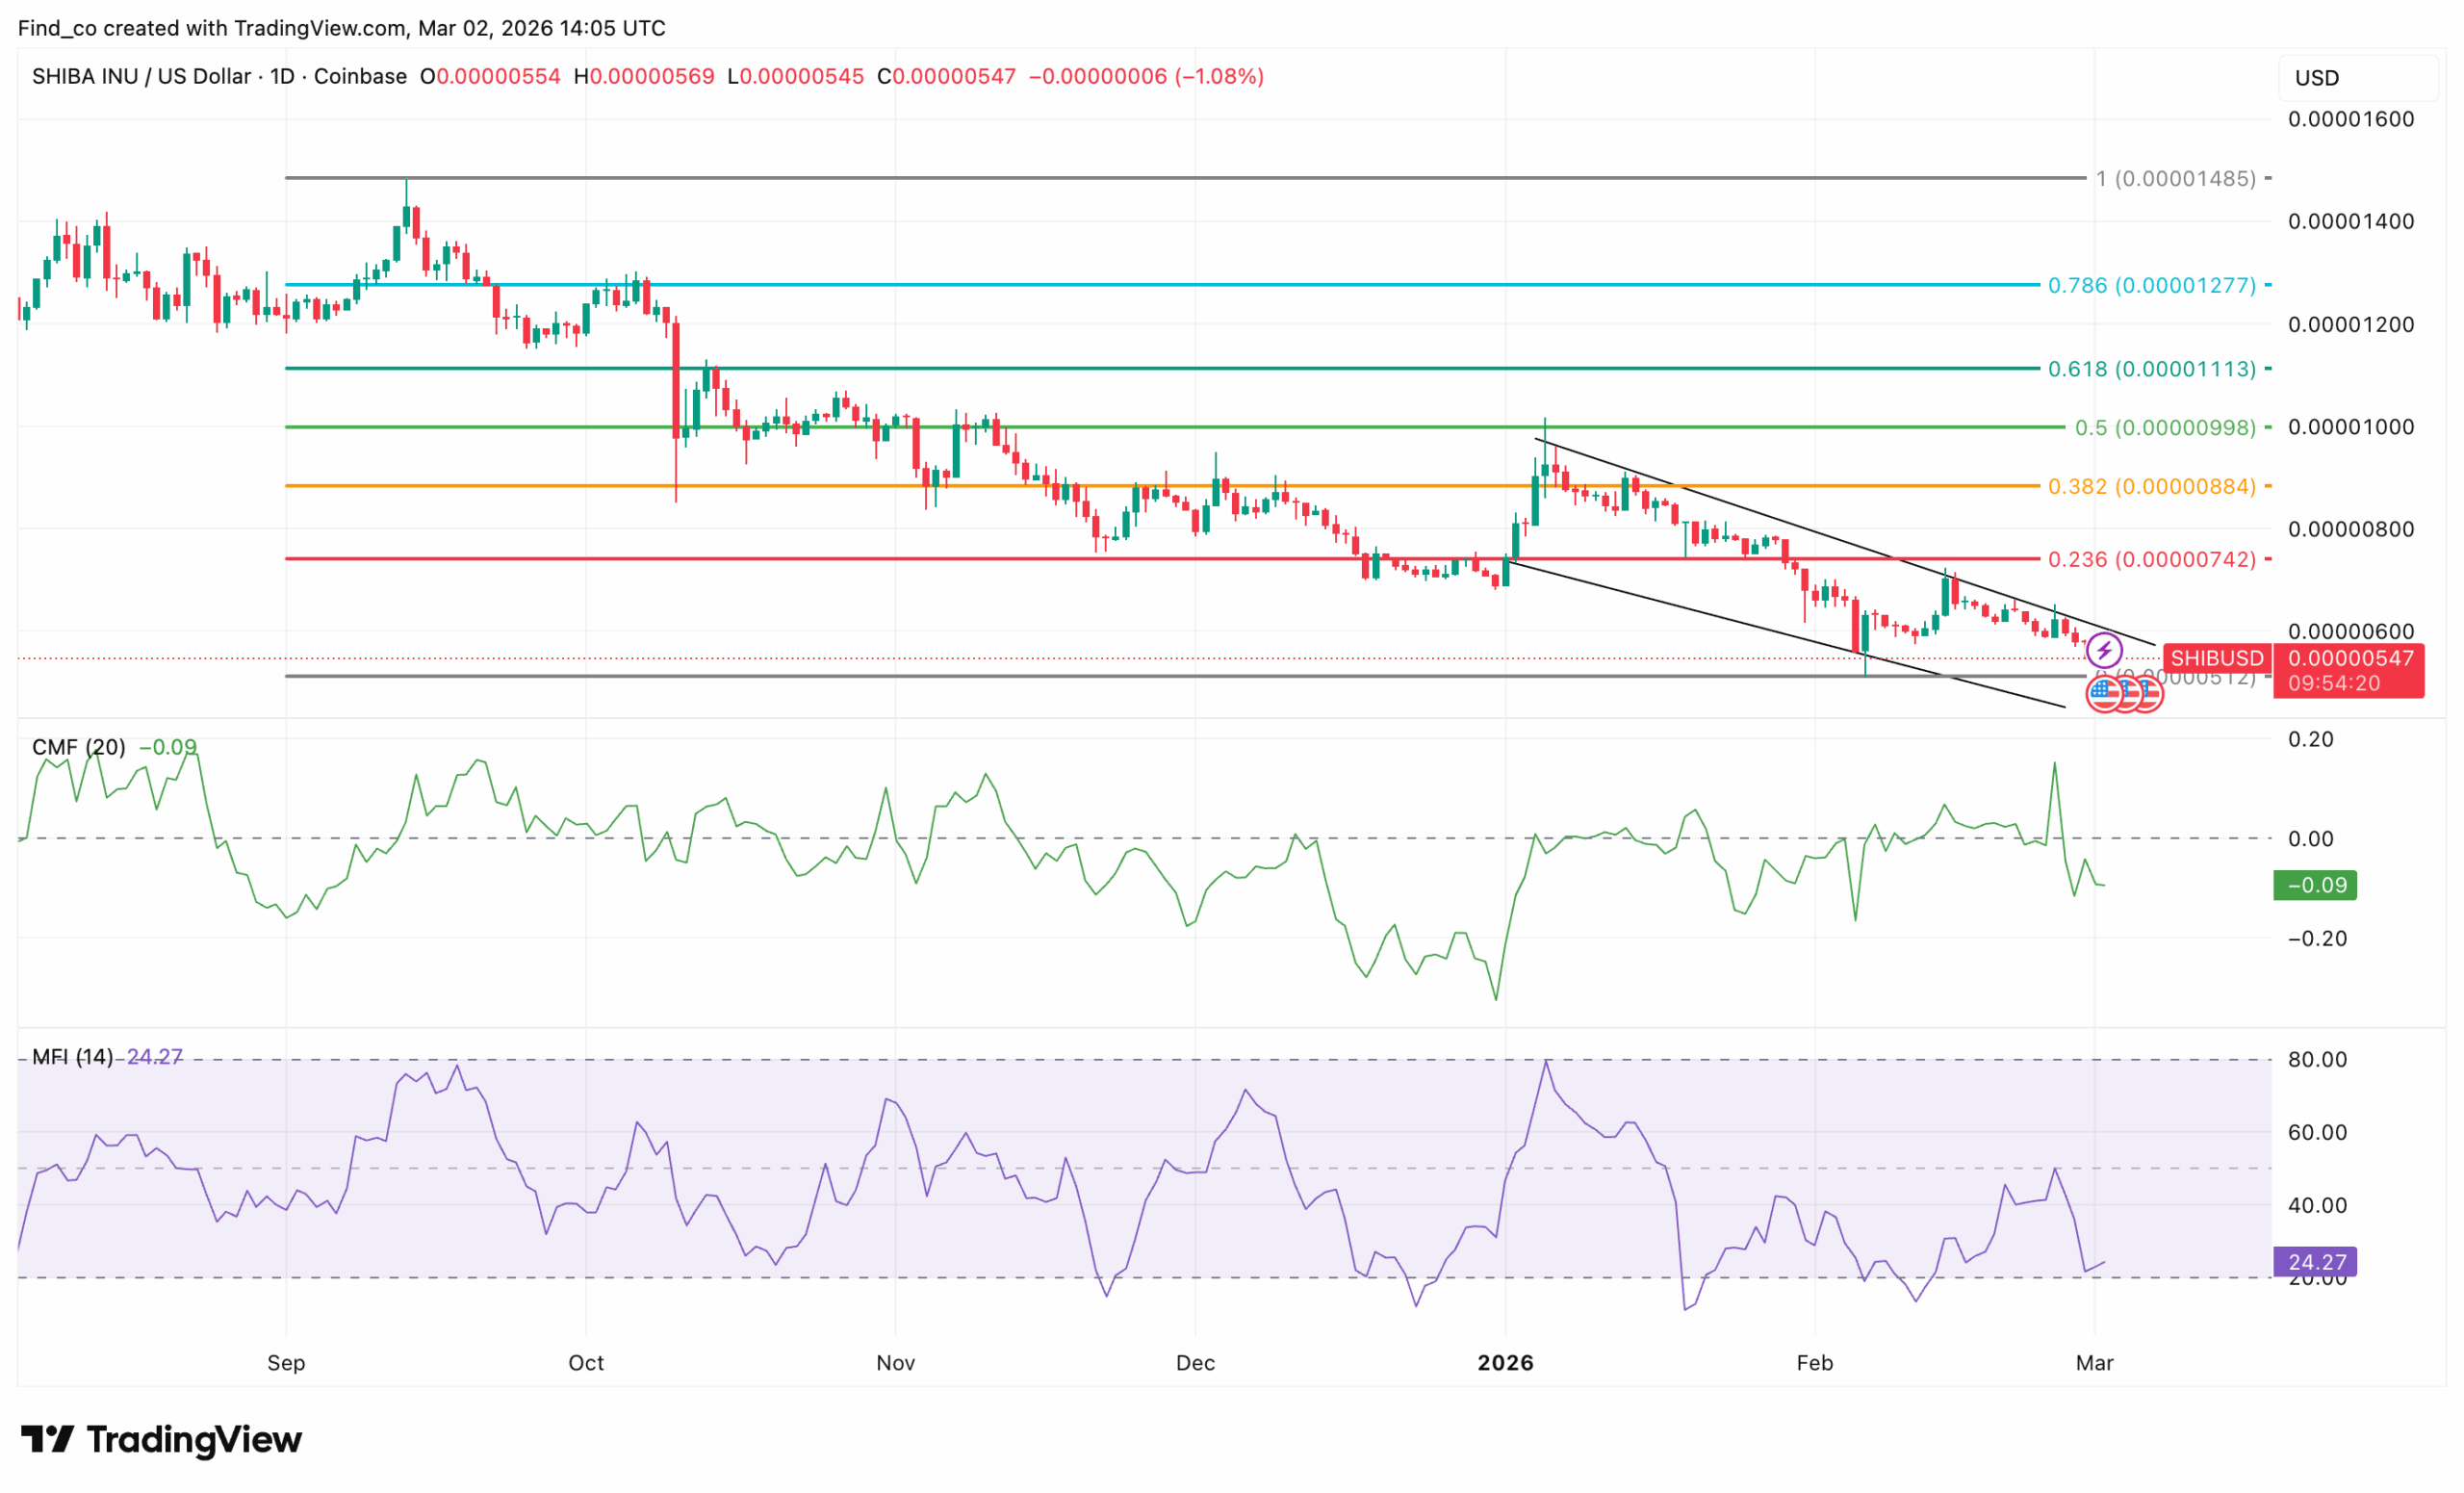
On the daily chart, SHIB is trading just above the lower boundary of its descending channel, with $0.0000050 aligning closely with the 0 Fib retracement level. This confluence makes it a critical structural support.
As long as SHIB’s price holds above this level, the decline remains contained.
However, a breakdown below the 0 Fib would signal that the market has lost its last major retracement support from the current swing structure.
Momentum still favors sellers. The Money Flow Index (MFI) points to weak buying interest, while the negative Chaikin Money Flow (CMF) shows that capital continues to flow out of the asset rather than back in.
If SHIB’s price closes below $0.0000050, the next likely move is toward $0.0000045, where prior demand has historically emerged.
Sustained bearish pressure could then push the price further toward $0.0000040, marking the next key support zone.
Disclaimer:
The information provided in this article is for informational purposes only. It is not intended to be, nor should it be construed as, financial advice. We do not make any warranties regarding the completeness, reliability, or accuracy of this information. All investments involve risk, and past performance does not guarantee future results. We recommend consulting a financial advisor before making any investment decisions.
Victor Olanrewaju is a crypto analyst and reporter at CCN with deep roots in on-chain research and technical analysis. His crypto journey began in 2017, but it was the 2020 Uniswap airdrop that sparked a full-time pivot into the space.
With a foundation in copywriting, Victor honed his craft creating high-converting content for leading crypto brokers — most notably an XRP price prediction that ranked #1 on Google during the 2021 bull run.
He later joined AMBCrypto in 2022, where he combined storytelling with technical and on-chain analysis to cover key market narratives.
In 2024, he expanded his expertise at BeInCrypto, collaborating with analysts and using tools like Glassnode, Santiment, and IntoTheBlock to break down Bitcoin and altcoin trends.
At CCN, Victor covers the top cryptocurrencies, memecoins, macro shifts, blending real-time insights with deep-dive metrics.
He holds a Bachelor’s degree in Physics from the University of Ibadan, equipping him to simplify complex data for a wide audience. Follow his work or connect on LinkedIn or X.