On-chain metrics show accumulation, but market conditions are not fully risk-on.
Technically, SHIB holds a bull flag that could support a short-term breakout.
Like several memecoin, Shiba Inu (SHIB) had a good start to the year.
But over the past seven days, things have changed as SHIB’s price has lost part of the gains it made.
However, a look at the on-chain perspective shows that several large holders are unwilling to sell. Historically, when this happens, SHIB’s price breaks out.
But considering the differences in market conditions, can the memecoin repeat the same move?
Rare Shiba Inu Signal Returns
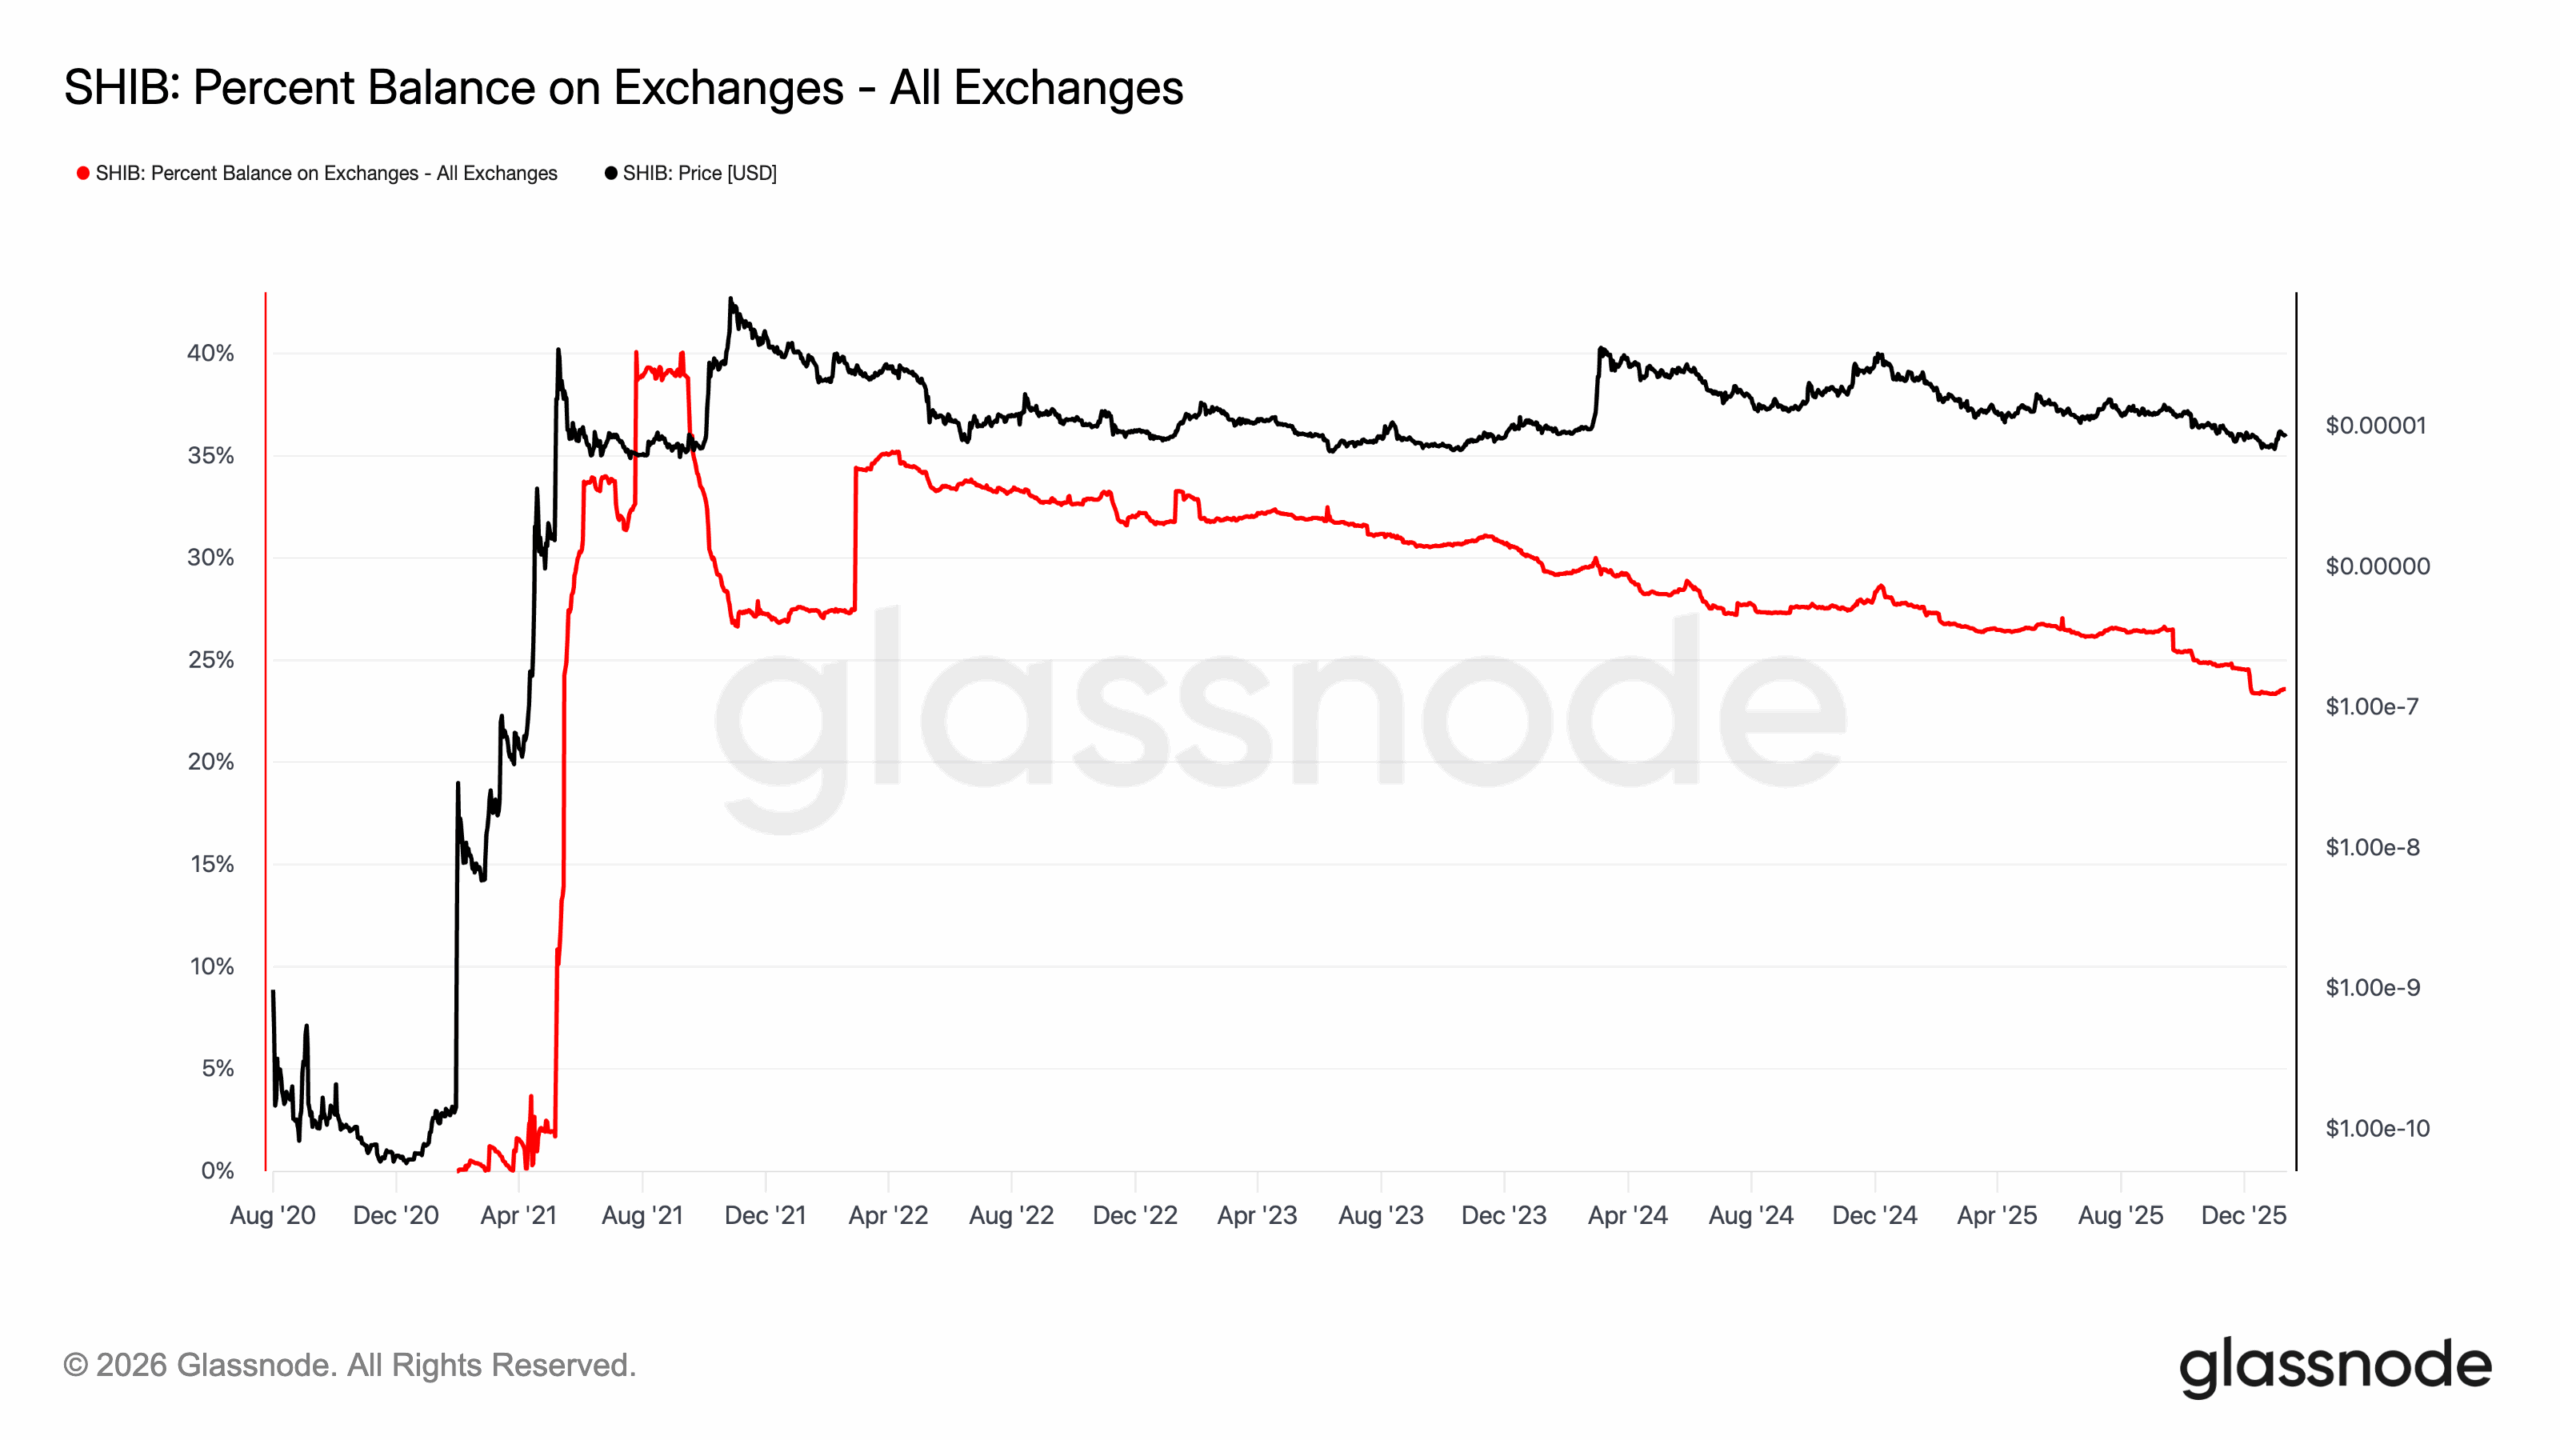
The key on-chain metric to watch right now is SHIB Balance on Exchanges.
Glassnode data shows that only 23.55% of SHIB’s circulating supply is held on exchanges.
The last time exchange supply fell to a similar level was May 2021, when SHIB was still trading near cycle lows.
Today, the setup looks comparable. Only about 290.4 trillion SHIB is held on exchanges, down from roughly 370.3 trillion, out of an estimated 589.24 trillion circulating supply.
Since December 5, net exchange outflows have totaled approximately 80 trillion SHIB, and “fresh” wallets have reportedly withdrawn roughly 82 trillion SHIB from centralized exchanges over the last 60 days.
This matters because exchange balances represent the most liquid portion of the supply. In simple terms, coins on exchanges are the easiest to sell quickly.
So, when that pool shrinks, immediate sell pressure often drops. In other words, SHIB’s price may need less buying volume to move up if exchange supply stays constrained.
Still, the signal is not automatic. Outflows support a bullish bias only if demand holds up.
If the price spikes and deposits rush back onto exchanges, that can reverse the setup fast and reintroduce sell pressure.
For now, though, sustained exchange outflows suggest accumulation behavior and a tighter supply picture, which can help SHIB’s price build a more substantial base and attempt a higher move.
No Full Risk-On Mode Yet
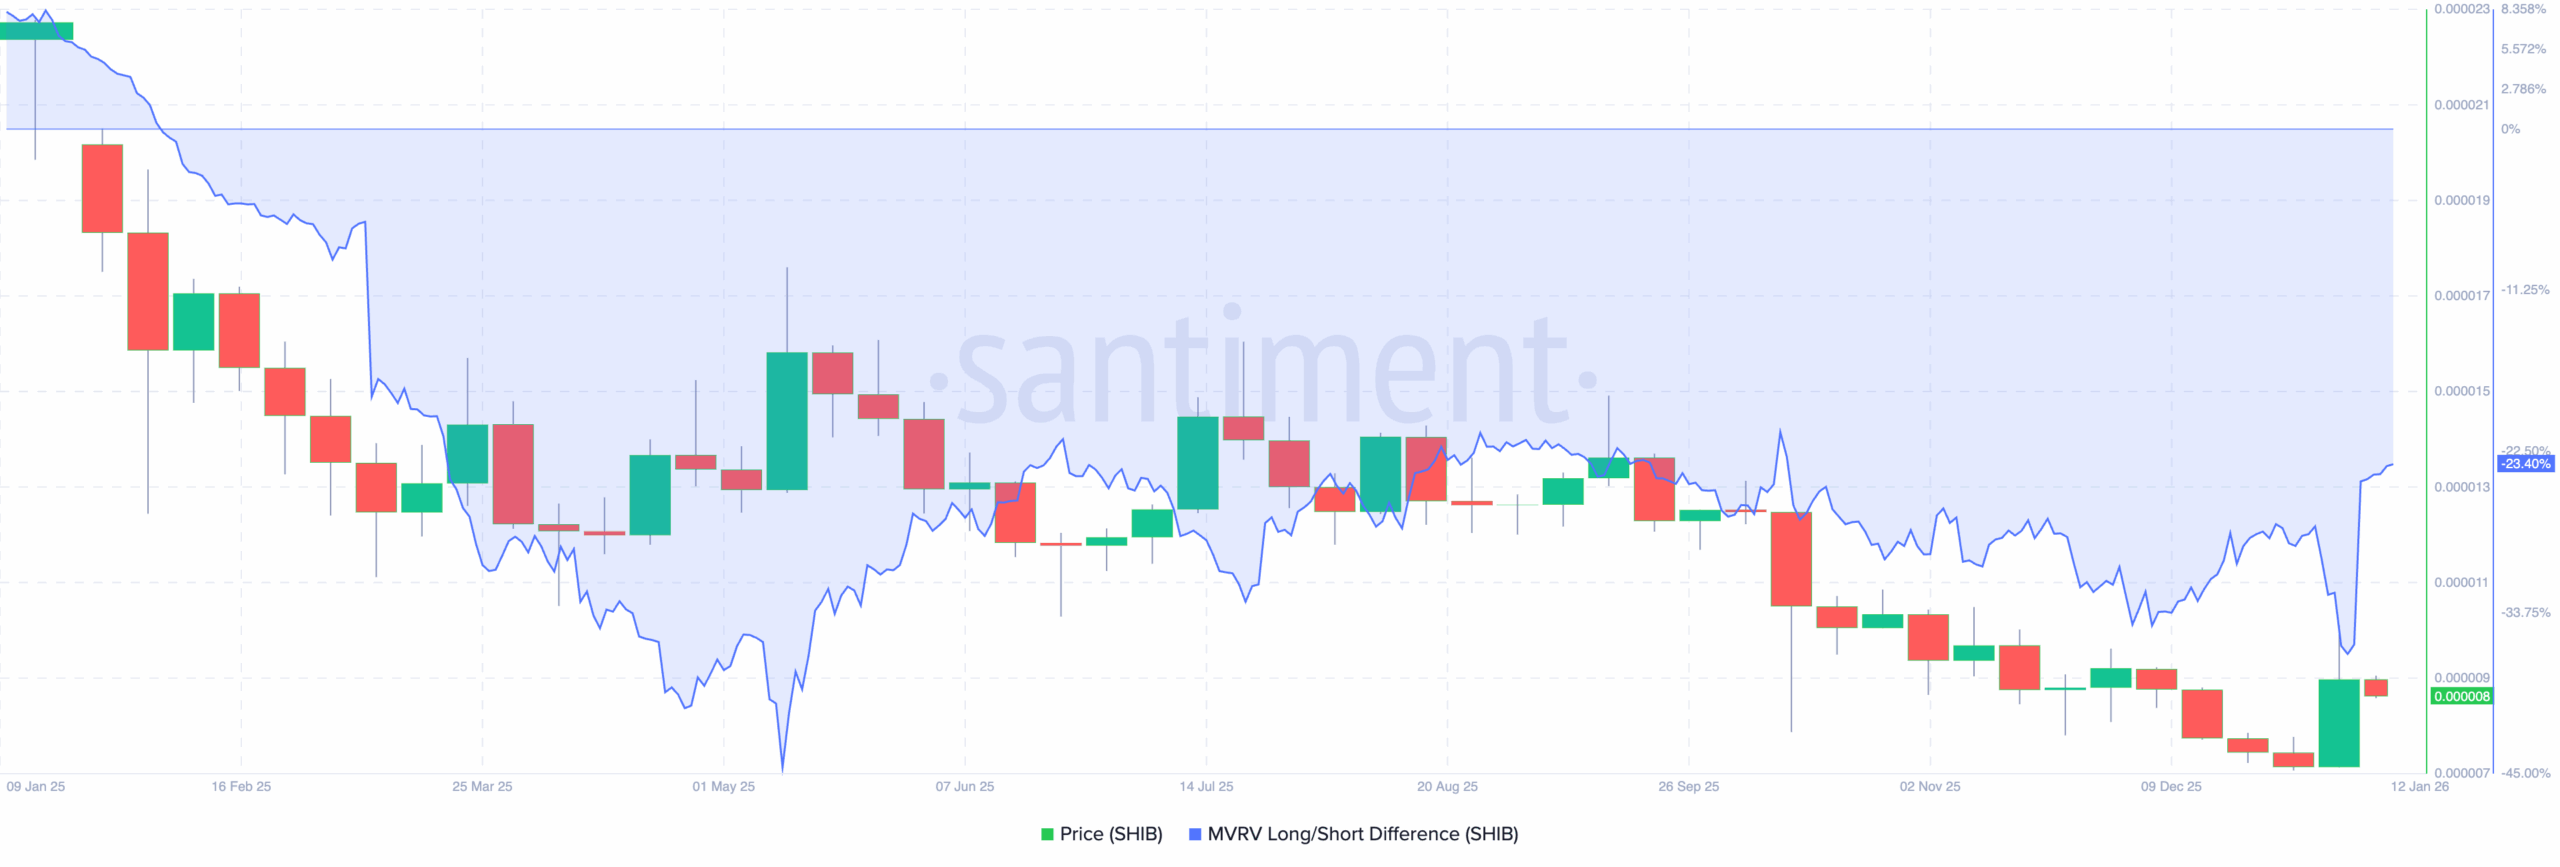
While SHIB could still push higher this year, the MVRV Long/Short Difference suggests it is not set up for a 2021-style blow-off move toward $0.000075.
Back in the 2021 breakout, that metric surged to 232.50%.
Such extreme reading typically reflects a market that has shifted into full risk-on mode, where long-term holders hold large unrealized profits and short-term buyers chase momentum aggressively.
Today, the picture is very different. The MVRV Long/Short Difference stands at -23.47%, indicating that the balance of unrealized profit is weaker and sentiment is far less overheated.
This kind of reading typically aligns with caution, underperformance, or early-stage positioning rather than peak-cycle conditions.
As a result, SHIB’s price may still trend upward. Still, the data suggests that a return to the prior peak is unlikely without a significant shift in profitability, demand, and broader market liquidity.
SHIB Price Analysis: Ready to Pop
From a technical perspective, the daily chart indicates that SHIB’s price has pulled back.
However, the structure still leans bullish. The price action has formed a bull flag, which often acts as a continuation pattern after a prior move higher.
Momentum indicators support that view. The Moving Average Convergence Divergence (MACD) has flashed a bullish crossover, indicating that upside momentum may be regaining strength.
If this signal holds, SHIB’s price could defend the $0.0000079 support and avoid a deeper breakdown.
In that scenario, the next upside target sits near $0.0000096, which aligns with the 0.618 Fibonacci level. If bullish momentum accelerates, SHIB could extend toward $0.000011.
Disclaimer:
The information provided in this article is for informational purposes only. It is not intended to be, nor should it be construed as, financial advice. We do not make any warranties regarding the completeness, reliability, or accuracy of this information. All investments involve risk, and past performance does not guarantee future results. We recommend consulting a financial advisor before making any investment decisions.
Victor Olanrewaju is a crypto analyst and reporter at CCN with deep roots in on-chain research and technical analysis. His crypto journey began in 2017, but it was the 2020 Uniswap airdrop that sparked a full-time pivot into the space.
With a foundation in copywriting, Victor honed his craft creating high-converting content for leading crypto brokers — most notably an XRP price prediction that ranked #1 on Google during the 2021 bull run.
He later joined AMBCrypto in 2022, where he combined storytelling with technical and on-chain analysis to cover key market narratives.
In 2024, he expanded his expertise at BeInCrypto, collaborating with analysts and using tools like Glassnode, Santiment, and IntoTheBlock to break down Bitcoin and altcoin trends.
At CCN, Victor covers the top cryptocurrencies, memecoins, macro shifts, blending real-time insights with deep-dive metrics.
He holds a Bachelor’s degree in Physics from the University of Ibadan, equipping him to simplify complex data for a wide audience. Follow his work or connect on LinkedIn or X.