ETH holders booked $74.58M in profits even as Ethereum's price fell 10% — bearish signals are stacking up. Credit: CCN
Share
Key Takeaways
Ethereum’s network realized profits hit a three-week high of $74.58 million on Wednesday, even as ETH’s price slid nearly 10% over the past three days.
Santiment data shows holders who accumulated below $2,000 in February and March are now locking in gains, while elevated on-chain activity near $2,241 is amplifying the realized profit totals.
Bearish signals are aligning on and off chain: $183.81M in spot ETF outflows, short-term holder supply at a YTD low of 4.8%, a daily MACD bearish crossover, and persistently negative Chaikin Money Flow all point to deeper declines if ETH loses $2,234 support.
Ethereum posted its strongest day of network realized profits in three weeks on Wednesday, as holders banked $74.58 million.
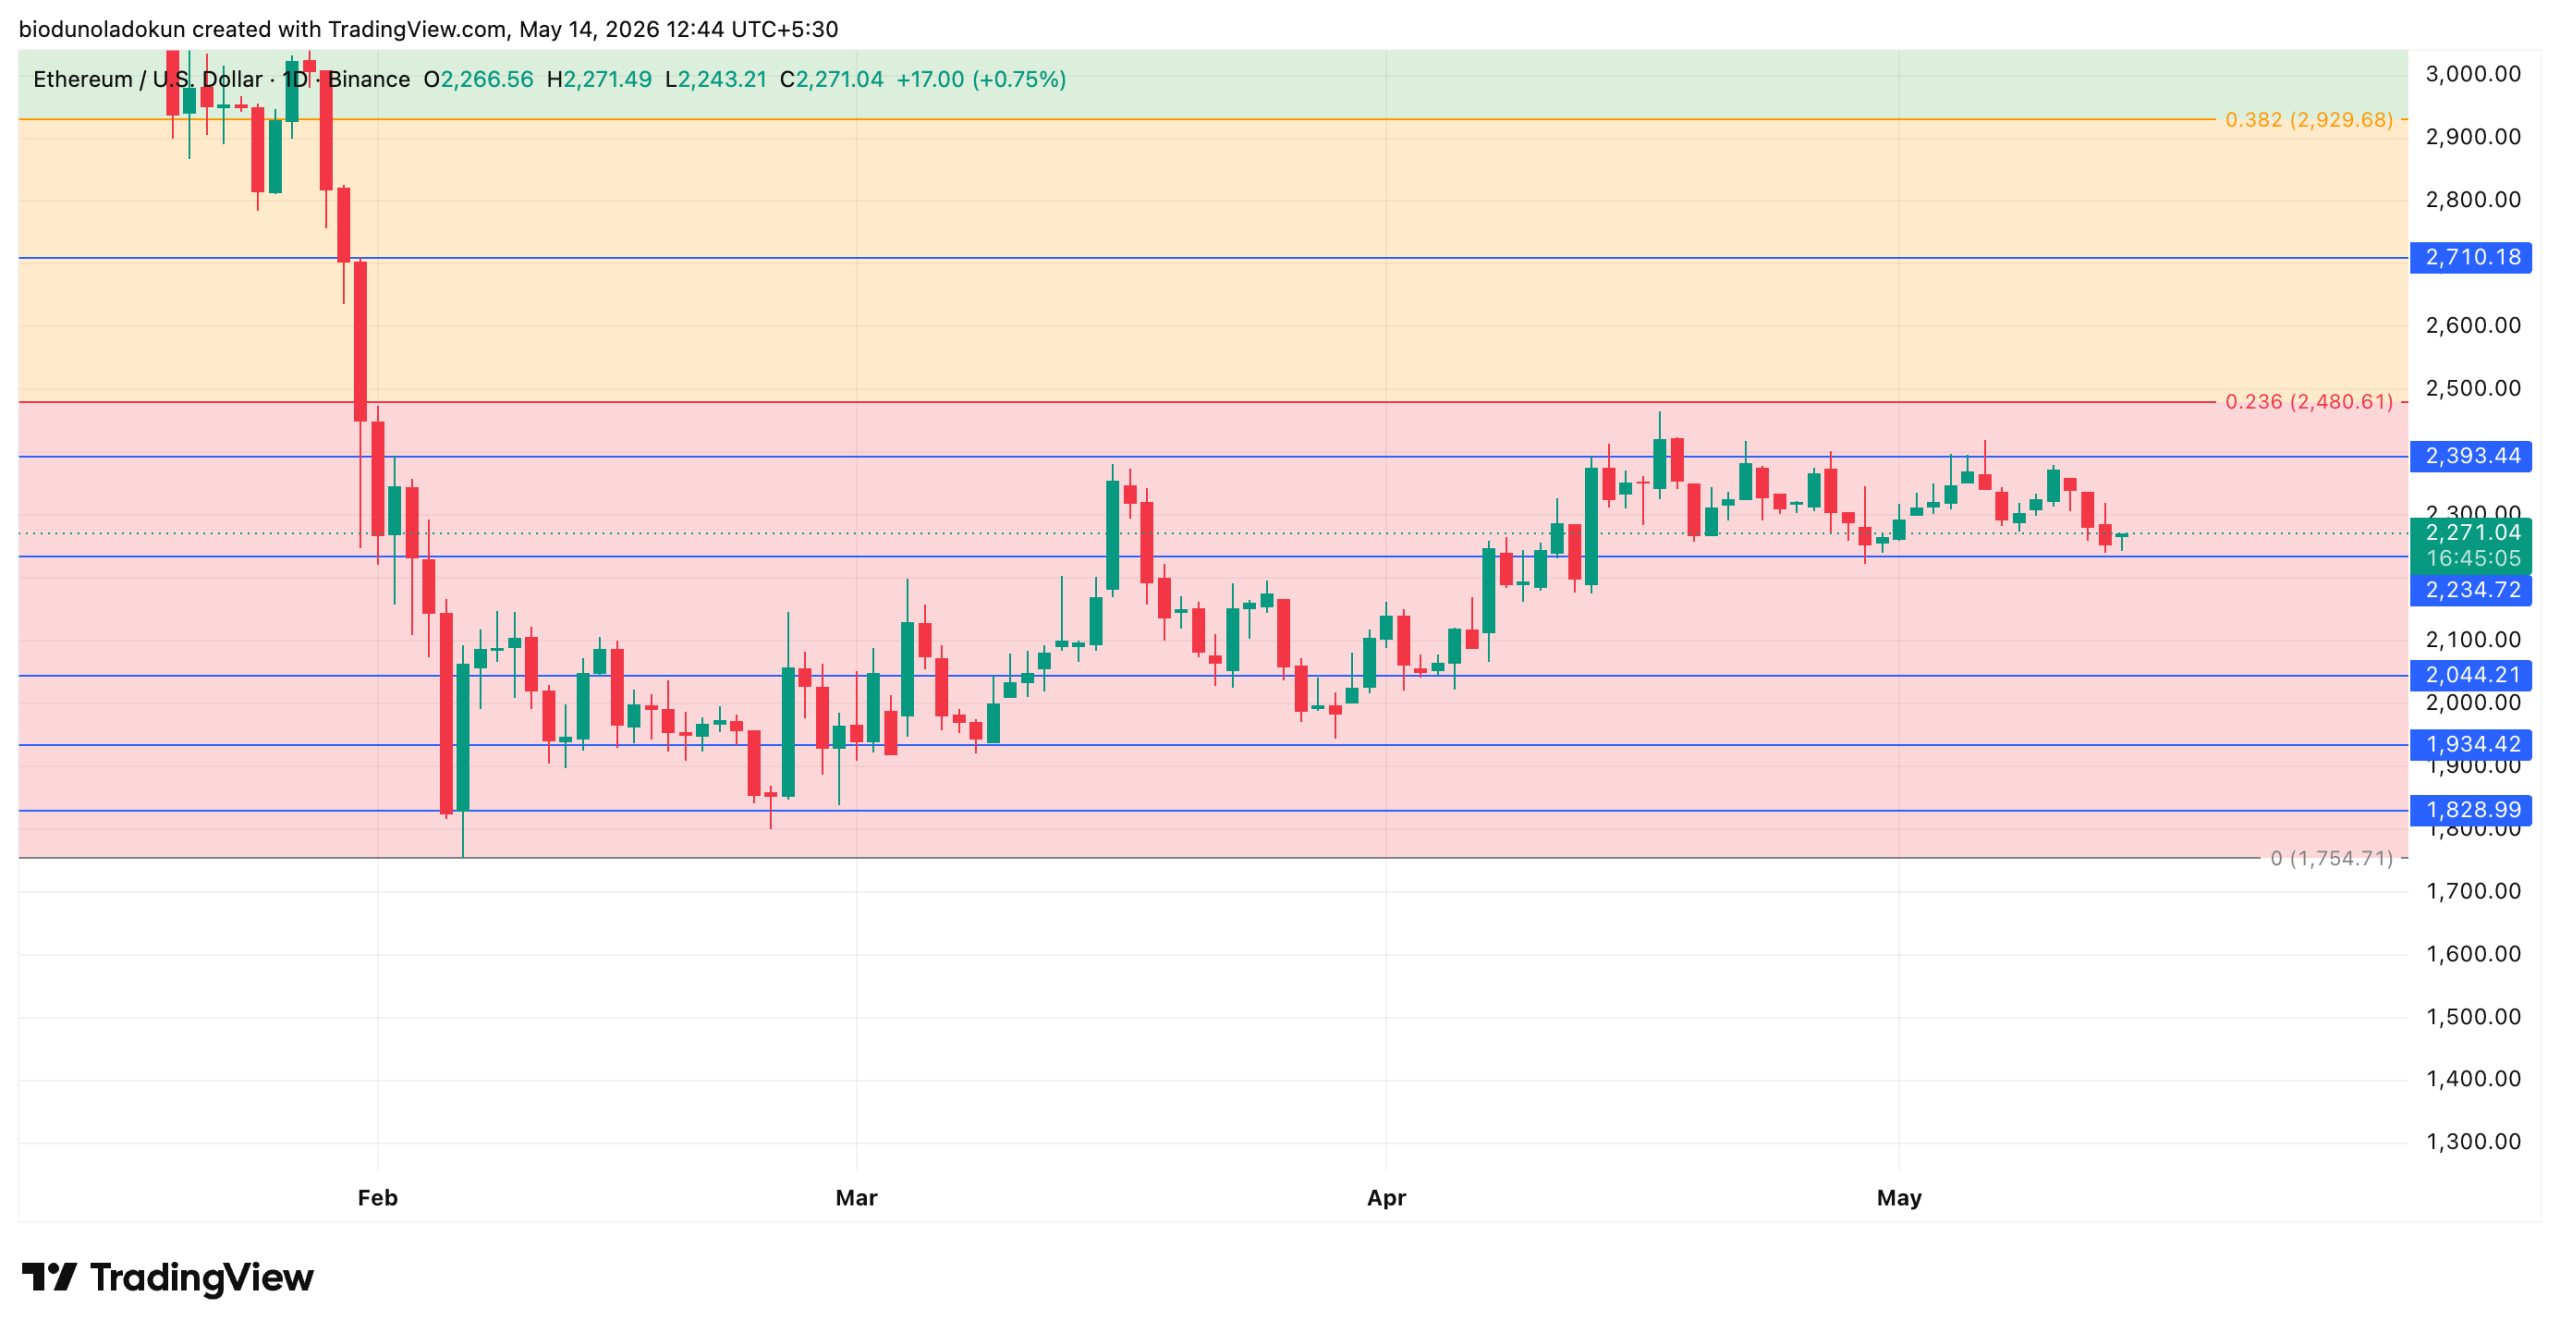
The spike stands in sharp contrast to ETH’s recent price action. The coin has been stuck in a tight consolidation for more than a month, repeatedly rejected at a near $2,400 ceiling, and finding support at $2,200. ETH is currently trading near $2,247, down almost 10% in the past three days.
So why are holders booking gains into weakness?
Why ETH Holders Are Selling Into the Dip
In a post on X, on-chain data provider Santiment highlighted the two reasons for the spike in ETH’s network realized profit even as its price dwindles.
Firstly,ETH spent much of February and March trading below $2,000, a period when more strategic wallets quietly accumulated amid geopolitical troubles and broader crypto-market uncertainty.
Those wallets are still in profit even after the mid-May decline, and many are now choosing to lock in gains. Second, on-chain activity has been heating up around the $2,241 zone — another reason Santiment flagged the realized profit spike. Per the X post, ETH’s price is tightly compressed at this level on the 4-hour chart.
Tight price ranges like this often mask heavy activity beneath the surface. When price stalls but trading remains active, it signals that coins are quietly changing hands.
This matters because realized profit is only counted when a coin actually moves on-chain. The more coins that move, the more profit (or loss) is recorded.
So even if each holder makes only a small profit, the high number of transactions adds up to a large network-wide total.
ETH Spot ETFs Bleed as Institutions Step Back
Interestingly, the current surge in network realized profits is not a sign for other traders to ape in. On-chain and technical data indicate the broader market remains bearish.
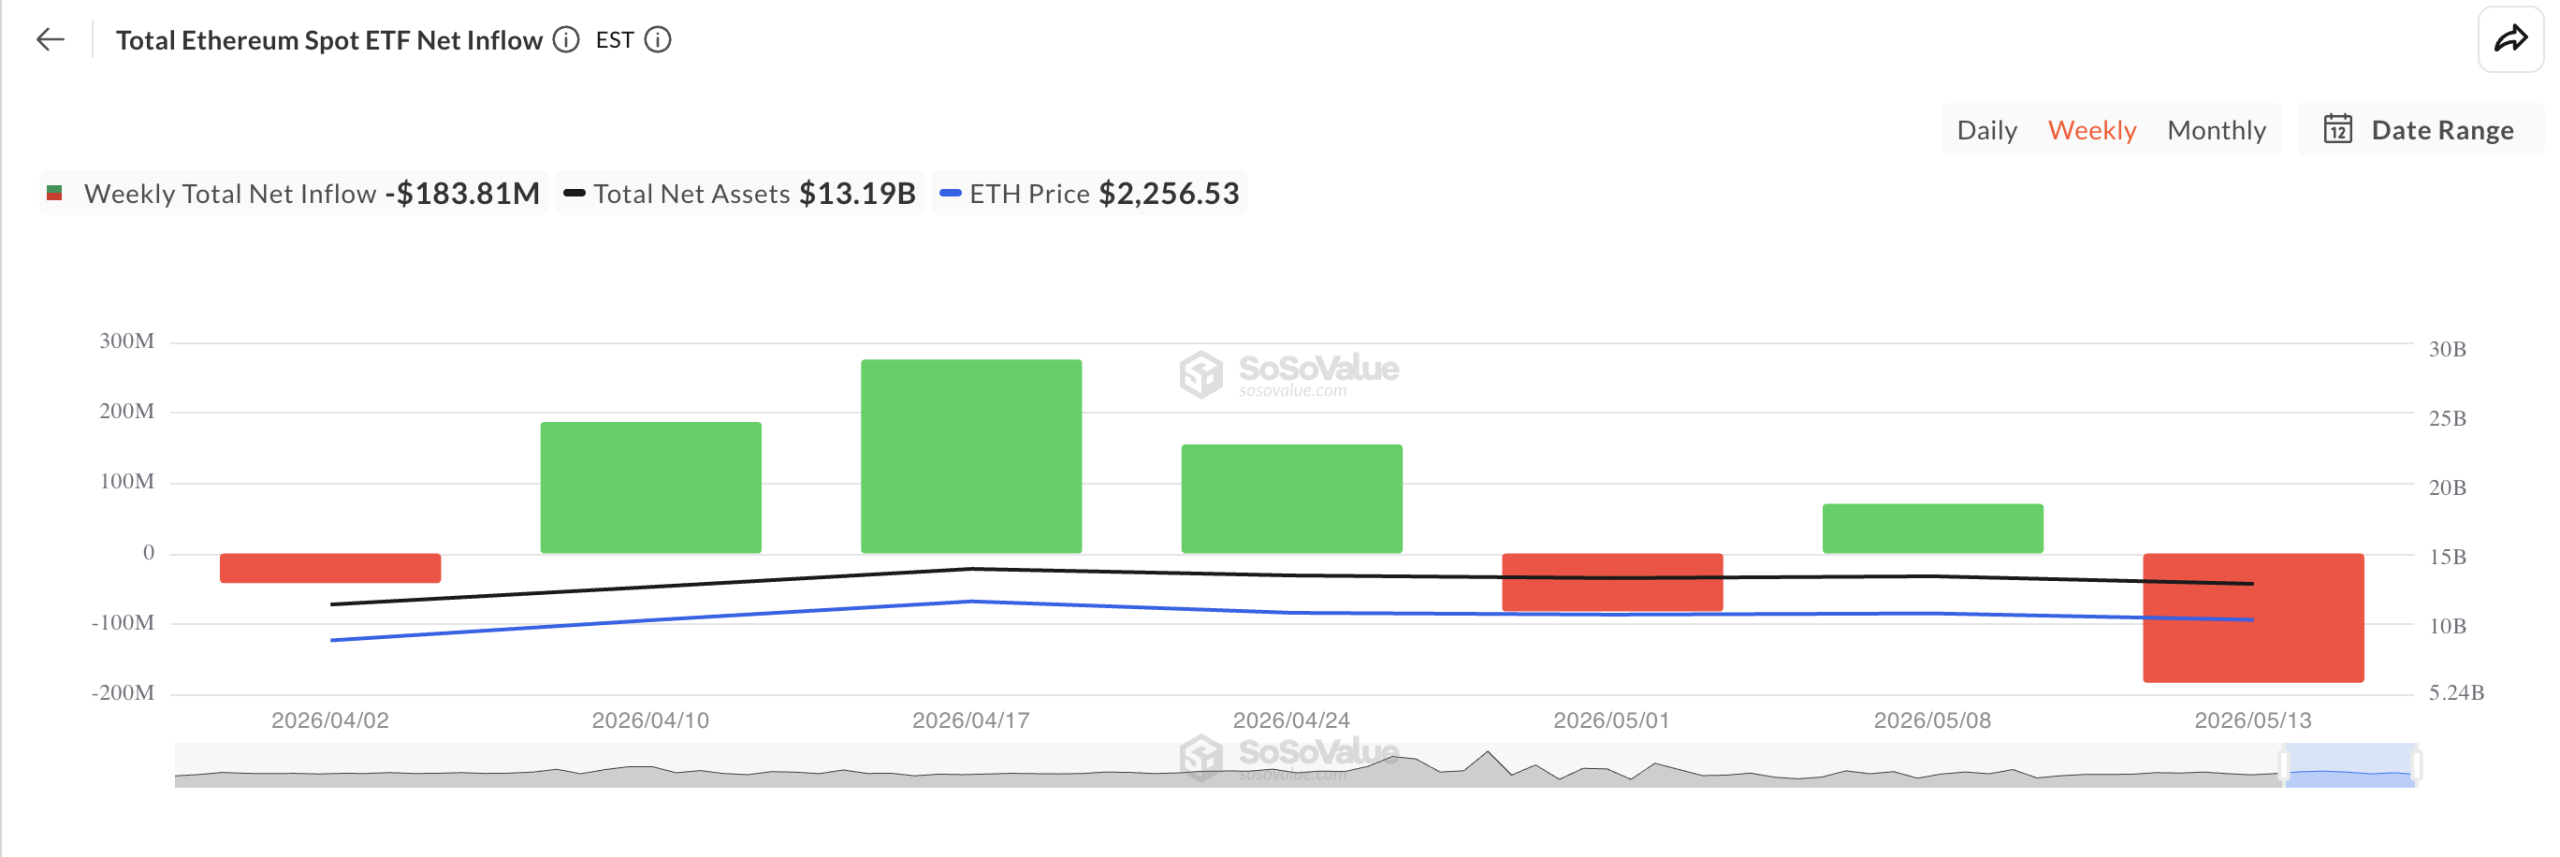
One of the clearest bearish signals is this week’s net outflow from Ethereum spot ETFs.
Per SoSoValue, over the past three sessions, net outflows from these investment vehicles have totaled $183.81 million. This is in sharp reversal from the prior week’s $66.9 million inflow.
Total Ethereum Spot ETF Net Inflow | Credit: SoSoValue
The reversal is significant because spot ETF flows have become a reliable proxy for institutional conviction.
So when inflows stall like this, especially during periods of lackluster price action, this cohort of market participants is stepping back rather than buying the dip.
ETH Short-Term Holders Are Distributing
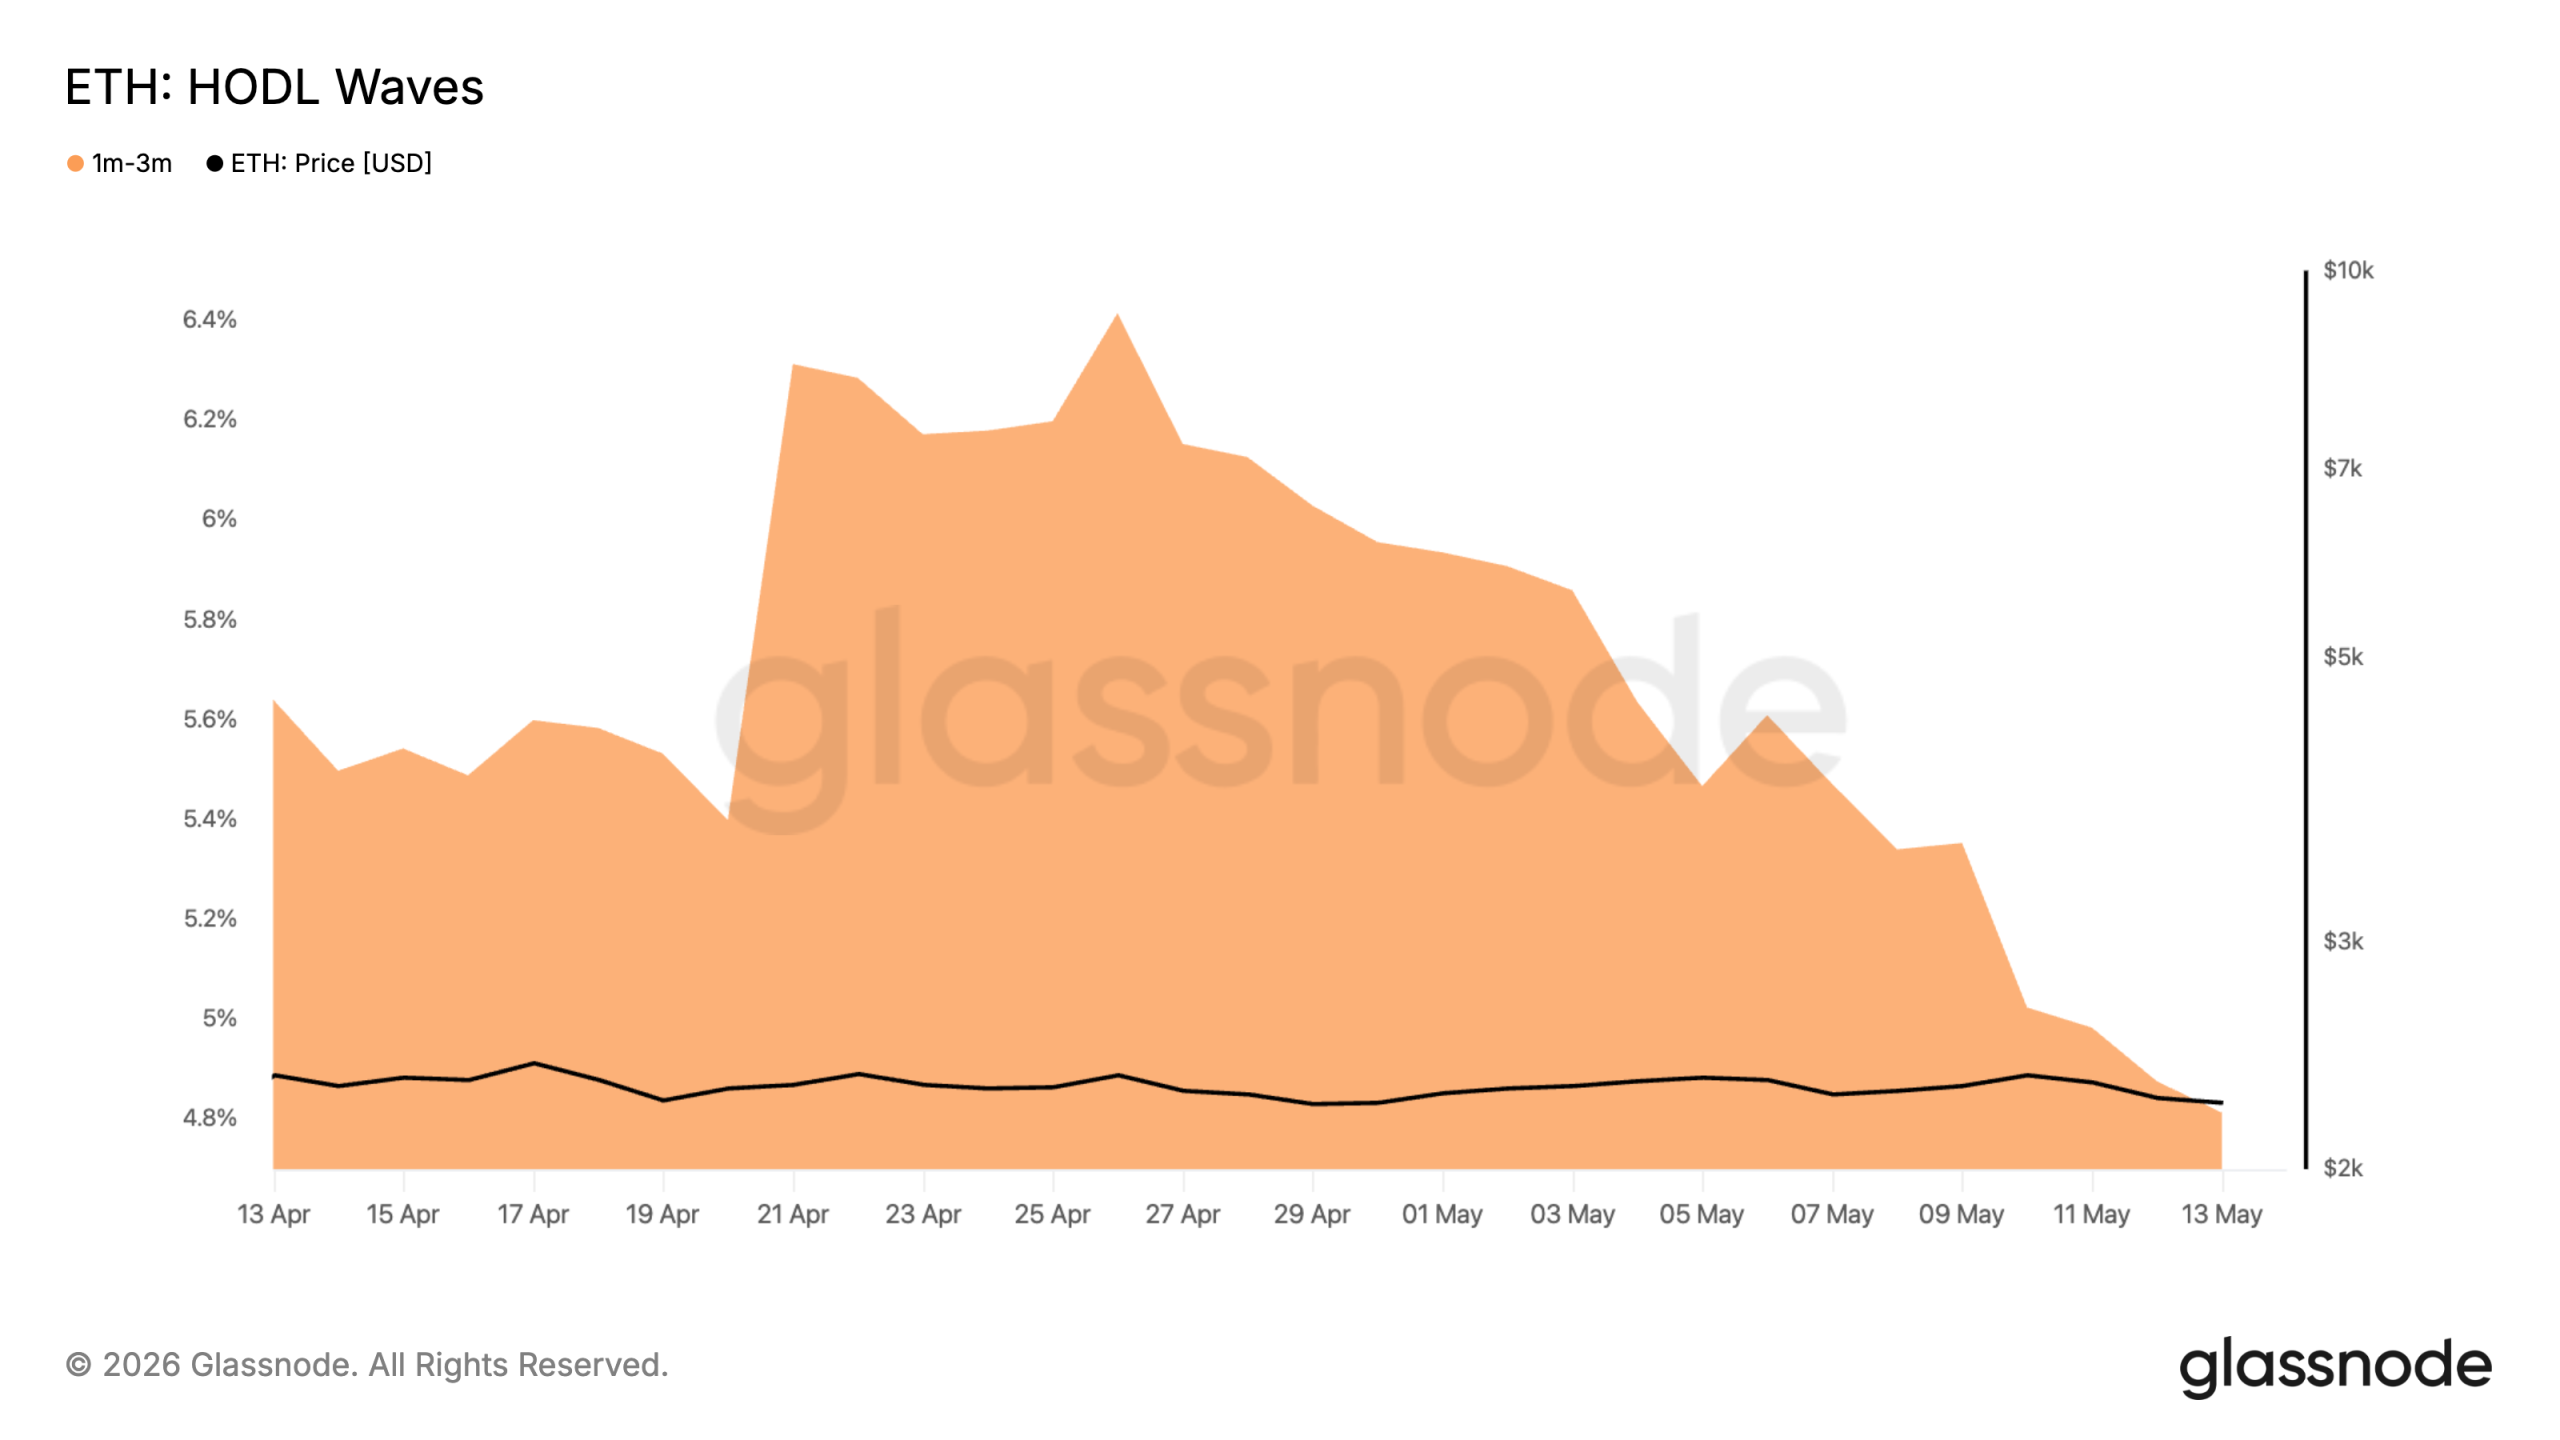
According to Glassnode, ETH short-term holders — those that have held their coins for 1–3 months — have steadily reduced their supply since April 21, contributing to the coin’s recent performance
On-chain analysis of ETH’s HODL Waves shows that this cohort’s share of supply has fallen to a year-to-date low of 4.8%, down from above 6% in late April and as high as 16% in mid-January.
The HODL Waves metric tracks how long coins are held across different investor groups, offering insight into market holding patterns.
The decline in ETH’s STH supply is significant because this group often controls a sizable portion of circulating tokens and is typically quick to react to market conditions.
This makes their accumulation or distribution patterns noteworthy, as they normally influence near-term price movements.
As ETH’s STHs continue to offload, it strengthens the bearish case for the asset and hints at deeper price declines.
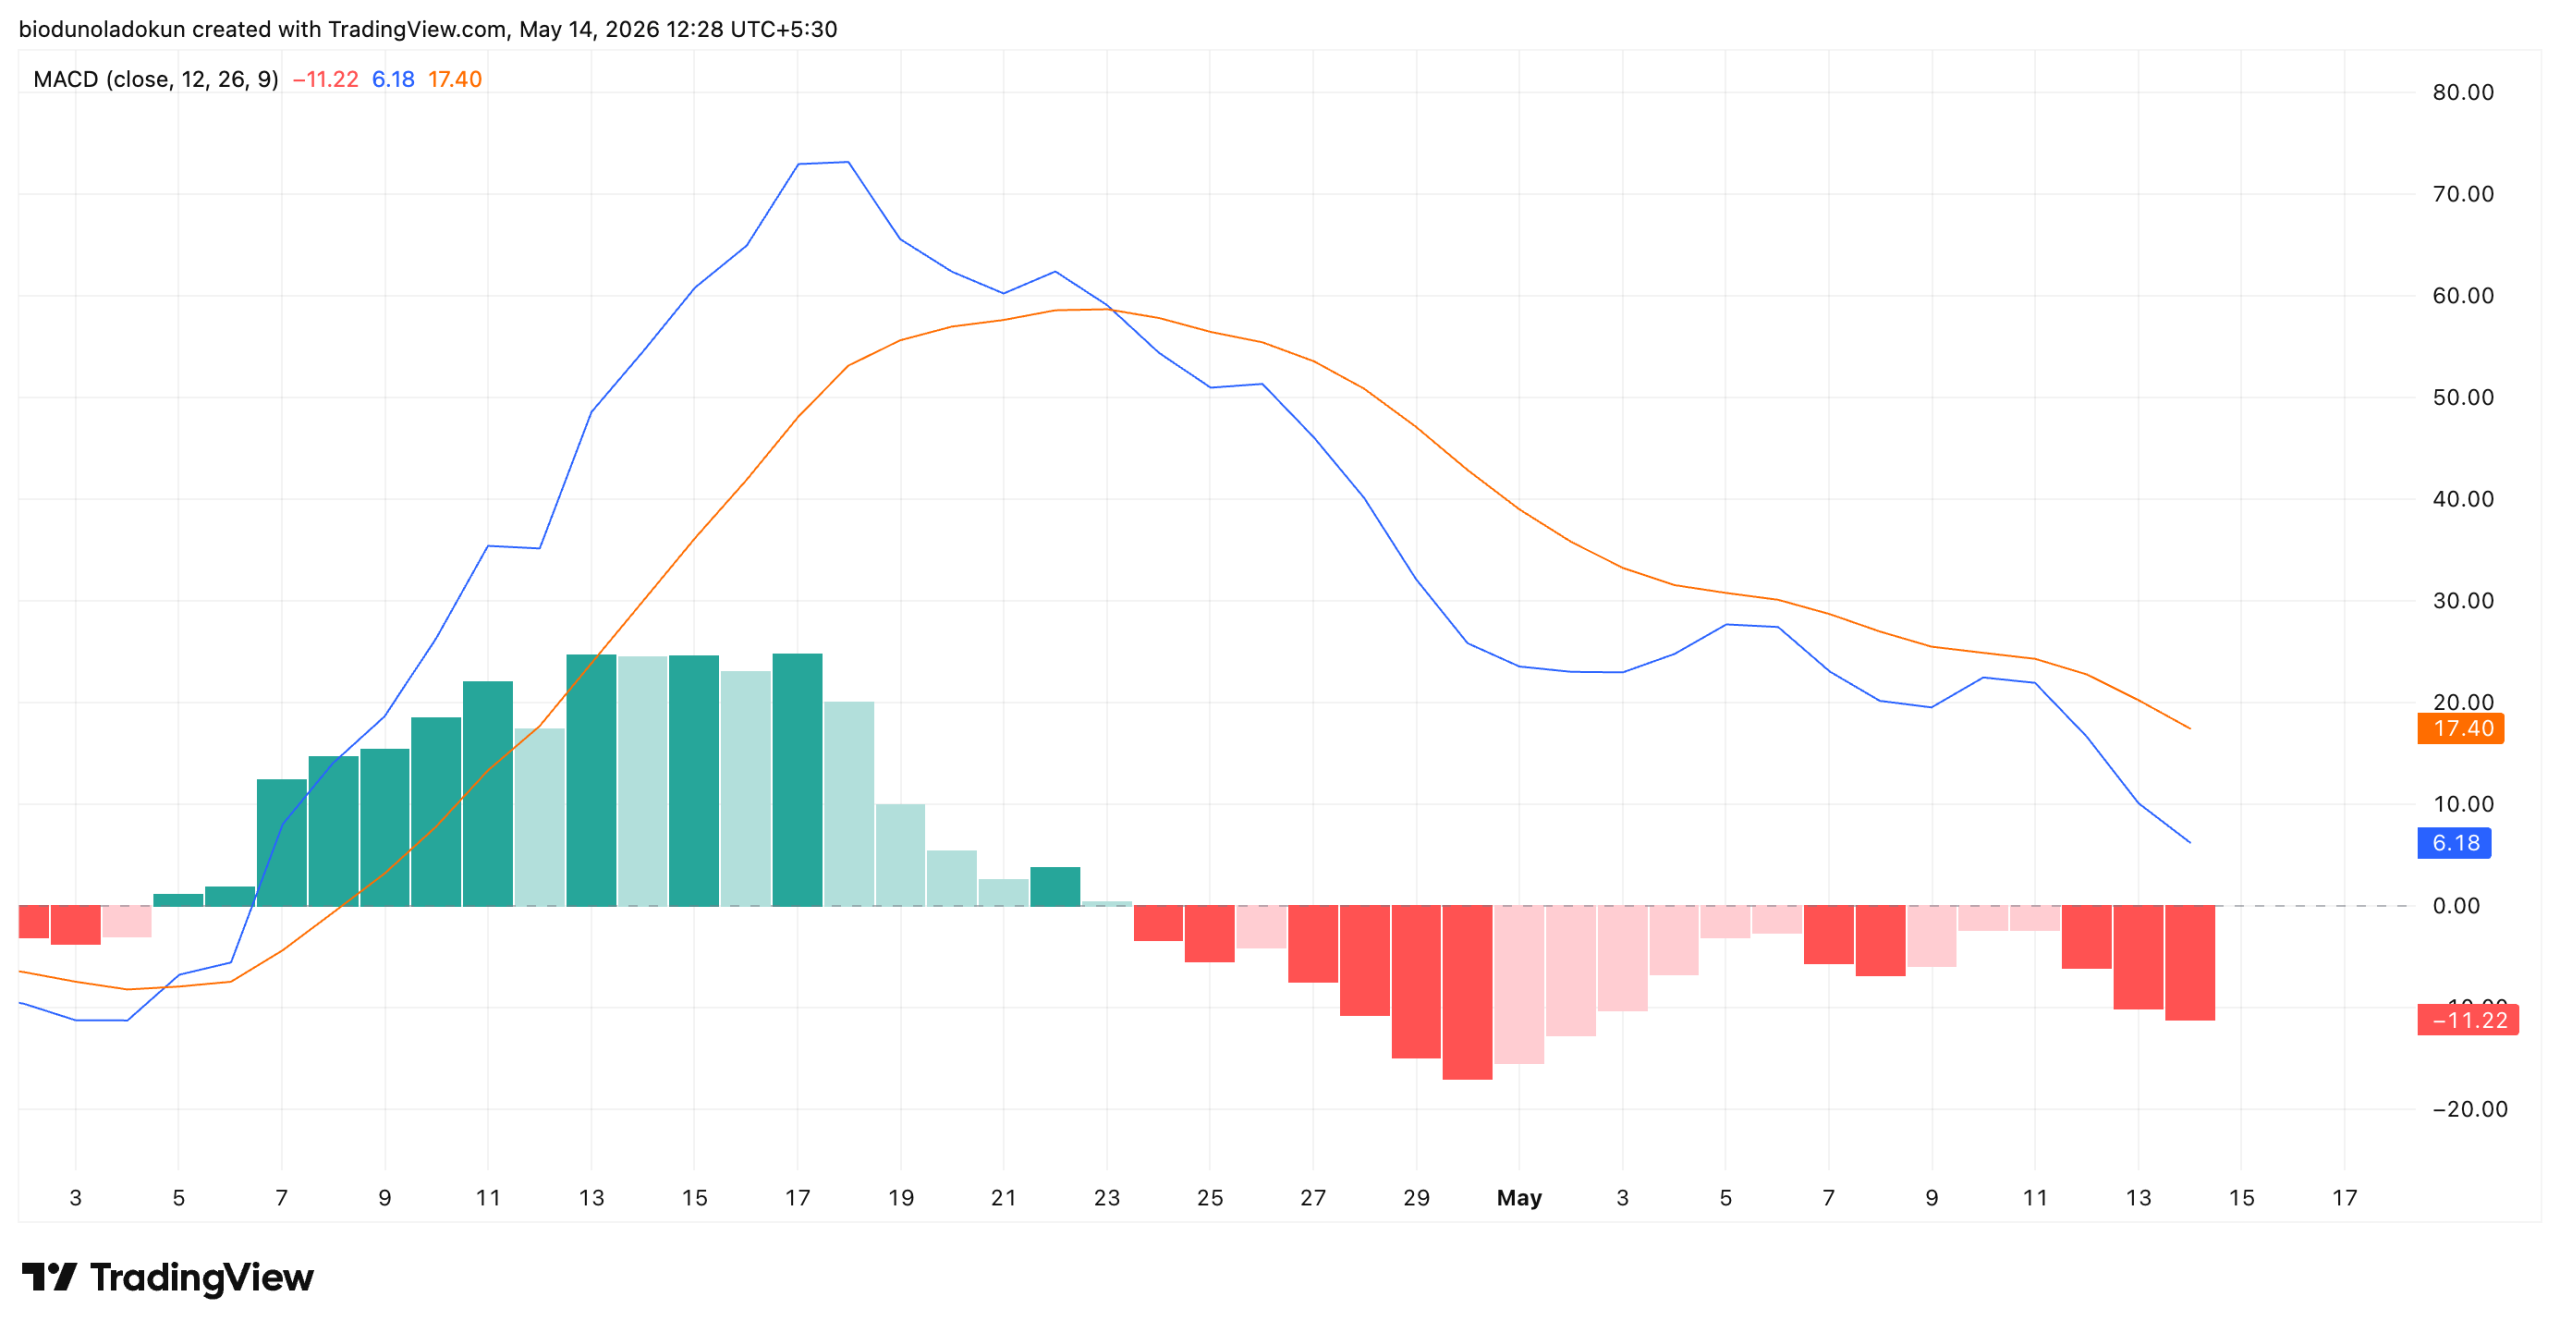
ETH Technicals Flash Red
On the daily timeframe, readings from ETH’s Moving Average Convergence Divergence (MACD) indicator add further credence to this bearish outlook.
On April 23, ETH’s MACD line (blue) broke below its signal line (orange), forming a bearish crossover. Since then, both lines have continued to slope downward in tandem, confirming that bearish momentum is actively strengthening.
The MACD indicator identifies trends and momentum in an asset’s price movement, helping traders spot potential buy or sell signals through crossovers between the MACD and signal lines.
A bearish crossover occurs when the MACD line dips below the signal line, signaling a weakening in bullish momentum and a shift toward downward price pressure.
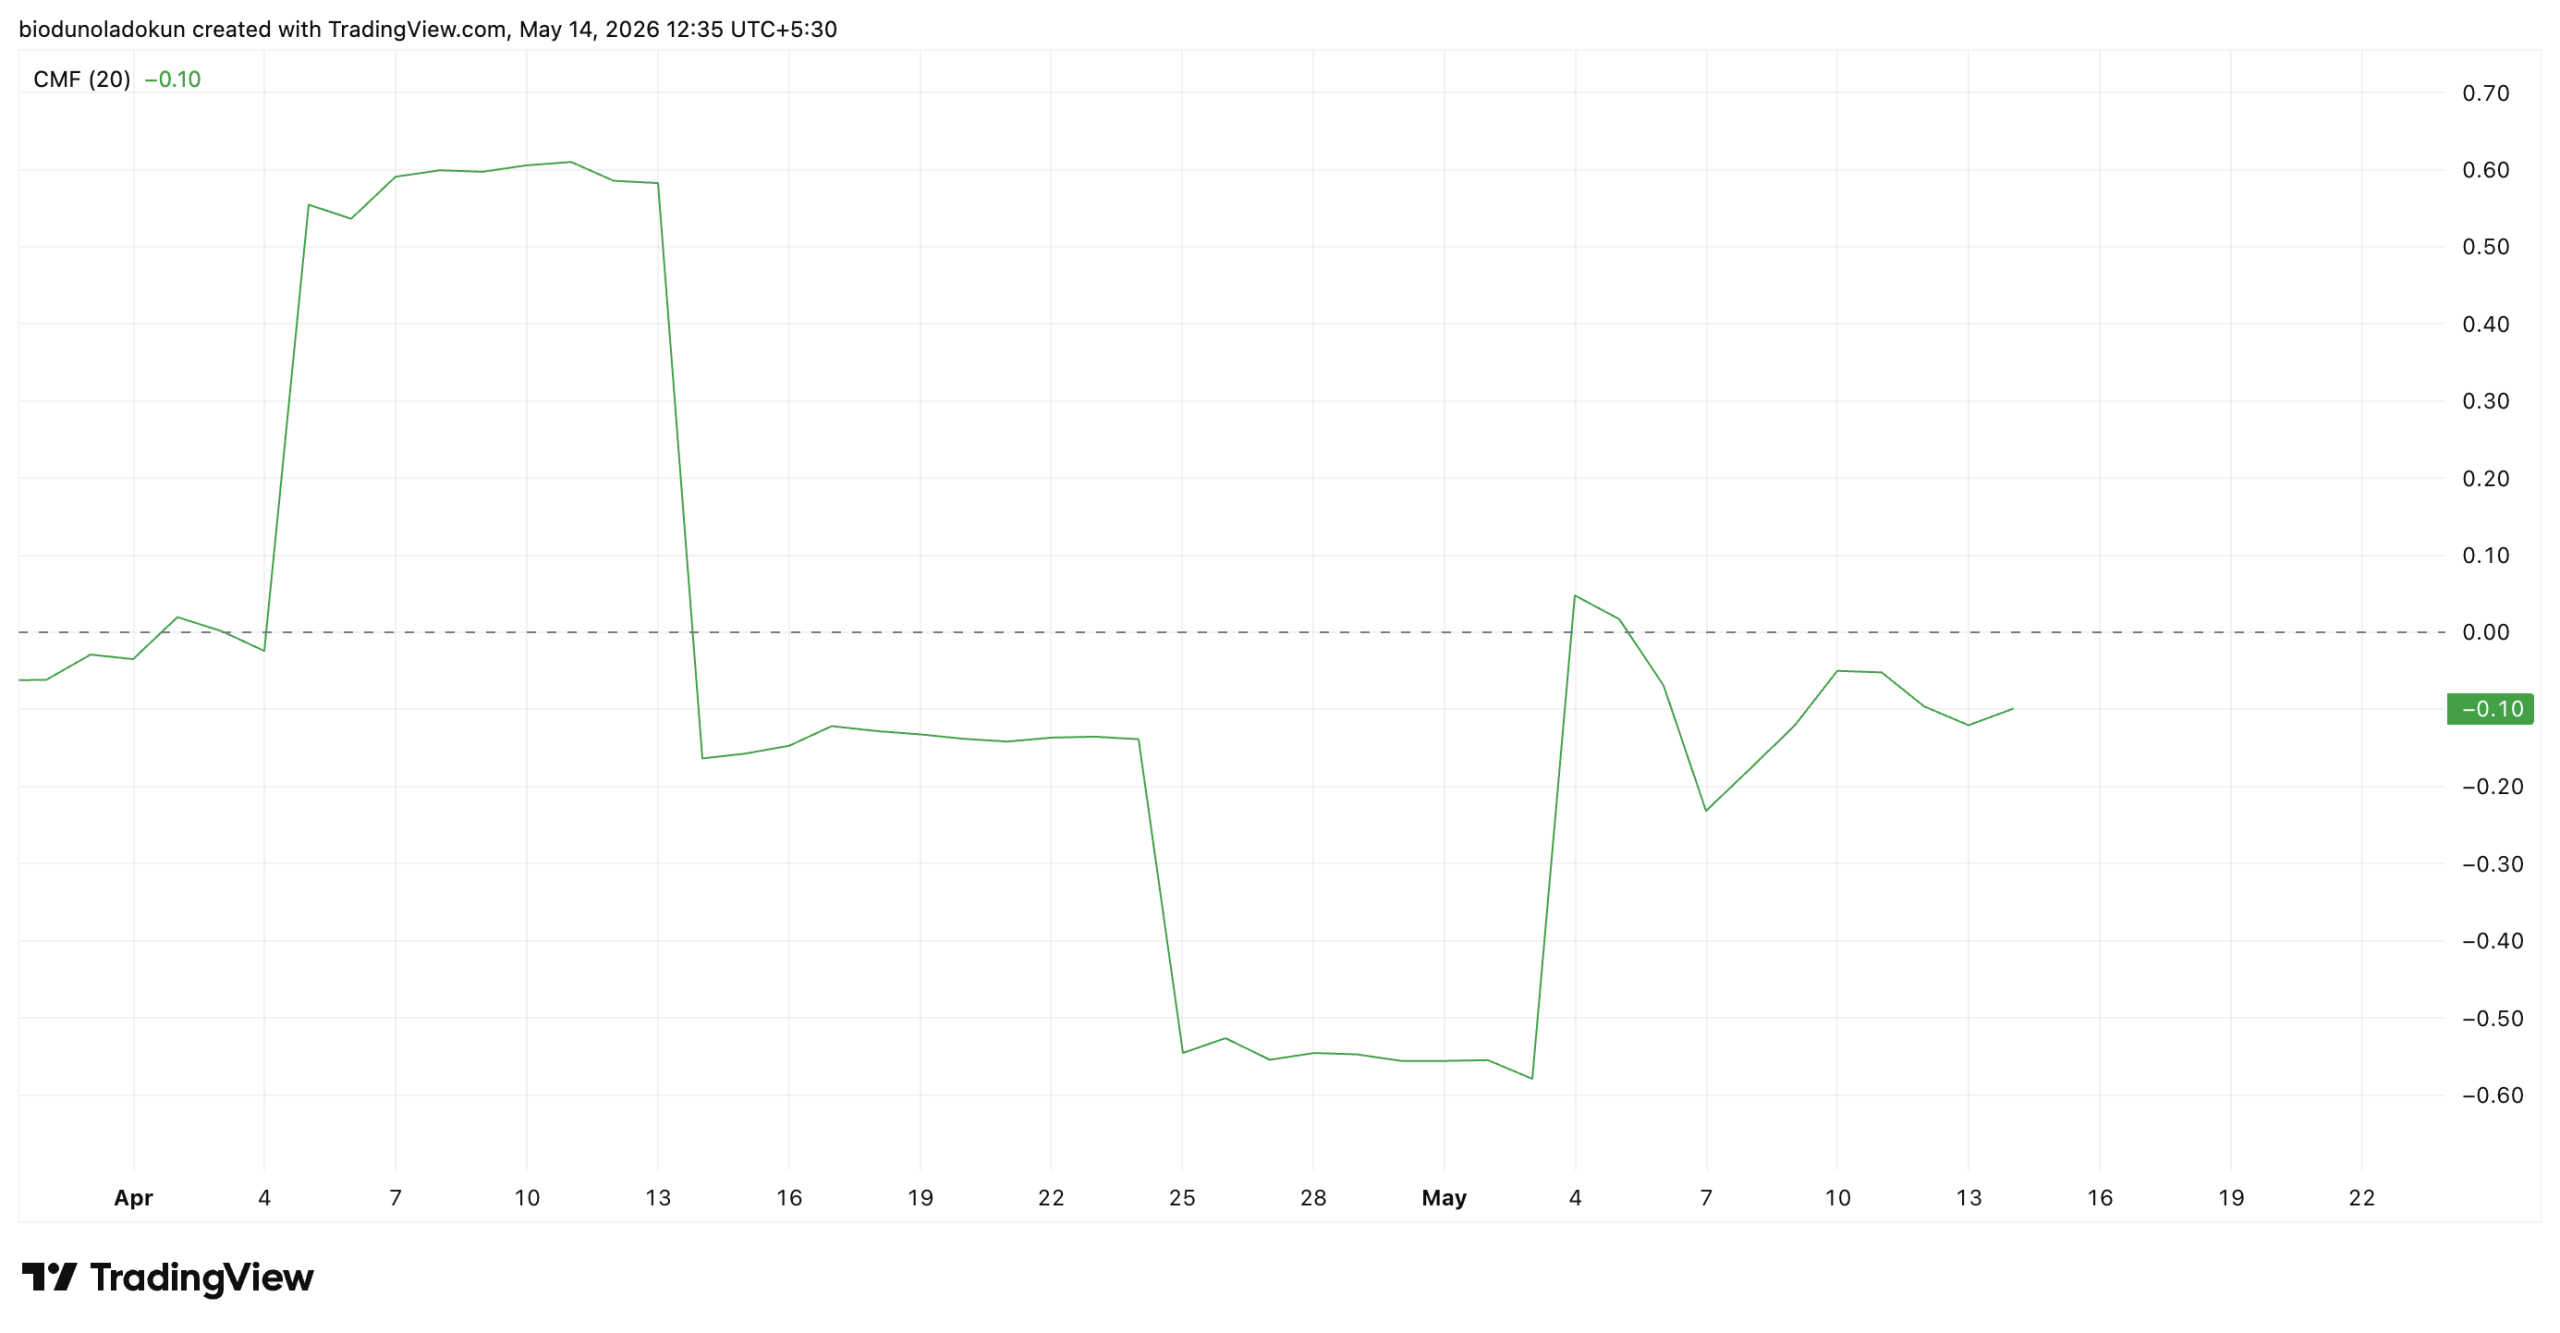
This persistent downtrend in money flow has been further compounded by ETH’s Chaikin Money Flow (CMF), which has spent most of the past month in negative territory.
At press time, this sits at -0.10. For context, after a brief stint in positive territory in early April — where readings climbed as high as 0.60 — the indicator collapsed sharply on April 13 and has remained below the zero line for most of the past month.
The brief recovery above zero in early May proved short-lived, with the indicator quickly slipping back into negative territory and now hovering just beneath the zero line.
Sustained negative CMF readings like this mean that capital has been steadily leaving ETH rather than entering it, a sign that underlying demand remains weak.
ETH Price Prediction
ETH is trading at $2,271, hovering above the critical support level at $2,234. This support floor level has absorbed significant sell-side pressure since April 13 and now serves as the final line of defense before the bears regain full control of the trend.
If buyers fail to defend the $2,234 floor, ETH could slide toward $2,044, the next major support. A decisive breakdown below that level opens the door to $1,934 and, in a deeper flush, the $1,828 zone.
However, a resurgence in new demand will invalidate this bearish thesis. A daily close above the $2,393 price ceiling would shift momentum back toward the 0.236 Fibonacci retracement at $2,480.
[You-may-like]
Disclaimer:
The information provided in this article is for informational purposes only. It is not intended to be, nor should it be construed as, financial advice. We do not make any warranties regarding the completeness, reliability, or accuracy of this information. All investments involve risk, and past performance does not guarantee future results. We recommend consulting a financial advisor before making any investment decisions.
Abiodun Oladokun is a Research Analyst at CCN, where he covers cryptocurrency markets with a focus on on-chain analysis, technical assessments, and emerging trends across decentralized finance (DeFi), real-world assets (RWA), artificial intelligence (AI), decentralized physical infrastructure networks (DePIN), Layer 2s, and meme coins.
Prior to CCN, he served as a Senior On-Chain Analyst at BeInCrypto, producing market reports spanning diverse crypto sectors.
Before that, he conducted technical analysis and market assessments of various altcoins at AMBCrypto, where he also contributed long-form quarterly research papers on DeFi, NFTs, DAOs, and scaling architectures, leveraging on-chain platforms including Messari, Santiment, DefiLlama, and Dune Analytics.
He began his crypto career as a research analyst at SixthSense DAO, developing blockchain forensic tools to trace the history of stolen assets.
Abiodun is a lawyer called to the Nigerian Bar and the founder of Ilé Ijó, a Lagos-based electronic dance music collective.