HYPE slides toward $37 as historic 21Shares ETF launch fails to spark a rally. Credit: CCN
Share
Key Takeaways
The first US spot Hyperliquid ETF, 21Shares’ THYP, launched on Nasdaq on Tuesday with $1.8 million in day-one trading volume.
However, HYPE has dropped nearly 10% over the past three sessions in defiance of typical post-ETF demand surges.
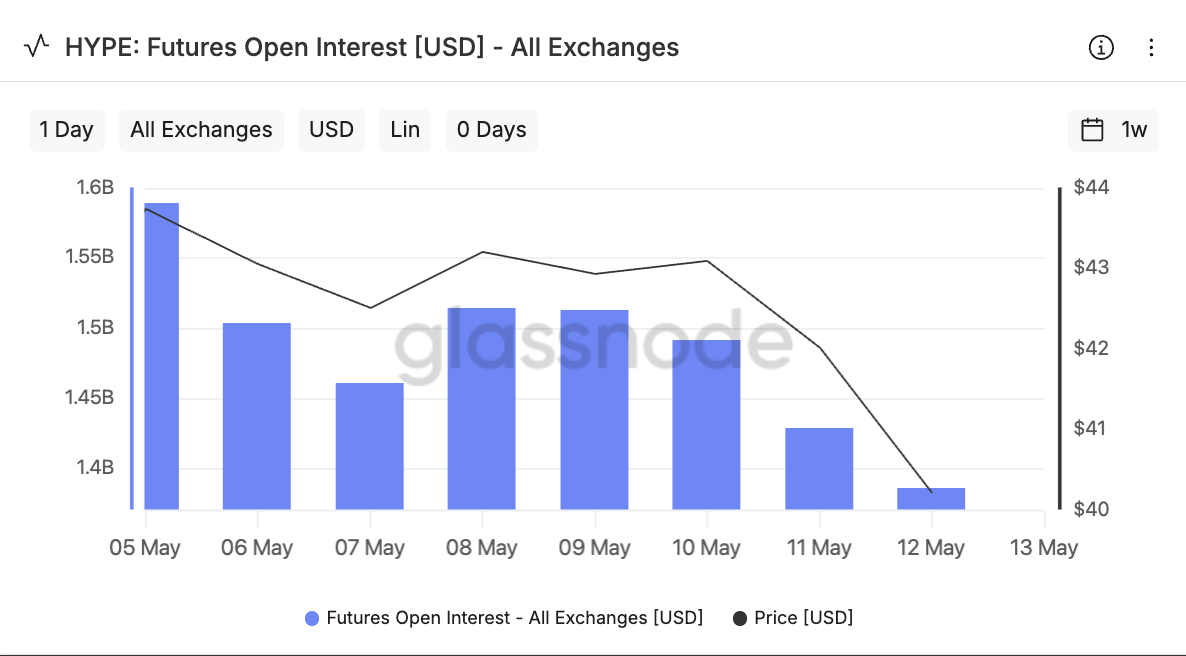
Technical indicators are flashing red across the board, futures open interest has fallen 13% in a week, and the long/short ratio remains stuck at 0.87.
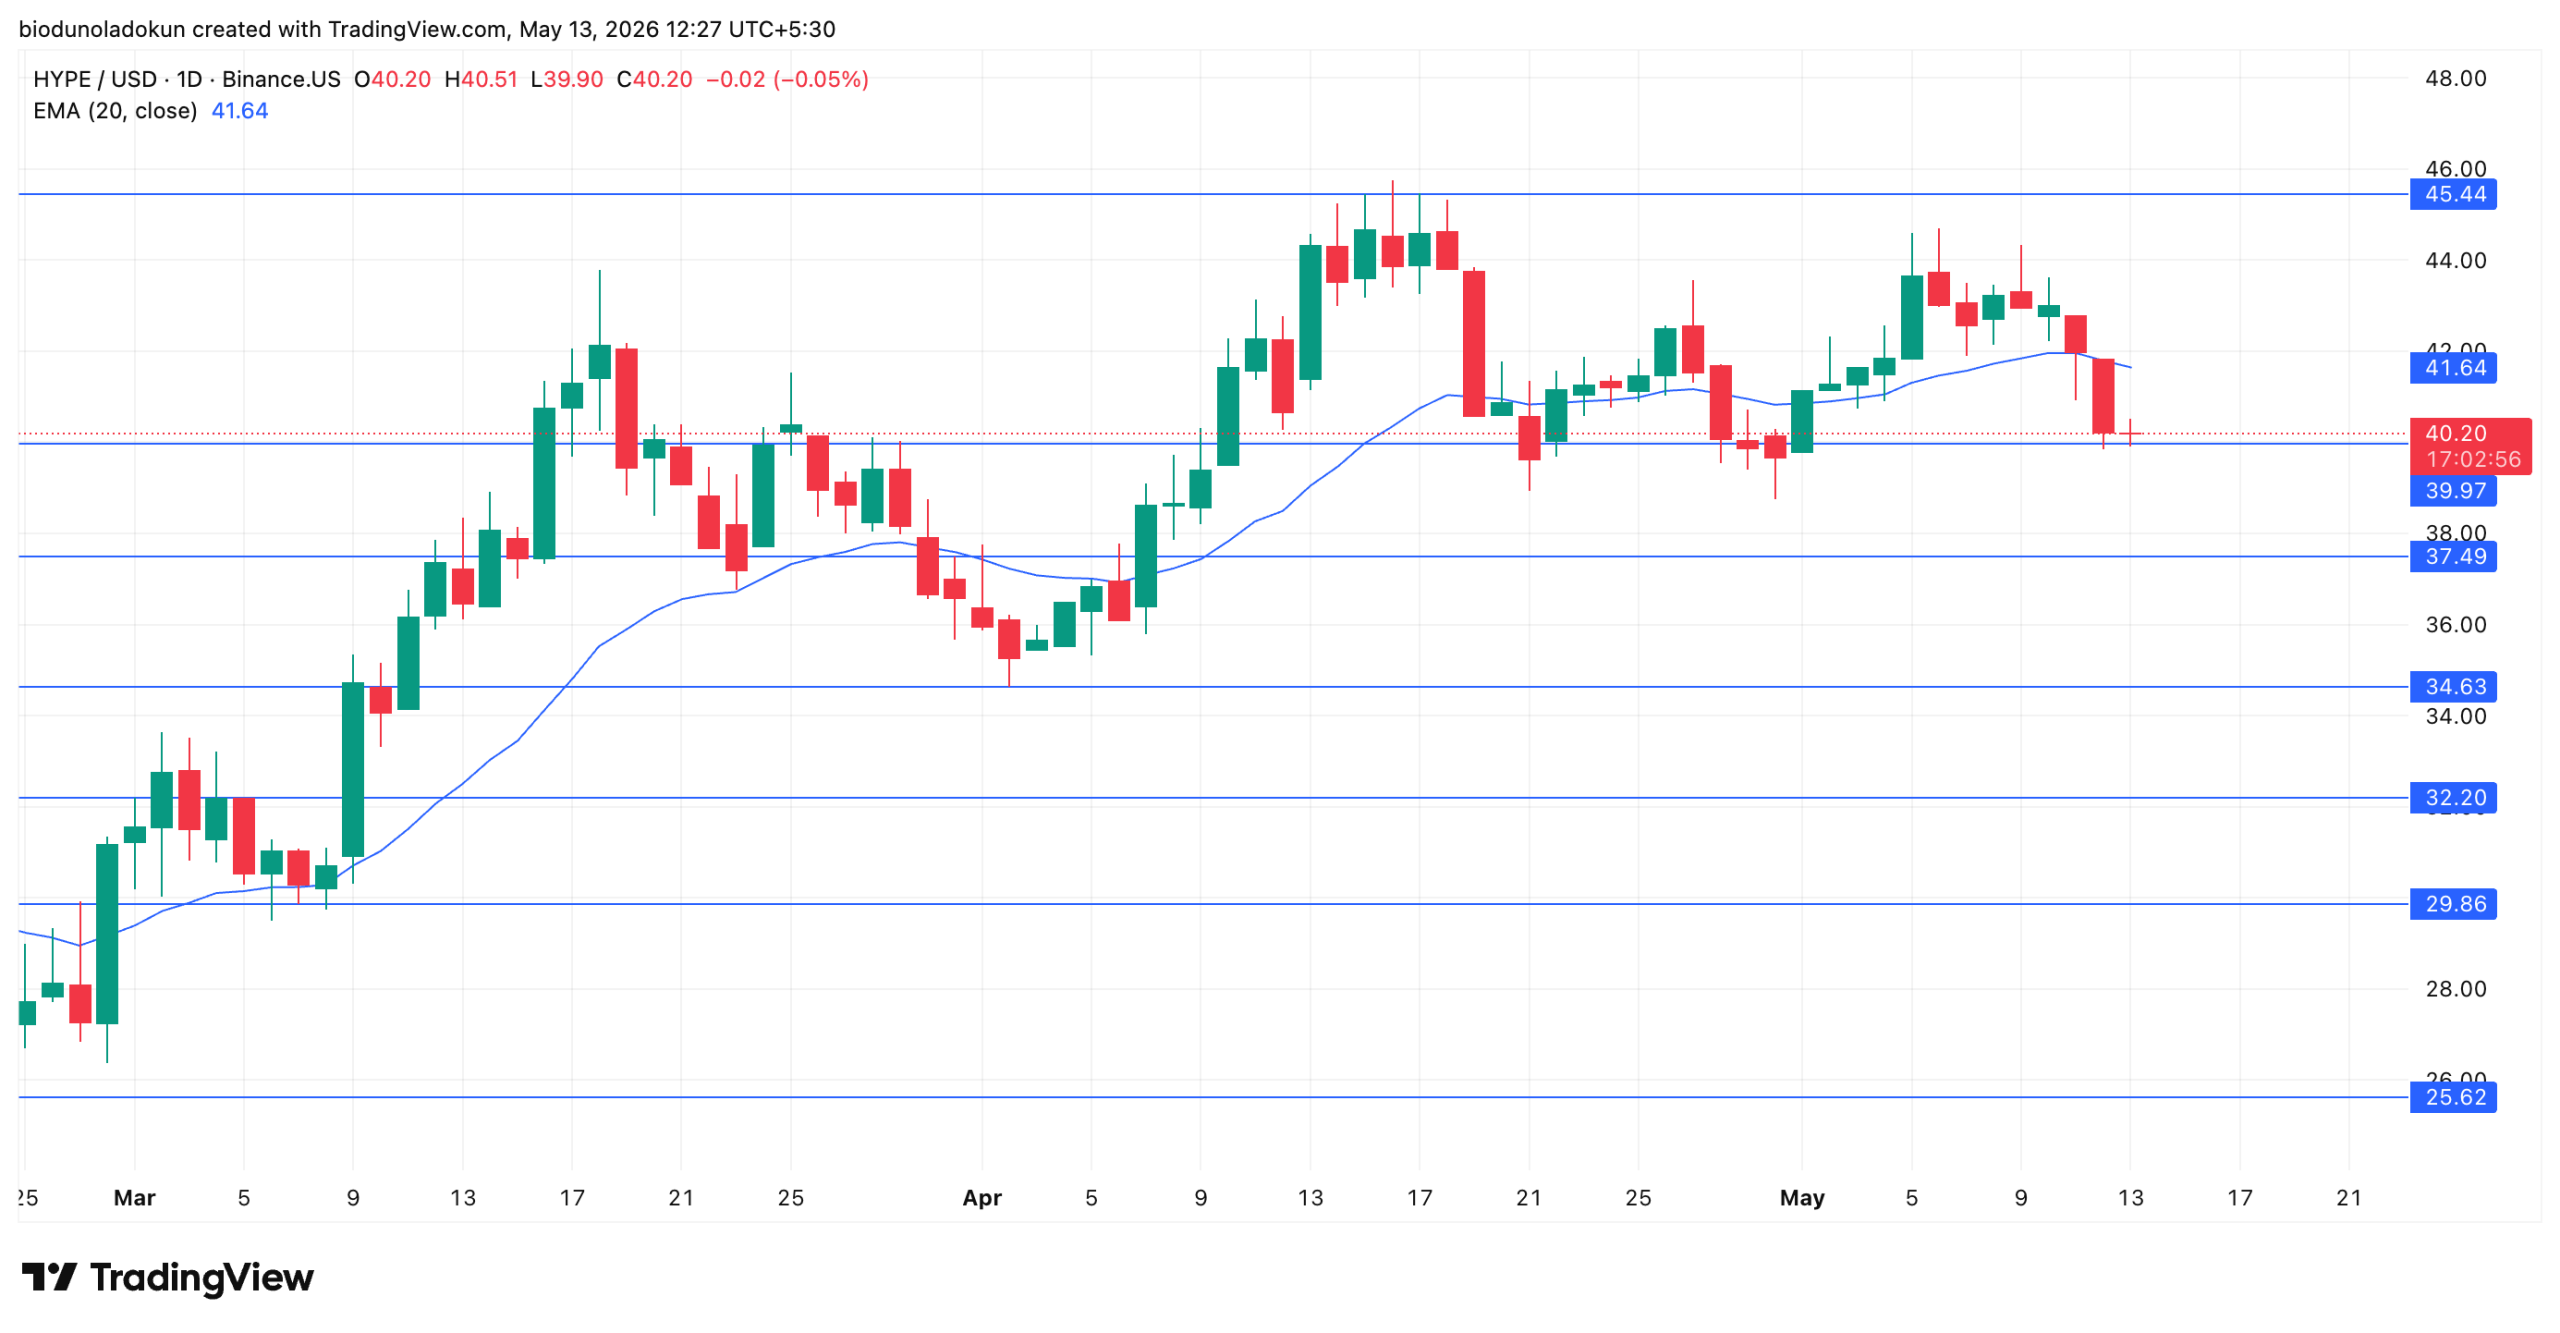
A daily close below the $39.97 support would open the door to a deeper flush toward $37.49, while bulls need a reclaim of $42.95 to invalidate the bearish setup and target $45.44.
HYPE is extending its lackluster price action even as the first US spot Hyperliquid ETF officially began trading on Tuesday.
Defying historical precedent, the debut has failed to inject fresh momentum into the underlying token.
The altcoin has dropped nearly 10% over the past three sessions, with a further 2% leg lower in the last 24 hours.
This slide completely ignores the post-launch demand surge that typically boosts the backing tokens of newly listed spot ETFs.
How else will HYPE react in the meantime?
Try Our Recommended Crypto Exchanges
Sponsored
Disclosure
We sometimes use affiliate links in our content, when clicking on those we might receive a commission at no extra cost to you. By using this website you agree to our terms and conditions and privacy policy.
In a Tuesday post on X, Bloomberg ETF analyst James Seyffart noted that the ETF logged $1.8 million in trading volume on its first day.
The analyst described this as “very, very solid” and stronger than an average ETF launch. But added that it was “nothing too crazy.”
The ETF, created by Swiss-based crypto asset manager 21Shares, went live under the ticker THYP on the Nasdaq after receiving approval from the Securities and Exchange Commission.
The product gives US brokerage clients regulated spot exposure to HYPE, the native token of the Hyperliquid perpetuals trading network.
While 21Shares has claimed first-mover status, attention is now turning to rival issuers expected to bring their own HYPE ETFs to market soon.
Bitwise and Grayscale have both made fresh amendments to their filings, fueling expectations of more approvals down the line.
HYPE Price Breaks the ETF Playbook
Historically, spot ETF launches have served as powerful upside catalysts for their underlying assets, propelling backing tokens to fresh local highs in the sessions following debut.
HYPE, however, is not following that script.
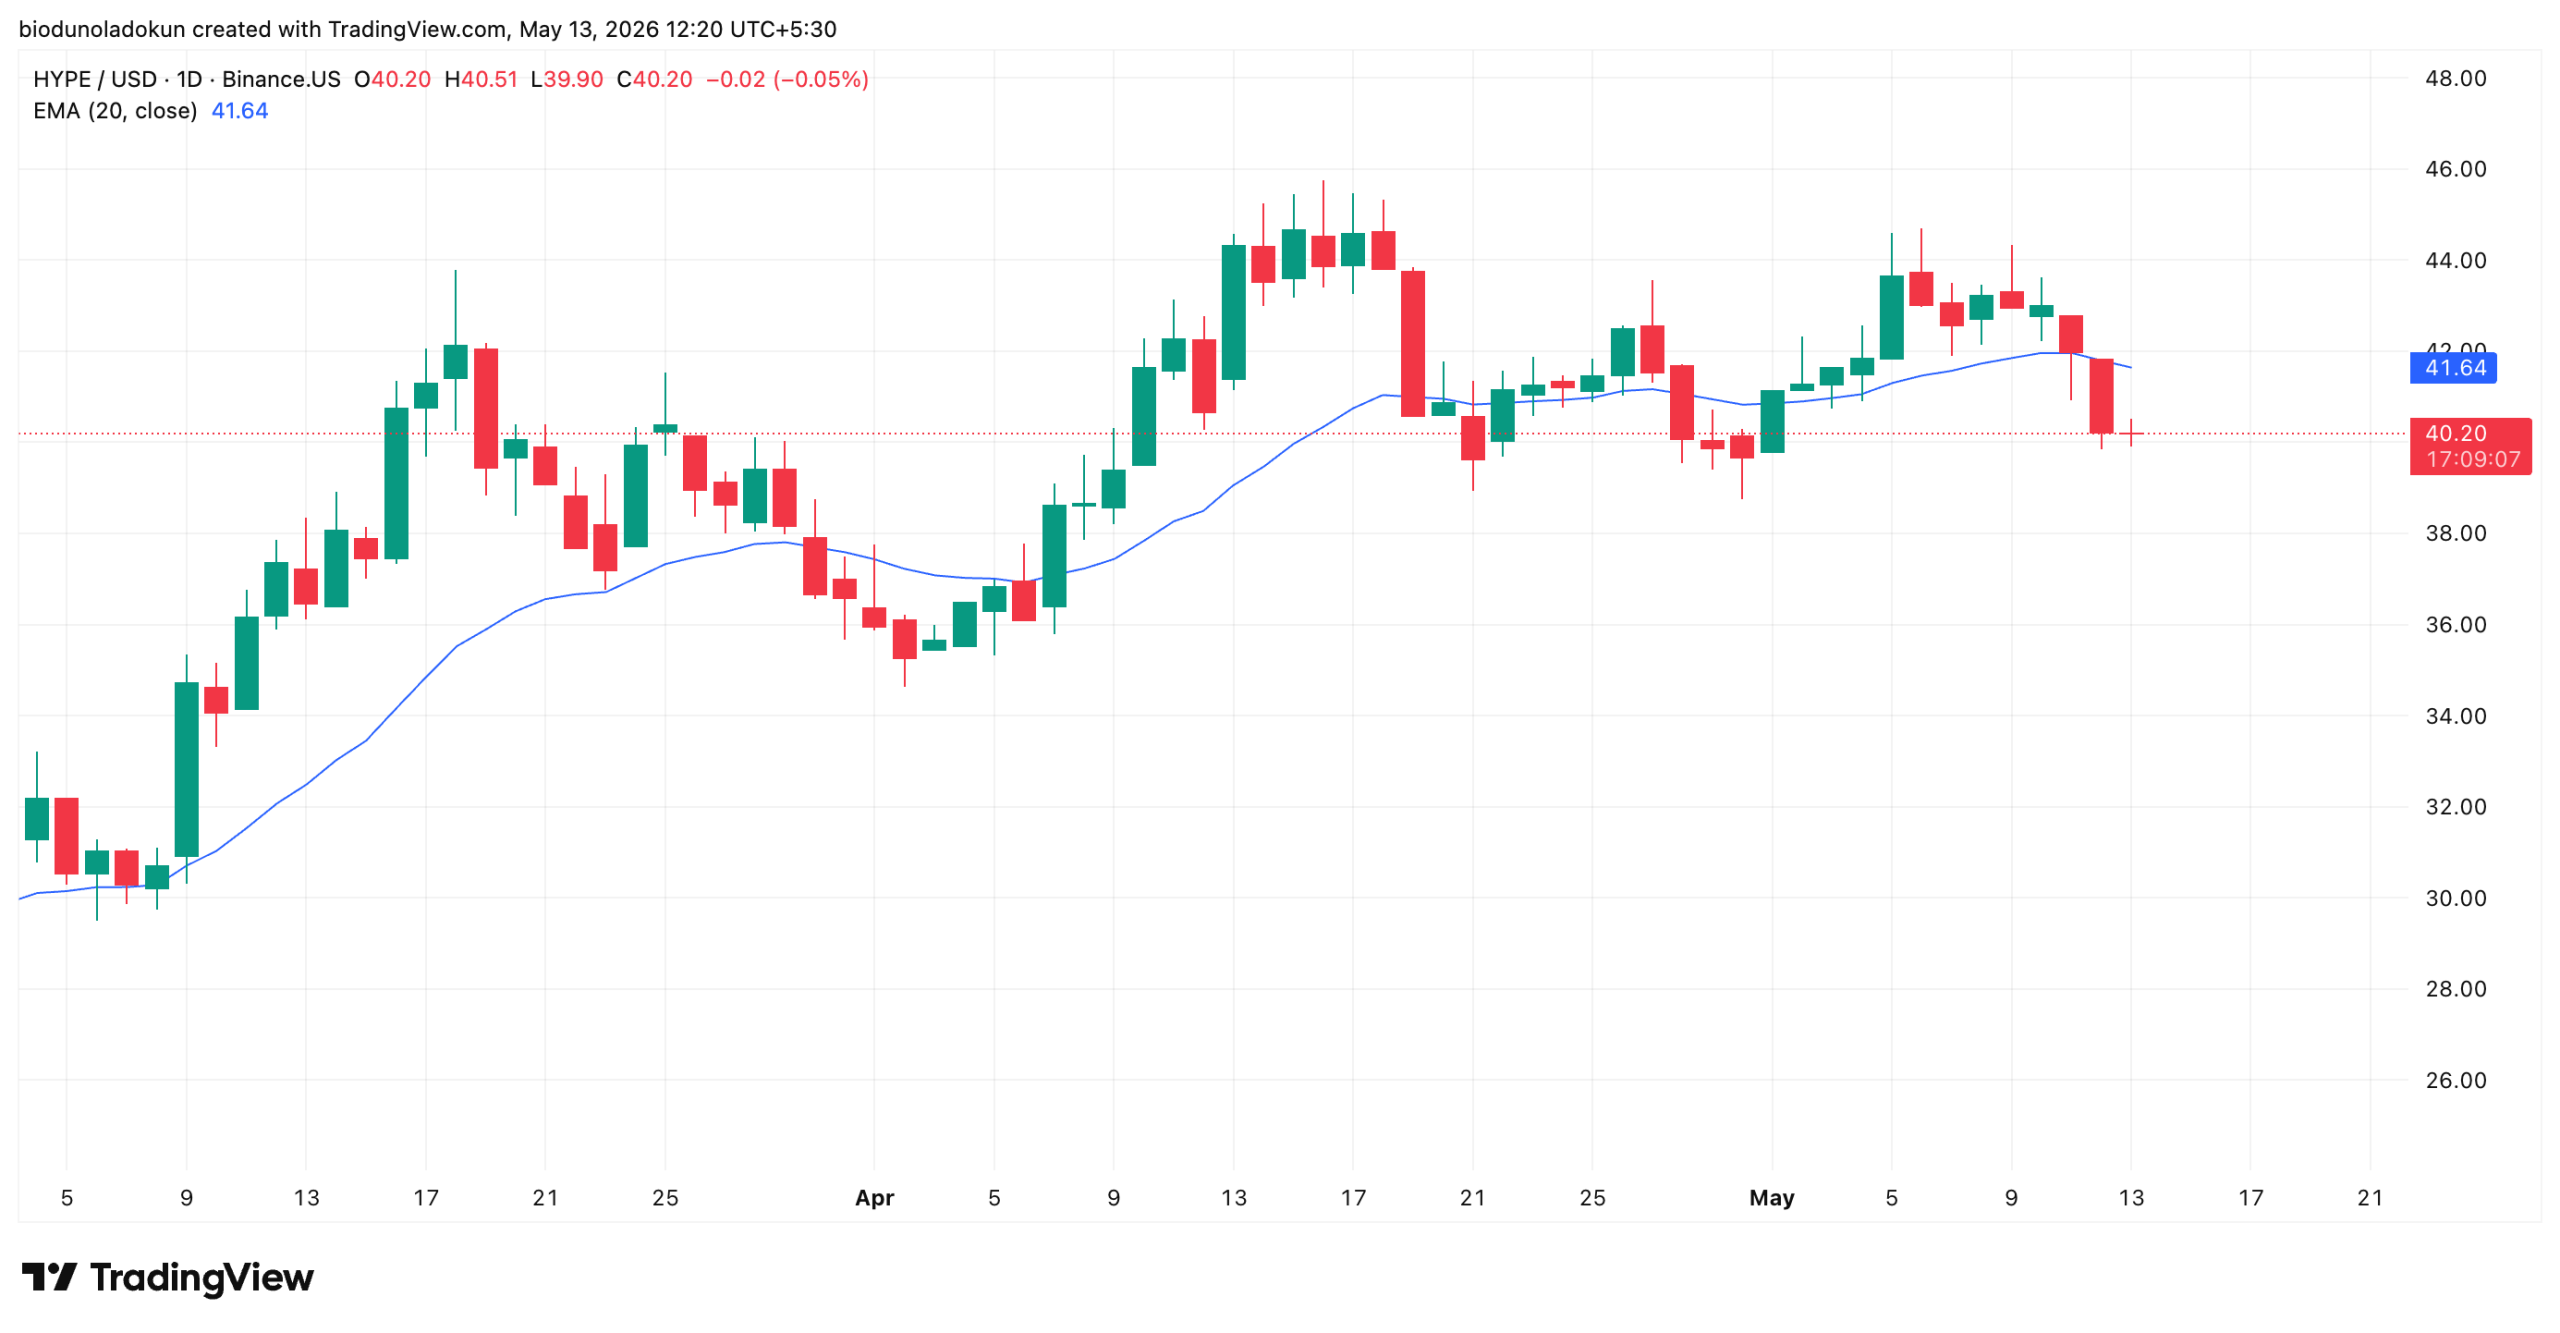
Readings from the HYPE/USD one-day chart show that the token has been pinned below resistance at the $43 region since mid-March.
Maintaining a downward trend over the past three sessions, HYPE currently trades below its 20-day Exponential Moving Average, which now forms a supply overhang above it at $41.64.
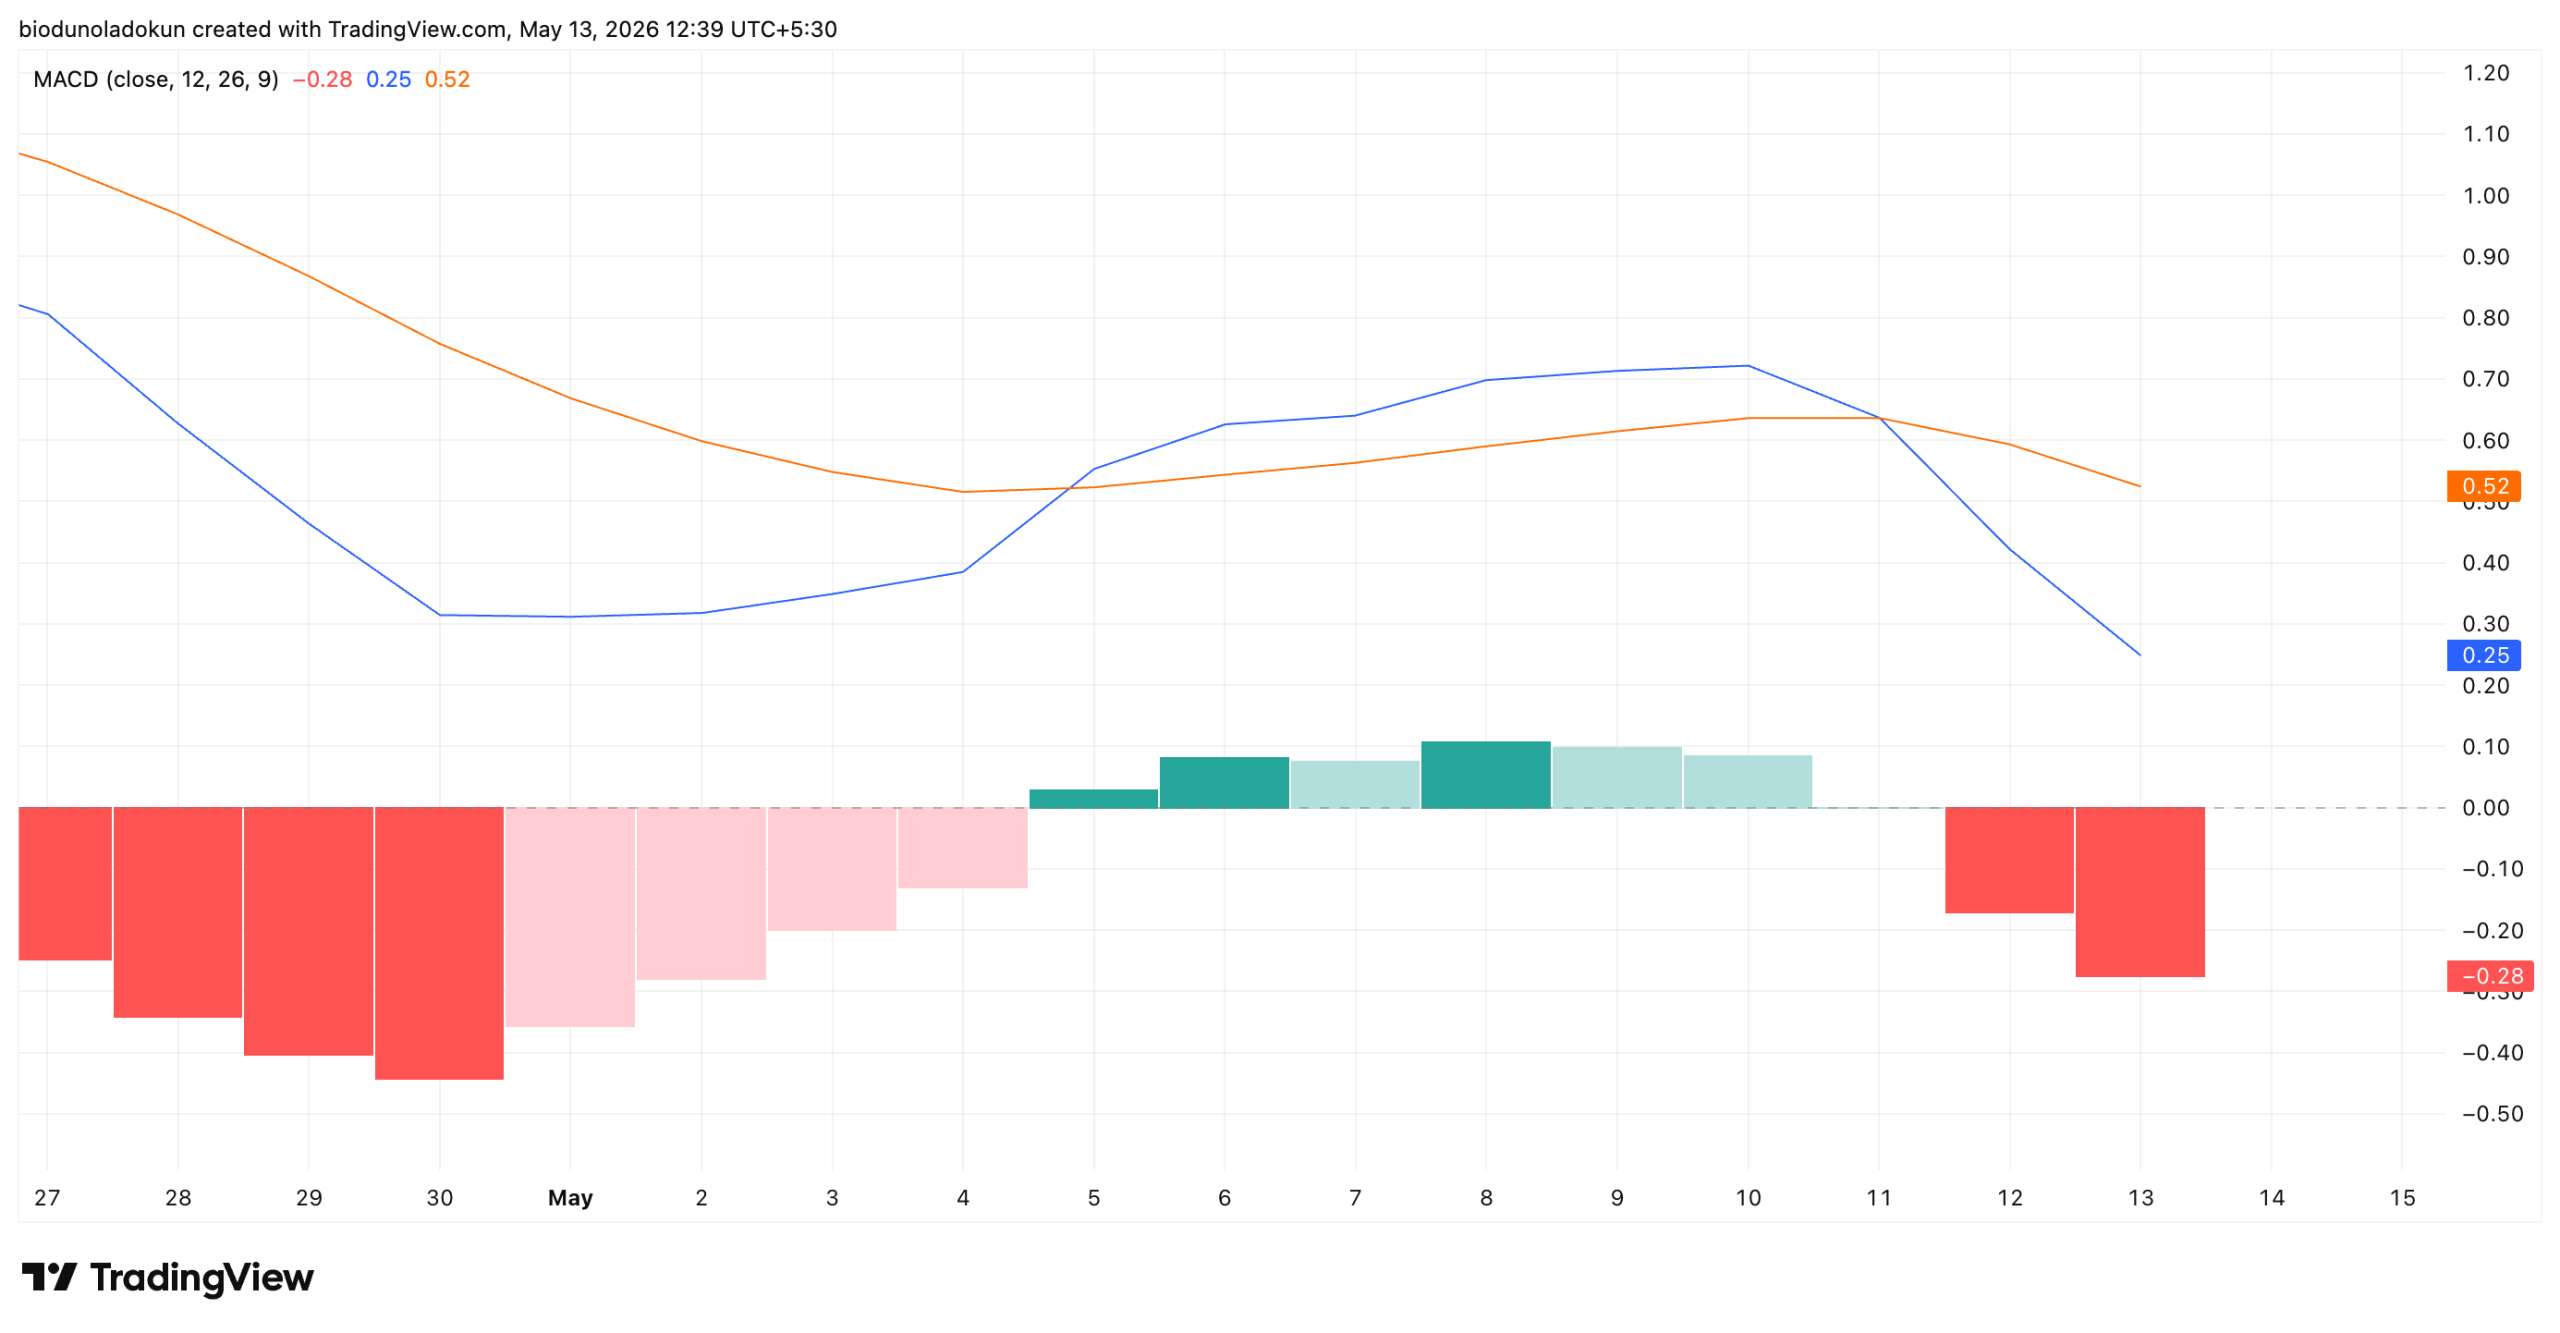
On the daily chart, the MACD line (blue) fell below the signal line (orange) on Tuesday, confirming that HYPE sellers are displacing buyers in its spot markets.
Additionally, the red histogram bars, which reflect the strength of that momentum, have gradually increased in size over the past few days, highlighting the deterioration in buy-side pressure.
When an asset’s MACD is set up this way, downward momentum is strong, and sellers are gaining control.
This heightens the risk of a deeper flush toward sub-$40 levels for HYPE’s price.
When an asset’s open interest falls during a period of lackluster price performance, it indicates that capital is flowing out of the derivatives market, as leveraged traders close positions rather than add fresh exposure.
This reflects the falling confidence in HYPE’s near-term recovery.
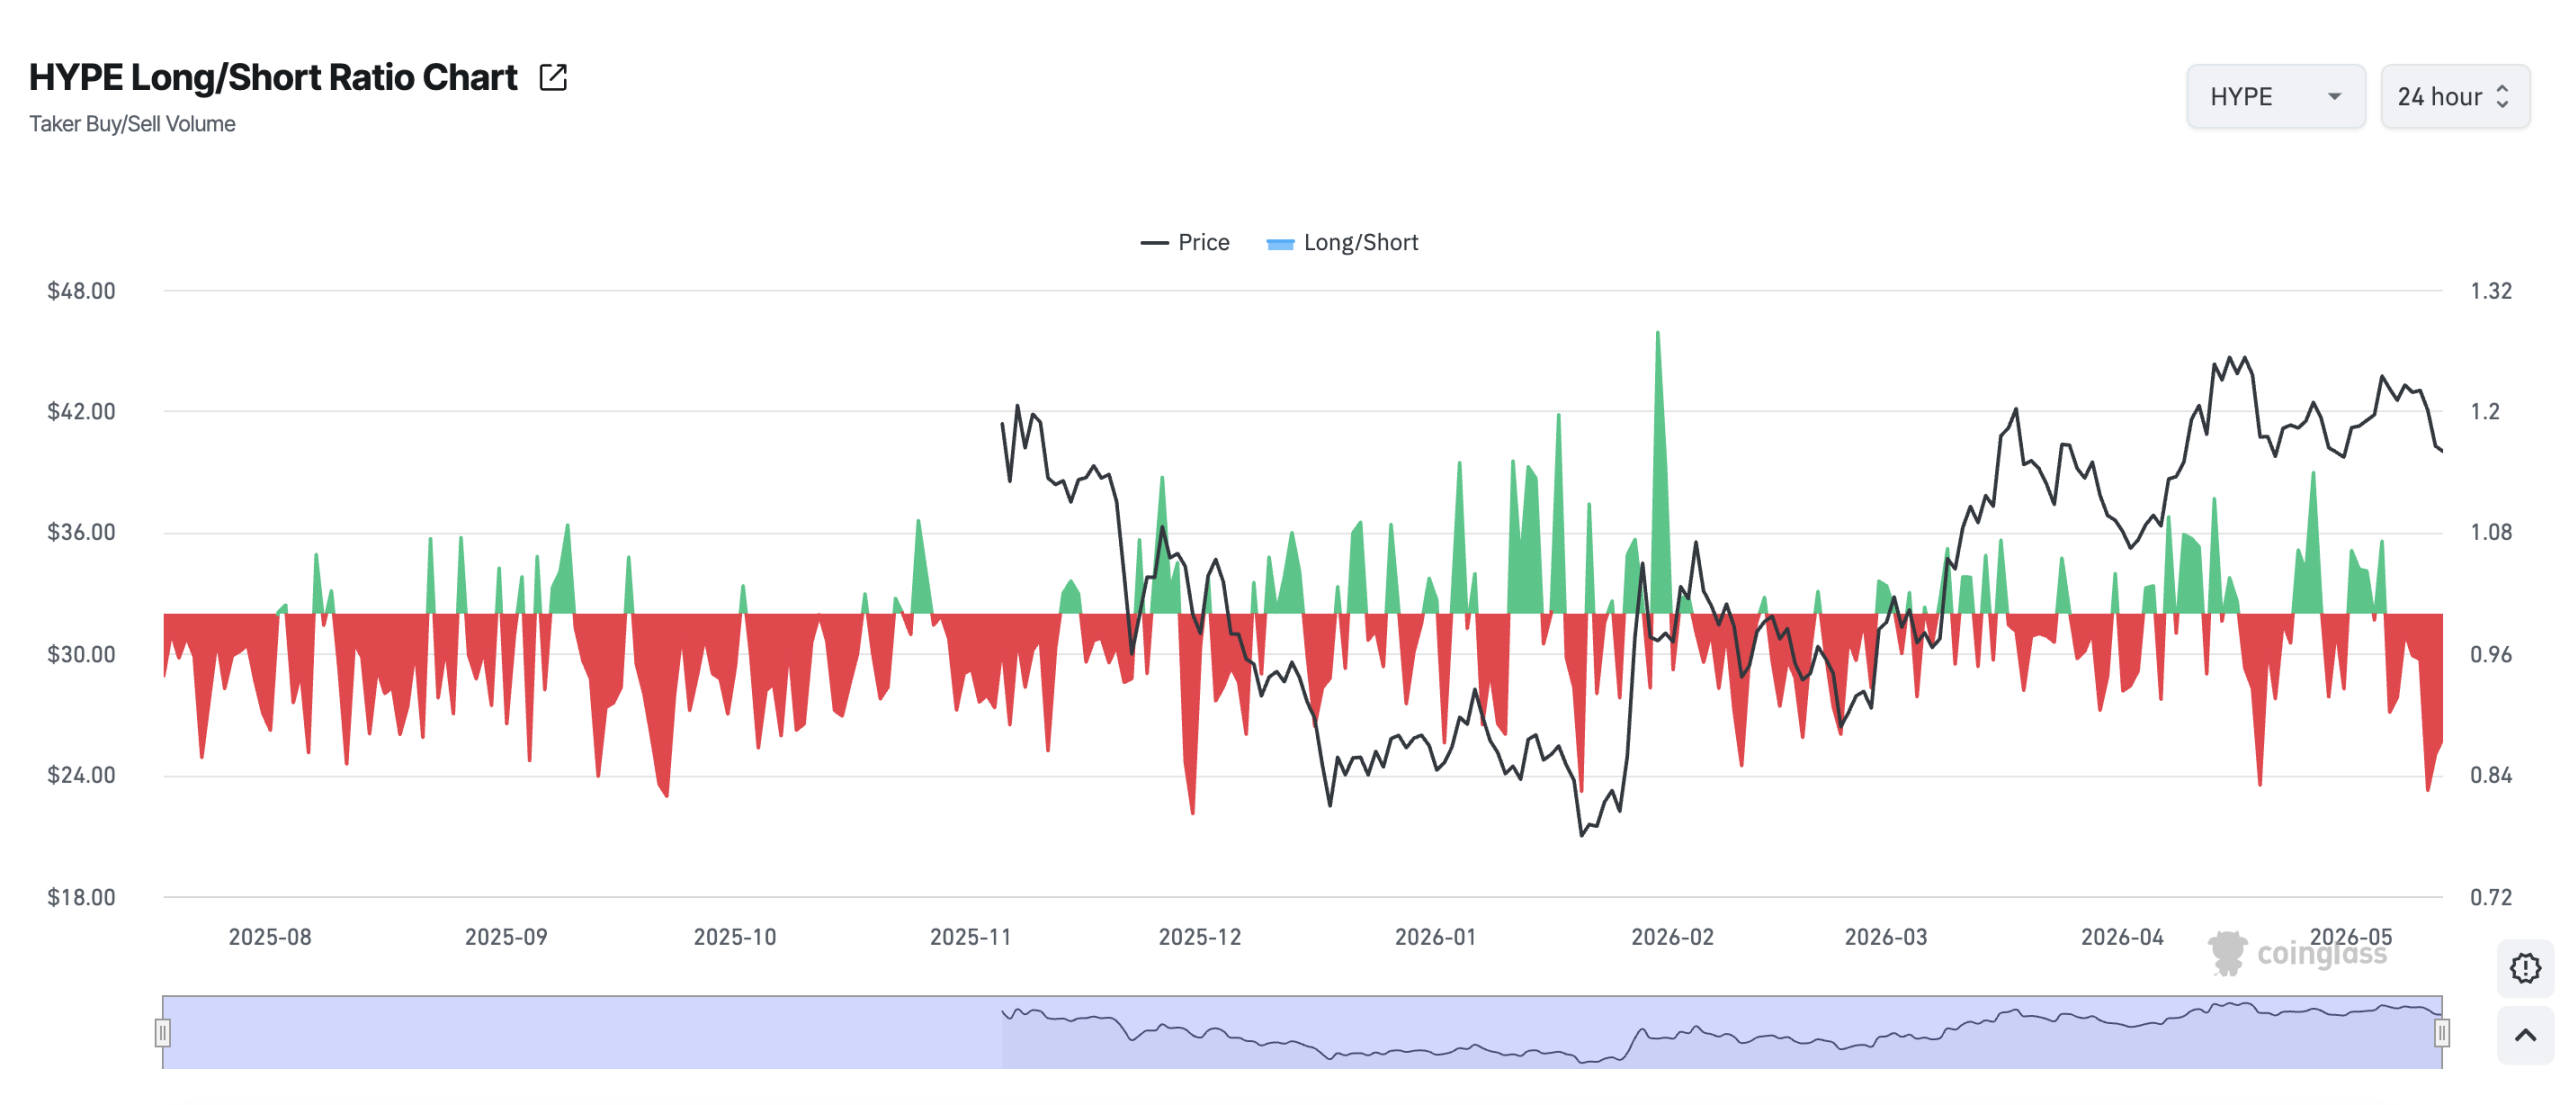
Moreover, HYPE’s long/short ratio is currently tilted toward the short side, further reinforcing this bearish outlook.
At press time, the metric sits at 0.87, having held below the neutral 1.0 threshold since May 6.
The long/short ratio measures the proportion of long positions versus short positions in the futures market.
A reading above 1 means more traders are positioned long, while a reading below 1 means short positions outweigh longs.
Read alongside HYPE’s falling open interest and weak price action, this signals one thing — sentiment has shifted decisively bearish, and the market is pricing in further losses rather than an ETF-fueled bounce.
HYPE Price Prediction
HYPE currently trades near the $39.97 support, which has served as a local floor since early April.
A daily close below $39.97 would strengthen the bearish control over the market and open the door to a deeper flush toward $37.49,
For bulls to reclaim control, HYPE needs a decisive daily close back above the 20-day EMA at $41.64.
Disclaimer:
The information provided in this article is for informational purposes only. It is not intended to be, nor should it be construed as, financial advice. We do not make any warranties regarding the completeness, reliability, or accuracy of this information. All investments involve risk, and past performance does not guarantee future results. We recommend consulting a financial advisor before making any investment decisions.
Abiodun Oladokun is a Research Analyst at CCN, where he covers cryptocurrency markets with a focus on on-chain analysis, technical assessments, and emerging trends across decentralized finance (DeFi), real-world assets (RWA), artificial intelligence (AI), decentralized physical infrastructure networks (DePIN), Layer 2s, and meme coins.
Prior to CCN, he served as a Senior On-Chain Analyst at BeInCrypto, producing market reports spanning diverse crypto sectors.
Before that, he conducted technical analysis and market assessments of various altcoins at AMBCrypto, where he also contributed long-form quarterly research papers on DeFi, NFTs, DAOs, and scaling architectures, leveraging on-chain platforms including Messari, Santiment, DefiLlama, and Dune Analytics.
He began his crypto career as a research analyst at SixthSense DAO, developing blockchain forensic tools to trace the history of stolen assets.
Abiodun is a lawyer called to the Nigerian Bar and the founder of Ilé Ijó, a Lagos-based electronic dance music collective.













 Hyperliquid (HYPE) Fails $45 Again as Bears Take Over— Why $40 May Not Hold Either