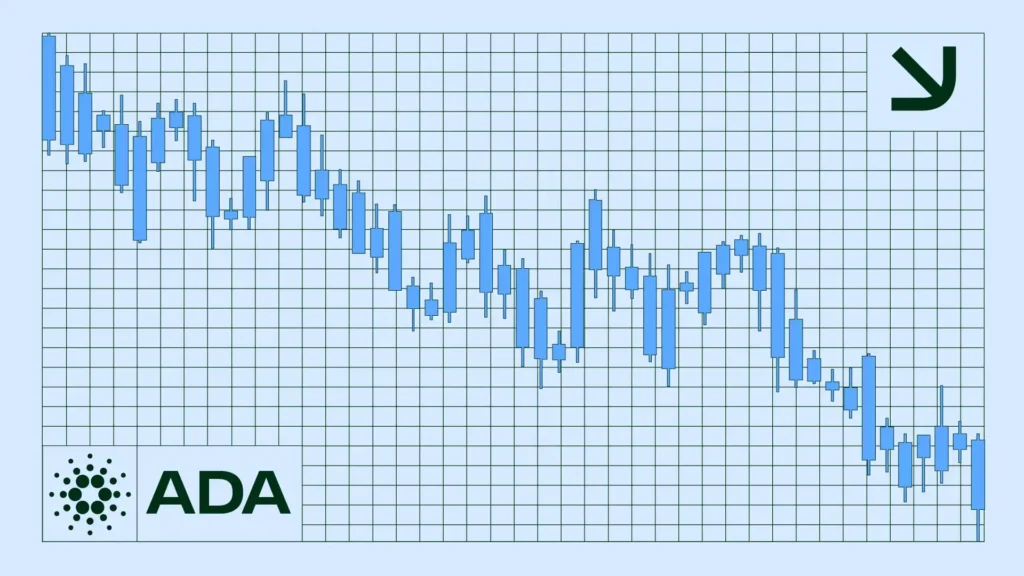
Cardano struggles to break the $0.30 barrier | Credit: Hameem Sarwar
Share
Key Takeaways
Cardano’s price has fallen 3% in the past 24 hours while trading volume jumped 27%,
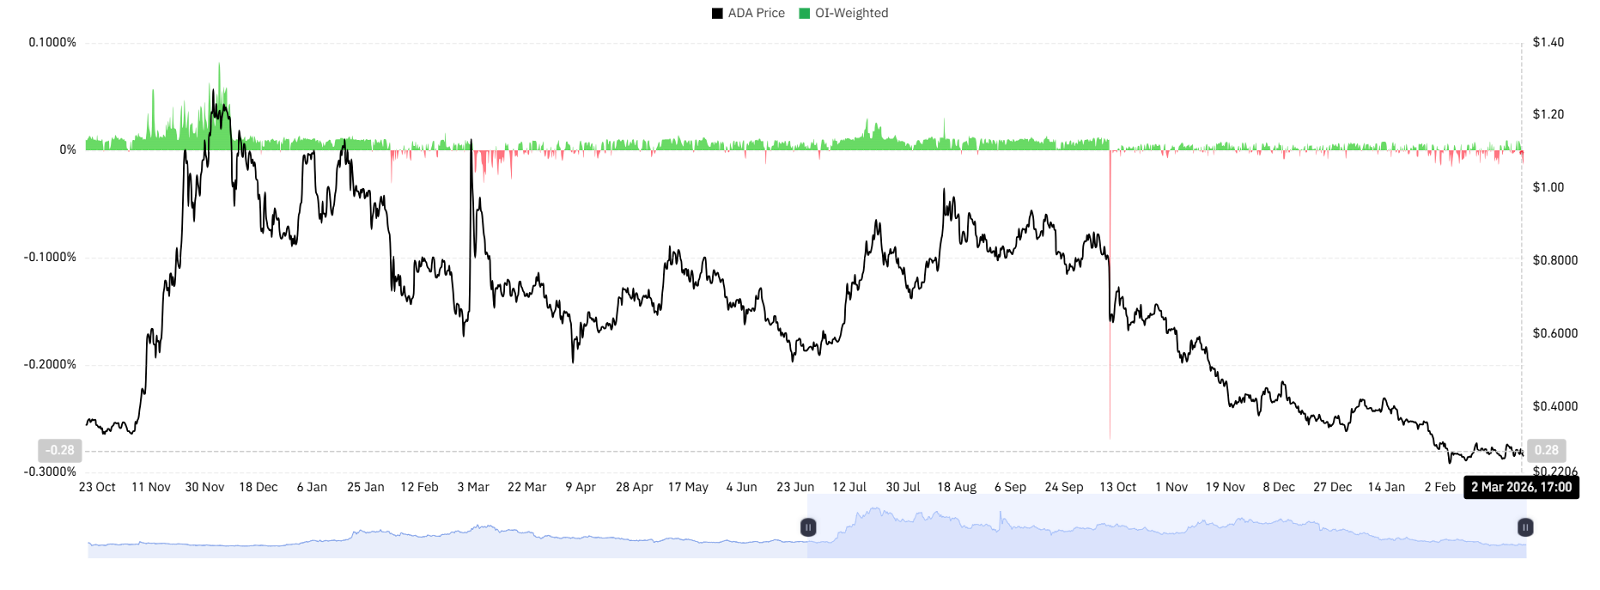
Open interest has declined 3%, signaling that fewer traders are opening new positions
Unless ADA reclaims $0.30 and breaks above channel resistance, rallies are likely corrective.
Cardano (ADA) has extended its pullback, sliding 3% over the past 24 hours to trade near $0.26.
At the same time, daily trading volume has surged by 27%. That sharp rise in activity, combined with falling prices, suggests increased bearish participation.
In other words, sellers are becoming more aggressive as momentum weakens, driving the asset below the psychological $0.35 levels.
ADA Faces Range Resistance
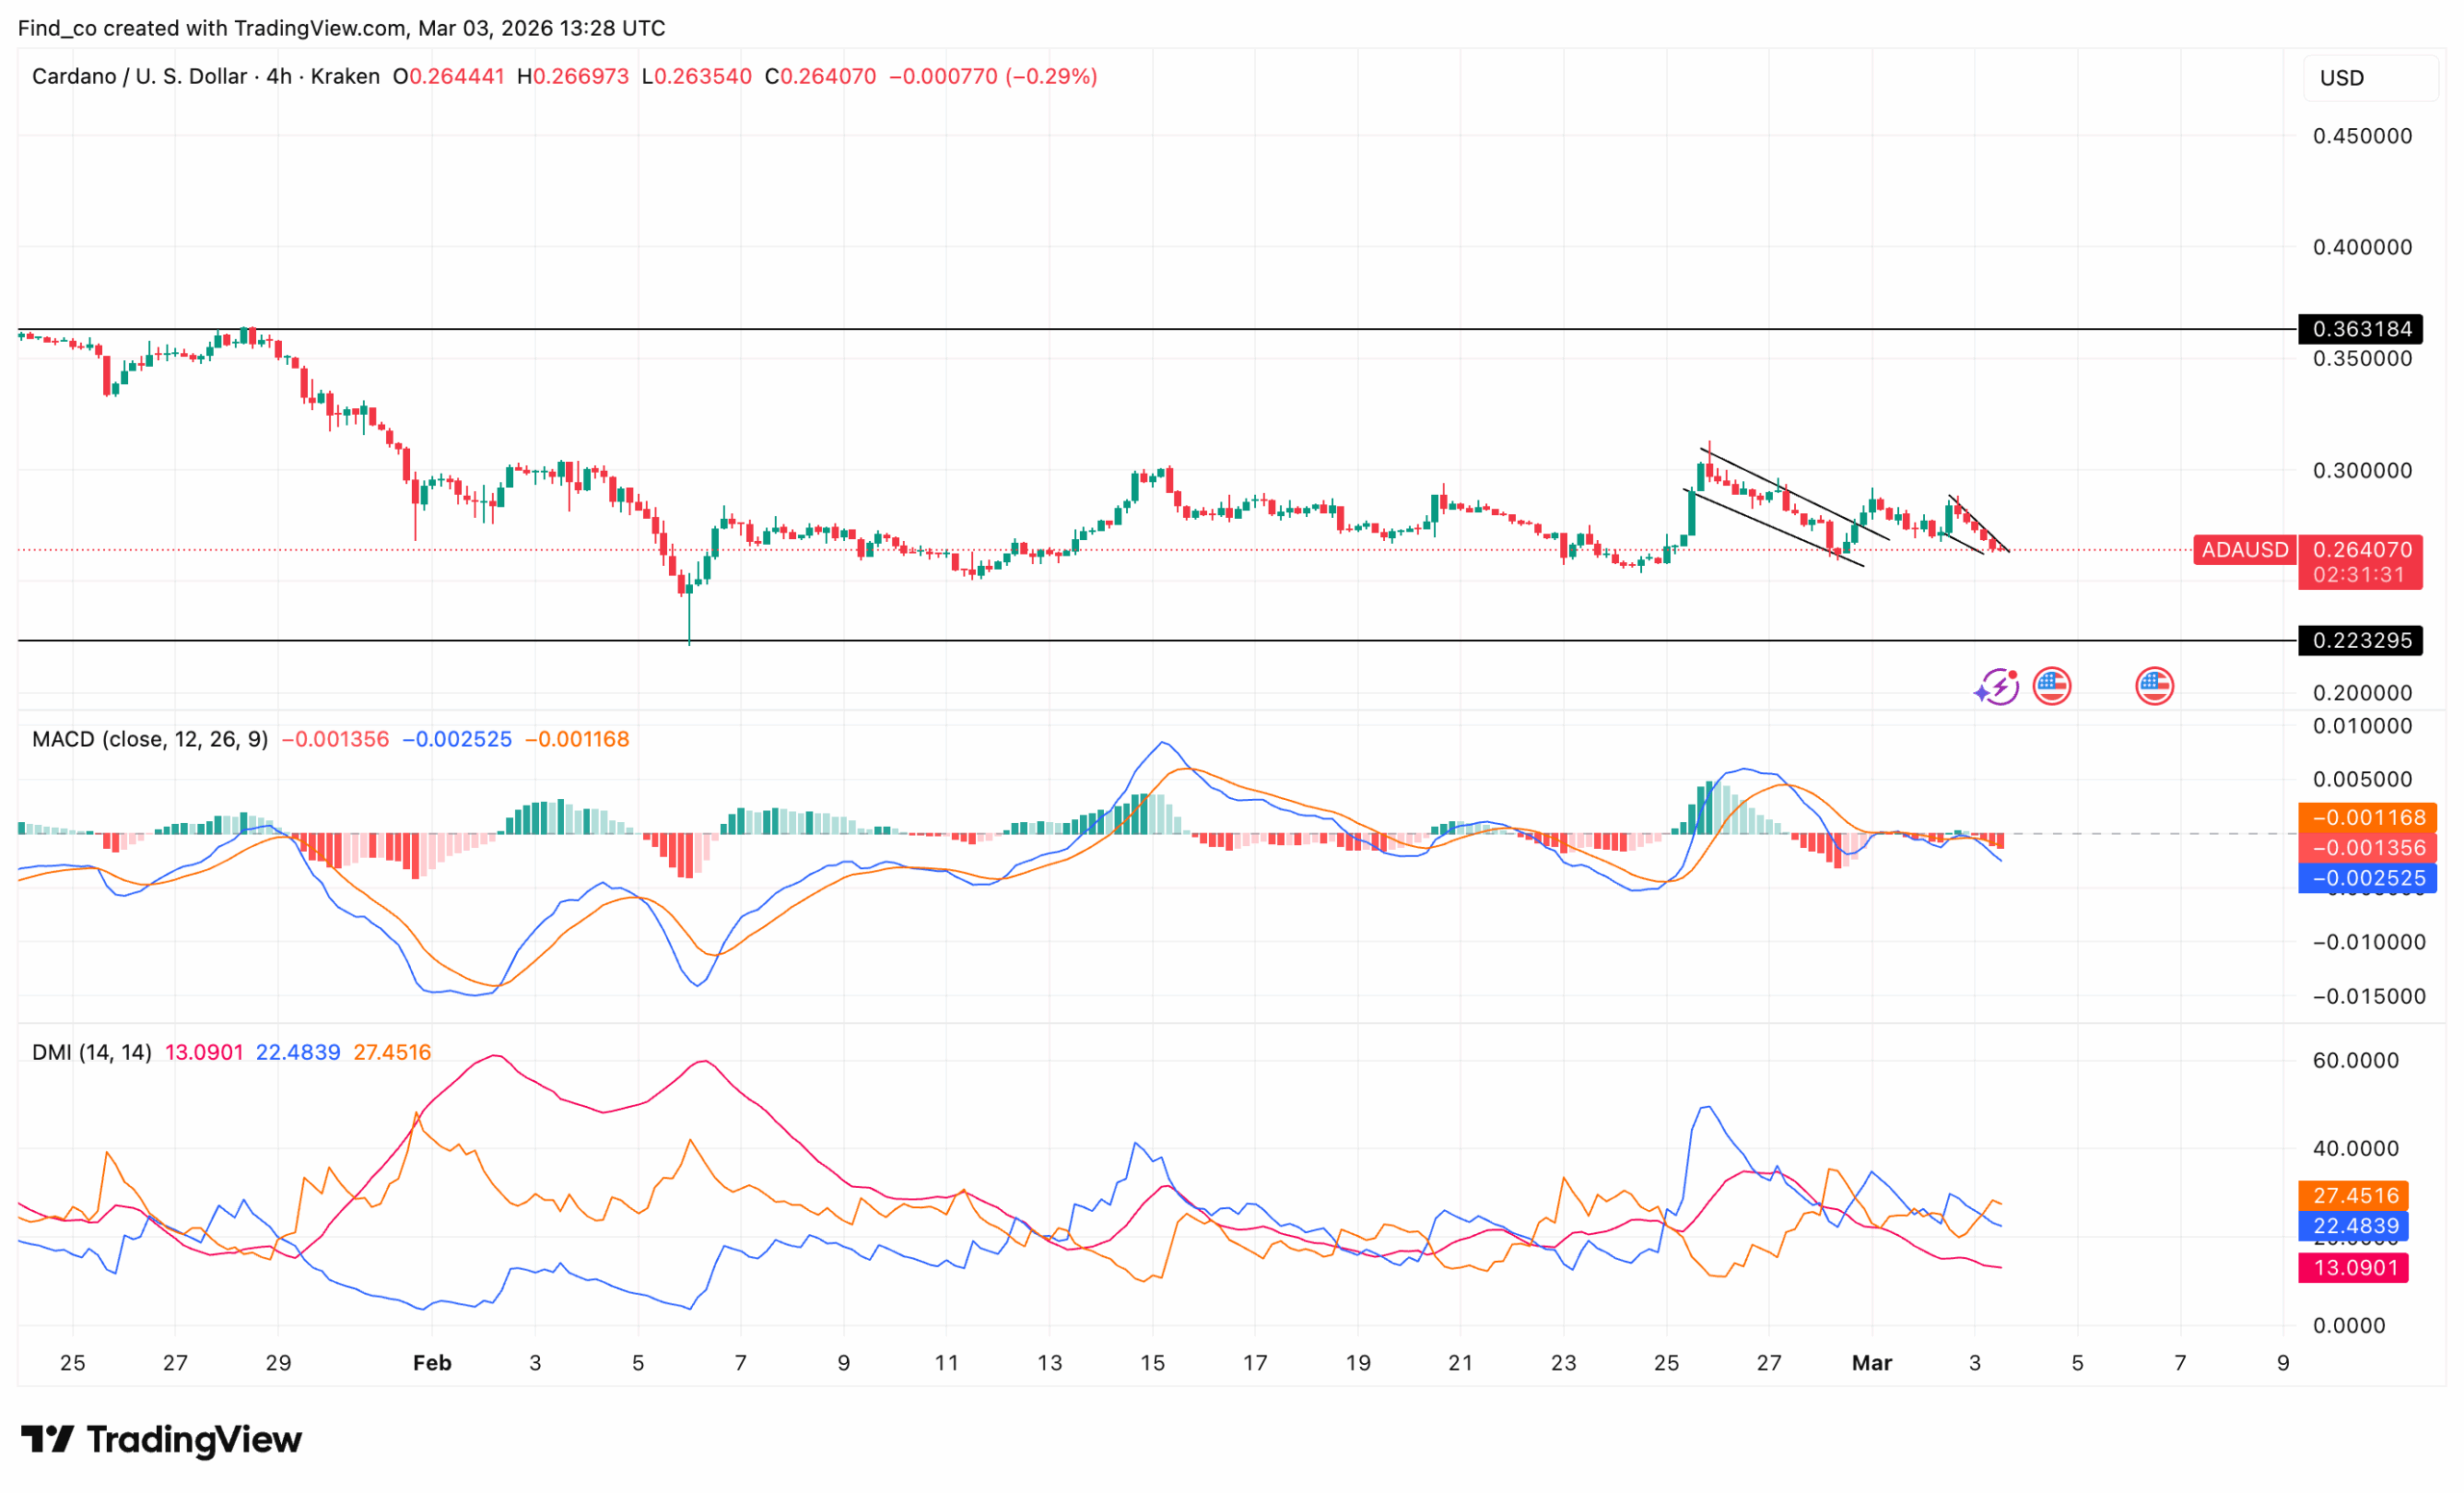
Earlier in February, ADA’s price plunged toward the $0.22 zone, prompting aggressive buying. As a result, ADA rebounded.
However, the recovery stalled below $0.30.
Since then, the price has moved sideways. Each rally into the $0.30 area has faced selling pressure. Meanwhile, dips toward $0.25 attract moderate bids but not strong accumulation.
Now, the price drifts back toward the lower-middle of the range. This signals indecision. More importantly, it shows a lack of conviction in the upside.
On the 4-hour chart, the Moving Average Convergence Divergence (MACD) histogram has flattened near zero. The signal lines are converging.
Previously, bullish momentum expanded during the late-February spike. However, that strength faded quickly. Now, the indicator prints slightly negative readings.
At the same time, the Directional Movement Index (DMI) shows weak trend strength. The Average Directional Index (ADX) is near 13, indicating no dominant trend is in place.
Nevertheless, the negative directional index slightly exceeds the positive one. Therefore, while the broader market remains range-bound, sellers currently hold a minor tactical edge.
Together, these indicators highlight a market with a weak trend
ADA Price Prediction: Bearish
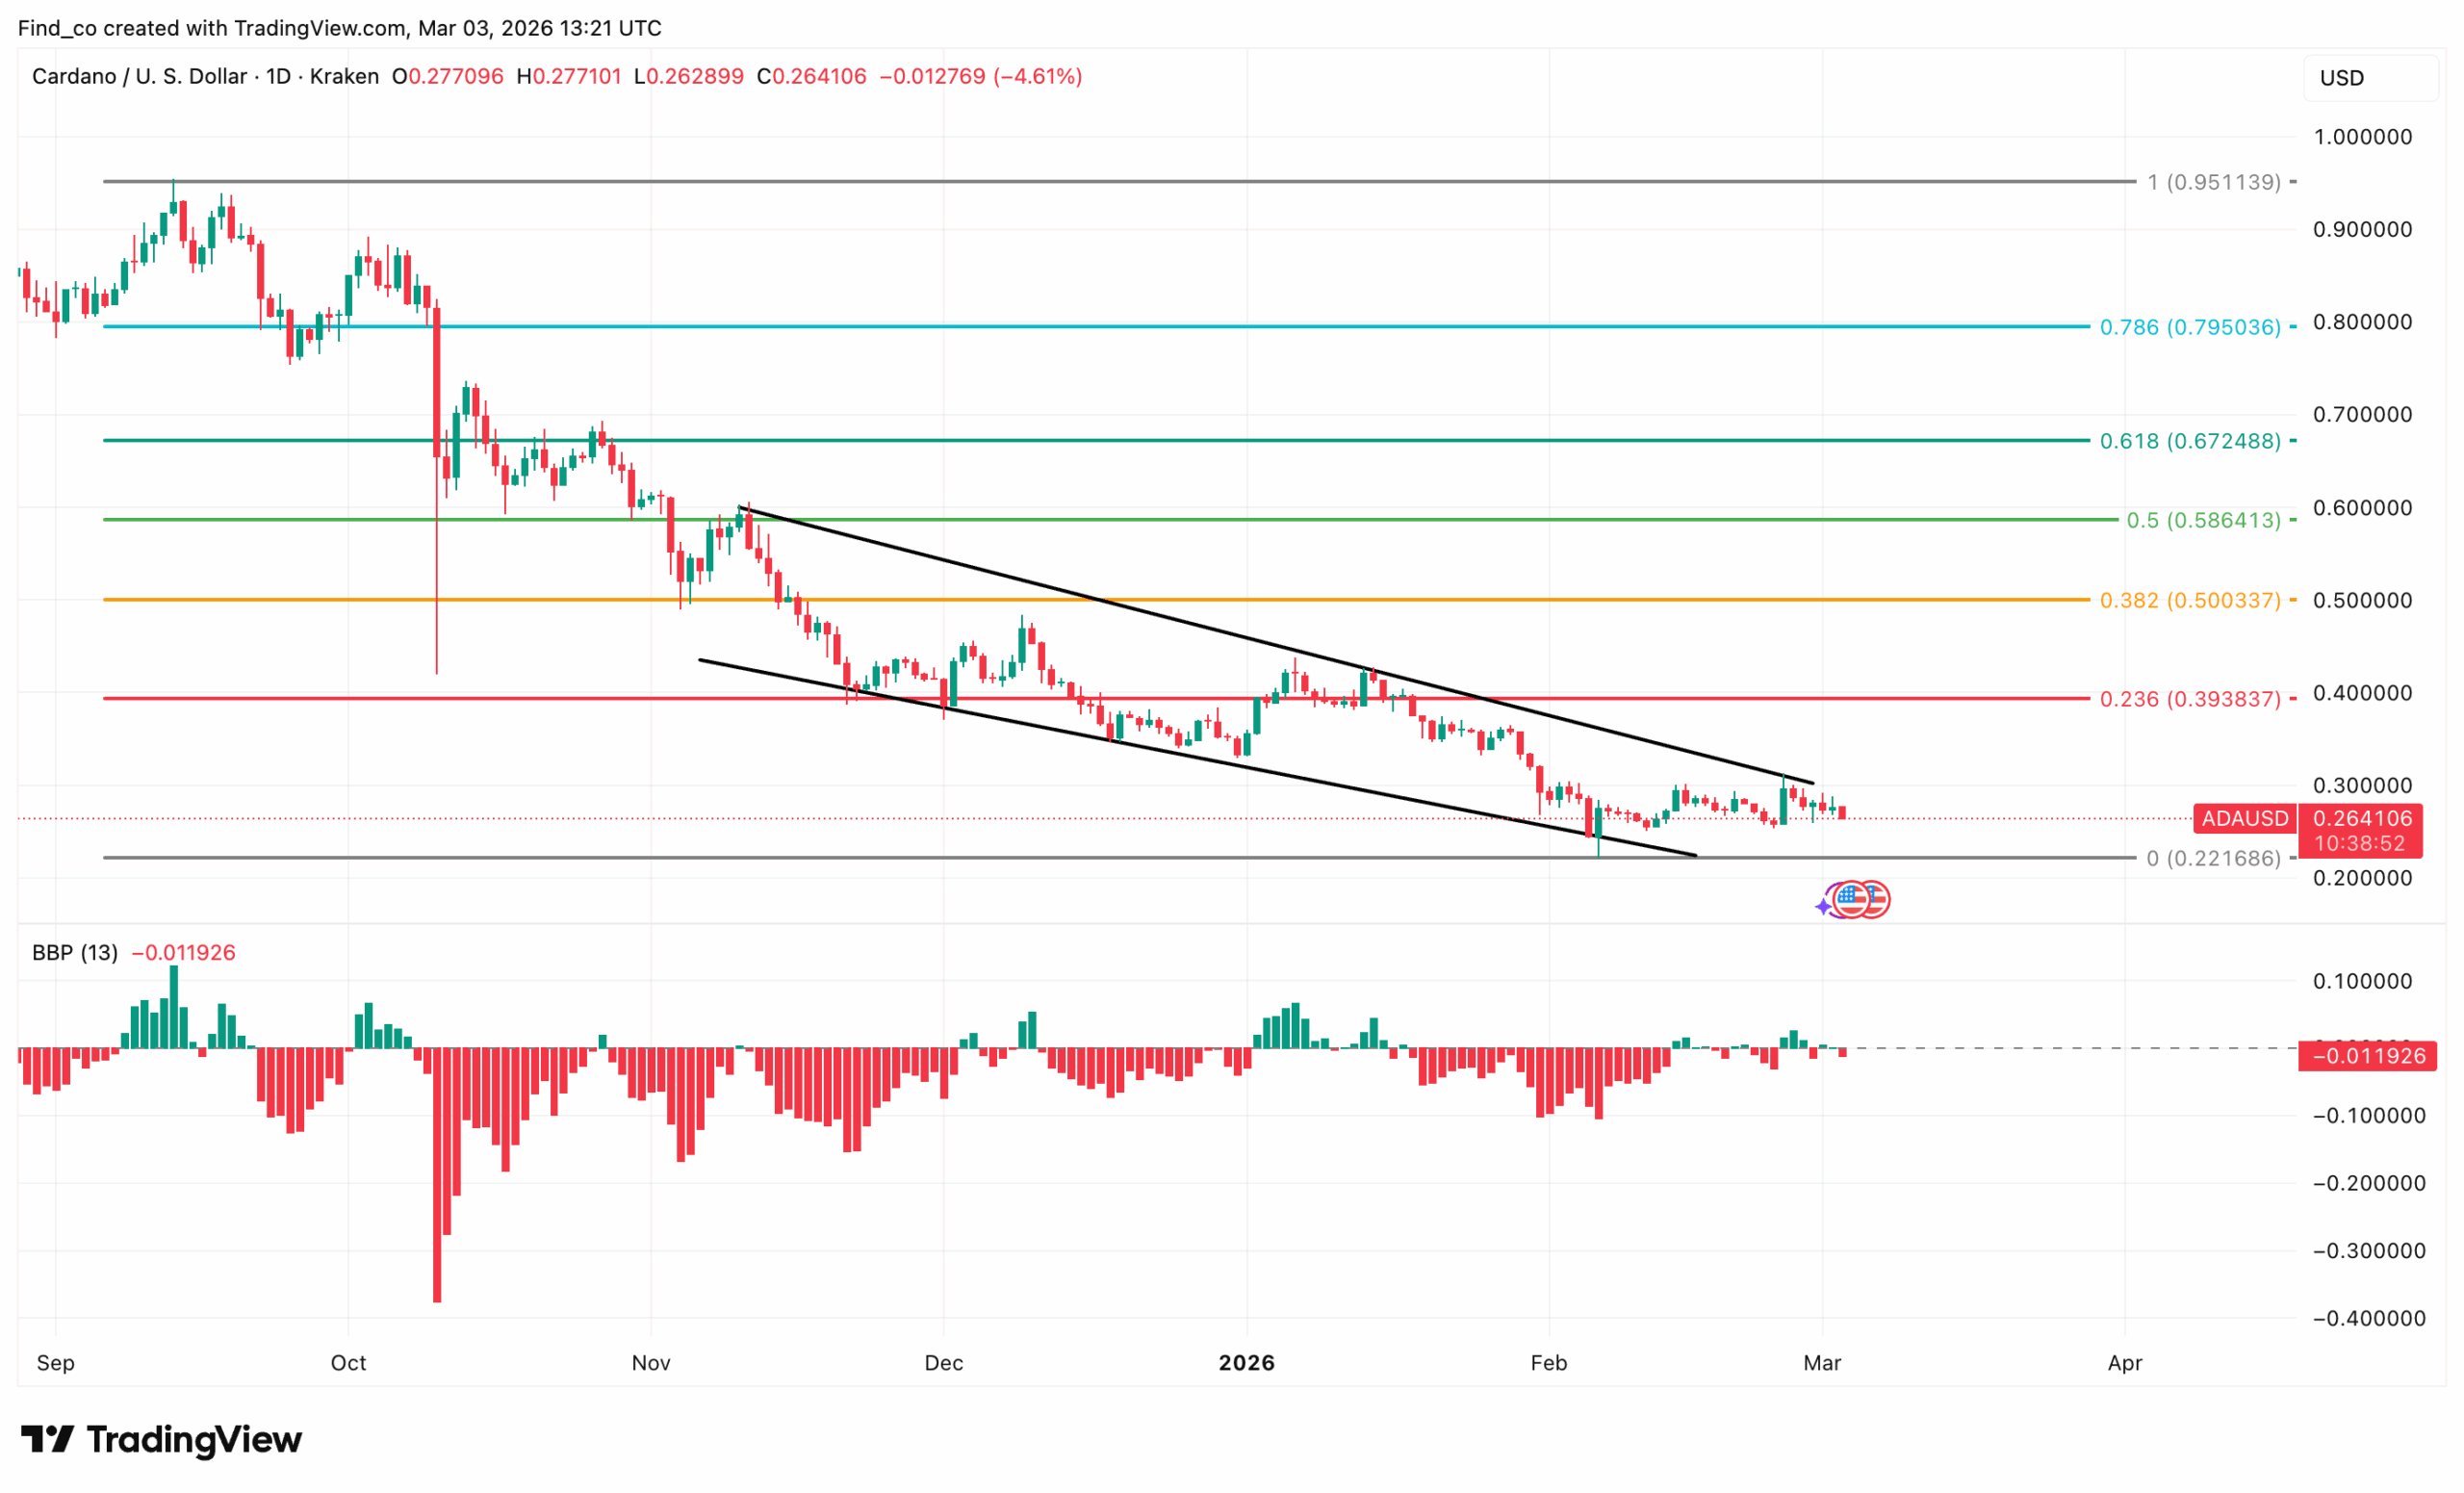
On the daily chart, Cardano continues to trade inside a well-defined descending channel, confirming that the broader structure remains bearish.
Price now sits near $0.26 after another rejection of the channel’s upper boundary. Every rally since late 2025 has printed a lower high.
That pattern has not changed.
Most recently, Cardano attempted a recovery toward the $0.30 zone but failed to sustain momentum. Sellers stepped in quickly.
Importantly, ADA’s price already broke below the 0.236 Fibonacci level at $0.41 and later lost the 0.382 level at $0.53 during the broader correction phase.
The breakdown accelerated once the 0.5 retracement near $0.620 gave way months ago. Since then, Cardano’s price has remained structurally weak, grinding lower within the channel.
Now, the critical support lies near $0.22, which aligns with the zero Fibonacci retracement level. That level recently attracted buyers, producing a short-term bounce.
Momentum indicators reflect this hesitation. Bull-bear power (BBP) prints slightly negative, signaling that sellers still maintain marginal control.
Meanwhile, the relative strength index (RSI) hovers near 42. That reading shows recovery from oversold conditions, but it remains below the neutral 50 mark, indicating that buyers are present, yet not dominant.
Therefore, the market faces a clear decision point. If ADA breaks below $0.221, the broader downtrend could accelerate, opening the door to further downside.
ADA/USD Daily Chart | Credit: TradingView
Conversely, a strong reclaim of $0.29 followed by a breakout above the channel’s upper boundary would signal structural improvement and shift short-term momentum.
For now, structure favors sellers. Until the descending channel breaks, rallies remain corrective rather than trend-changing.
Disclaimer:
The information provided in this article is for informational purposes only. It is not intended to be, nor should it be construed as, financial advice. We do not make any warranties regarding the completeness, reliability, or accuracy of this information. All investments involve risk, and past performance does not guarantee future results. We recommend consulting a financial advisor before making any investment decisions.
Victor Olanrewaju is a crypto analyst and reporter at CCN with deep roots in on-chain research and technical analysis. His crypto journey began in 2017, but it was the 2020 Uniswap airdrop that sparked a full-time pivot into the space.
With a foundation in copywriting, Victor honed his craft creating high-converting content for leading crypto brokers — most notably an XRP price prediction that ranked #1 on Google during the 2021 bull run.
He later joined AMBCrypto in 2022, where he combined storytelling with technical and on-chain analysis to cover key market narratives.
In 2024, he expanded his expertise at BeInCrypto, collaborating with analysts and using tools like Glassnode, Santiment, and IntoTheBlock to break down Bitcoin and altcoin trends.
At CCN, Victor covers the top cryptocurrencies, memecoins, macro shifts, blending real-time insights with deep-dive metrics.
He holds a Bachelor’s degree in Physics from the University of Ibadan, equipping him to simplify complex data for a wide audience. Follow his work or connect on LinkedIn or X.