Cardano’s price looks weak today, but our 2026 and 2030 forecasts tell a different story | Credit: Hameem Sarwar
Share
Key Takeaways
Current indicators show bearish control, but the CCN Index is stabilizing
The 2026 average price projection is estimated to be near $0.34 per ADA.
Long-term forecasts predict Cardano’s price will trade above $5 by 2030.
Like many other altcoins, Cardano’s (ADA) price has recently experienced a correction. However, recent analysis of this cryptocurrency shows that ADA is nearing the end of this decline.
While this potential change is subject to certain conditions, most indicators suggest that ADA will likely overlook another decline.
In this piece, CCN reveals the Cardano price prediction for 2026. We also outline key aspects of the project, including potential forecasts for 2026 and 2030.
Cardano Price Prediction
In this section, we disclose the potential price targets that Cardano may reach this year and provide forecasts for 2026 and 2023.
Despite that, it is essential to note that these predictions can change due to the volatile nature of the market.
Minimum Cardano Price Prediction
Average Cardano Price Prediction
Maximum Cardano Price Prediction
2026
$0.23
$0.34
$0.65
2027
$0.16
$0.28
$0.49
2030
$1.99
$3.10
$5.25
Cardano Price Prediction for 2026
For most of 2025, Cardano’s price has had a mixed performance. At one point, it sustained a rally, and at other times, it experienced a correction.
However, due to the recent selling pressure that ADA has experienced, it is likely to trade lower than it did at the end of 2025.
If that happens, ADA’s price could trade at an average price of $0.34. At the maximum, it could hit $0.65, while the minimum Cardano price prediction could be a decline to $0.23.
Cardano Price Prediction for 2027
Unlike the expected 2025 prediction, ADA’s price may struggle in 2026 as demand for the cryptocurrency declines.
Should that be the case, Cardano’s price might slide as low as $0.16. At the best market condition, it could trade at $0.49.
Get These Top Crypto Casino Offers Now!
Sponsored
Disclosure
We sometimes use affiliate links in our content, when clicking on those we might receive a commission at no extra cost to you. By using this website you agree to our terms and conditions and privacy policy.
2030 could be the year that ADA hits a new all-time high. By that time, retail and institutional adoption could have skyrocketed, and Cardano’s price could have swung between $1.99 and $5.25.
Cardano Price Analysis
On the weekly chart, the Exponential Moving Average (EMA) continues to signal persistent bearish pressure. The 20-week EMA remains positioned above the candlesticks.
Under these conditions, any upward movement faces immediate selling pressure, limiting ADA’s ability to mount meaningful short-term rebounds. Furthermore, sellers remain in control, leaving the token vulnerable to further declines.
The Awesome Oscillator (AO) also supports this bearish outlook. The indicator remains in negative territory, printing several consecutive red histogram bars.
At the time of writing, the AO sits near -0.10, reflecting strengthening downside momentum. Unless buying interest improves significantly, Cardano’s price is likely to continue probing lower support levels.
From a Fibonacci perspective, ADA’s structure has weakened further. The token is now trading below the 0.236 retracement level, suggesting that previous support zones have failed to hold.
ADA/USD Weekly Chart | Credit: TradingView
At press time, ADA trades below its multimonth low of $0.47, a level that historically offered strong support. Losing this zone places ADA at risk of deeper corrections.
Short-Term Cardano Price Prediction
On the daily chart, ADA’s Relative Strength Index (RSI) indicates that the asset has experienced a downturn, with no clear signs of reversal.
The RSI currently sits at 29.49 and is trending toward the oversold threshold near 20. This positioning underscores persistent selling pressure and a lack of meaningful buyer engagement.
A similar trend appears in the Bull Bear Power (BBP) indicator. This position confirms that bearish momentum continues to outweigh bullish attempts.
The alignment of a weakening RSI and a negative BBP confirms that sellers hold control.
Therefore, any rebound may remain shallow unless buying pressure increases dramatically. If current conditions persist, ADA’s price could move into a deeper correction phase.
In the bearish case, ADA’s price may slide toward its immediate support zone at $0.32, a level that could act as a temporary stabilization point if buyers step in.
ADA/USD Daily Chart | Credit: TradingView
However, a shift in trend direction hinges on ADA’s ability to reclaim key resistance levels. The critical price regions lie at $0.60, $0.73, and $0.93.
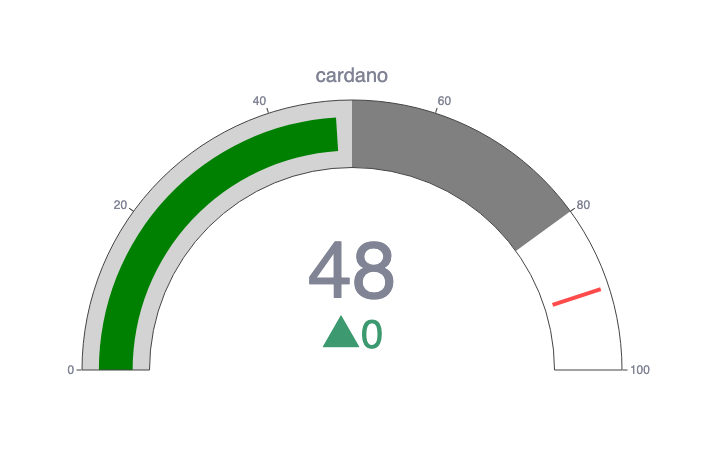
CCN Strength Index
The CCN Strength Index combines a range of advanced market signals to measure the strength of individual cryptocurrencies over the past 30 days.
Every day, it assigns a strength score, ranging from 0 to 100, to the top 500 assets by market capitalization on CoinMarketCap, focusing on both trend direction and the intensity of price movements.
0 to 24: Assets exhibit significant weakness, showing signs of sustained downtrend behavior.
25 to 35: The price tends to move within stable bounds with minimal volatility.
36 to 49: Assets begin a stable uptrend but without strong surges.
50 to 59: Consistent growth with moderate price advances, building momentum.
60+: Sharp price movements and high demand indicate more substantial volatility and trend shifts.
The index dynamically adapts to rapid changes. For example, an asset experiencing a 100% increase within a short timeframe would see a sharp jump in its score to reflect the intensity of the rise.
However, should that asset stabilize at this new price level, the score will gradually taper down and align with the dampened momentum as the movement normalizes.
In addition, the same principle applies to rapid declines: a sudden drop will spike the score downward, but the score will slowly adjust back up as volatility decreases.
As of Nov. 19, 2025, Cardano scored 48 on the CCN Index, indicating that the correction is nearing an end and momentum and price are stabilizing.
We examined the ADA price history and identified the lowest prices on specific days, months, quarters, and weeks of the year, indicating the optimal times to purchase ADA.
Time to Buy ADA
Best Days, Weeks, Months, and Quarters
Best Day
Saturday
Best Week
51
Best Month
December
Best Quarter
Fourth
ADA Performance Comparison
Cardano is a blockchain for smart contracts. Let’s compare it with other projects in the same category with similar market capitalizations.
CCN’s Senior Research Analyst, Toghrul Aliyev, examined Cardano and identified the following advantages and disadvantages.
Advantages of Cardano
High Nakamoto Coefficient: Cardano demonstrates substantial decentralization with a coefficient exceeding 200 when evaluating decentralization using the Nakamoto Coefficient. It is a well-distributed blockchain network, as the largest pool controls only about 0.17% of the total supply.
Research-Driven Development: Cardano collaborates with top academics for peer-reviewed research, employs formal methods (utilizing mathematical techniques to ensure software correctness), and uses interdisciplinary teams (comprising experts from various fields) to create a secure and reliable blockchain.
Reliable and Secure Code: Haskell’s strong typing system catches errors early, making the code reliable and reducing the likelihood of bugs. The language structure enables formal verification, allowing developers to mathematically prove that the code works correctly, thereby enhancing security. Additionally, Haskell’s code tends to be clean and easy to maintain because of its concise and clear syntax. Haskell also supports concurrent programming, which enables it to handle multiple tasks simultaneously and is useful for building scalable and efficient applications.
Energy Efficiency: Cardano is 24 times more efficient than Bitcoin, consuming only approximately 2.596 GWh across its 3,110 pools.
Parallel Processing and State Efficiency with the UTXO Model: Cardano utilizes the UTXO model to store user balances, enabling efficient parallel transaction processing. In this model, transactions can be processed independently if they involve different coins, enhancing scalability. Additionally, the UTXO model helps prevent state bloat by requiring more ADA to store larger amounts of data and limiting the maximum state size. Cardano’s blockchain is more efficient than account-based models, where parallelizing transactions is more complex, and state bloat is a significant issue.
Low Inflation Rate: Cardano boasts a low inflation rate, officially set at 3% per year. However, historical data from CoinMarketCap indicates an actual inflation rate of around 2.31% over the past year.
Disadvantages of Cardano
Slower Development Speed: While beneficial for security and reliability, the thorough and meticulous development process takes considerable time. This results in a slower development pace compared to competitors.
Challenges in adopting Haskell: Learning Haskell can be challenging for developers accustomed to more conventional programming styles, as it employs a functional programming approach. Haskell may not be as fast as languages like C++ for certain tasks in specific situations. Lastly, the Haskell community and its library and tool ecosystem are smaller than those of more popular languages, so finding resources and support can be more challenging.
Token Distribution and Centralization: Around 80% of ADA is in circulation, with broad ownership among individual investors. However, around 30% of this circulating supply is held by the top 300 addresses, which raises concerns about centralization and influence by a small number of entities.
Credit: CCN.com
Low Adoption: Cardano historically averages around 30,000 daily active addresses, which indicates very low adoption compared to its competitors.
Credit: Toghrul Aliyev/Artemis
Intense Competition: Cardano competes in the Proof-of-Stake industry with major players such as Ethereum, Solana, and Avalanche. The fierce competition challenges Cardano’s ability to attract developers, users, and investments, potentially limiting its growth and market share.
Scalability Issues: Cardano faces scalability challenges, which can hinder its ability to handle a high volume of transactions efficiently. Despite its innovative design and use of the Ouroboros PoS protocol, the network still struggles with throughput and latency compared to some of its competitors.
Lack of Slashing Penalties: In Cardano’s Proof of Stake protocol, the absence of slashing penalties means that validators face no punishment for adding blocks to conflicting forks. While this approach enhances user experience by reducing risks for stakers, it compromises security. Without slashing, the protocol becomes more susceptible to bribery attacks and collusion between validators.
ADA Price History
Period
Price
Last week (Nov. 12, 2025)
$0.55
Previous month (Oct. 19, 2025)
$0.63
Three months ago (Aug. 19, 2025)
$0.96
Previous year (Nov. 19, 2024)
$0.73
Five years ago (Nov. 19, 2020)
$0.11
Launch Price (Oct. 1, 2017)
$0.017
All-Time High (Sept. 2, 2021)
$3.10
All-Time Low (Oct. 1, 2017)
$0.017
Who Owns the Most Cardano (ADA)?
As of Nov. 19, 2025, one wallet held more than 4% of the Cardano supply.
addr1q8elqhkuvtyelgcedpup58r893awhg3l87a4rz5d5acatuj9y84nruafrmta2rewd5l46g8zxy4l49ly8kye79ddr3ksqal. This wallet held 1,871,132,230 ADA or 4.16% of the supply.
addr1q9cp6hfrsvqc0jn9eeskdtk3l7usqaa35lm925f7usqtzhnsr4wj8qcpsl9xtnnpv6hdrlaeqpmmrflk24gnaeqqk90qjgx. This wallet held 875,257,942 ADA or 1.95% of the supply.
addr1q8hsff3uwtphx7dtya7unjwjwug52e5jvqp09je6pwqx8k4jvuxrw2x5rr7e258a33yzkrhhlrrc5ezvd2z7qtdq0gasme4. This wallet held 452,300,055 ADA or 1.01% of the supply.
addr1q88ysqegp378eag7fauv5zyjvvuy8mca3dc0925hv0nzl8qp0jwyns8qwzf5dqtdlwkv7qt5upzcyfmd5yl43s89txvse89. This wallet held 289,874,246 ADA or 0.64% of the supply.
addr1qyygqeeund4he53cqhysdltuc0j6xgxlfu3hj98z4704jsakjp4htgx7ydh0h4ulzfdq6krx7vzm27av7z56fg3rv55qg5j. This wallet held 268,800,842 ADA or 0.60% of the supply.
Cardano Supply and Distribution
Supply and distribution
Figures
Maximum Supply
45,000,000,000
Circulating supply as of Nov. 19, 2025
36,095,092,968 (79.8% of maximum supply)
Holder distribution
The top 10 holders owned 9.99% of the maximum supply as of Nov. 19, 2025
From the Cardano Whitepaper
Cardano states in its technical documentation, also known as a whitepaper, that scientific research is at the heart of everything it does.
It says: “Cardano is a decentralized third-generation proof-of-stake blockchain platform and home to the ADA cryptocurrency. It is the first blockchain platform to evolve from a scientific philosophy and a research-first-driven approach.
“The Cardano platform has been designed from the ground up and verified by an industry-leading combination of top engineers and academic experts in blockchain and cryptography. It has a strong focus on sustainability, scalability, and transparency. It is a fully open-source project that aims to deliver an inclusive, fair, and resilient infrastructure for financial and social applications on a global scale. One of its primary goals is to bring reliable, secure financial services to those people who do not currently have access.”
Cardano (ADA) Explained
In the world of cryptocurrency, pretty much everything is powered by the blockchain. This decentralized ledger is so crucial to crypto that people outside the cryptocurrency sphere use the two terms interchangeably.
Blockchains can be split into two. Some use the Proof-of-Work (PoW) consensus mechanism.
This is where people add blocks to the chain and earn crypto by solving increasingly complex mathematical equations. Others use Proof-of-Stake (PoS).
This allows people to choose blocks based on the amount of crypto they already hold.
PoS is a newer working method that is seen as more environmentally friendly. One of the most notable PoS blockchains is Cardano.
How Cardano Works
Cardano boasts several features that distinguish it from other cryptocurrencies. First, it bases its developments on computer research, publishing its reports in peer-reviewed papers. Second, it features smart contracts and computer programs that automatically execute when certain conditions are met. These were introduced in September 2021.
It is powered by its native token, ADA, named after 19th-century computing pioneer Ada Lovelace. Cardano rewards people with ADA for adding blocks to the blockchain.
ADA holders can either vote on proposals related to the network or delegate their voting rights in exchange for additional rewards.
Cardano uses a consensus mechanism called Ouroboros. The system itself has two layers. The first, the Cardano Settlement Layer (CSL), is responsible for recording transactions and facilitating the transfer of the ADA coin.
The second, called Cardano Computational Layer (CCL), uses innovative contract technology that developers can use to transfer funds.
Additionally, the network accommodates three types of users. The first type is more nodes, which govern the Cardano blockchain. The second type is relay nodes, which help transfer data between the mCore nodes and the internet. Meanwhile, the third type is edge nodes, responsible for creating cryptocurrency transactions.
Is Cardano a Good Investment?
It is hard to say. Until recently, Ethereum (ETH) and Solana (SOL) had outpaced it in year-on-year growth; however, recent events have shifted the balance more in ADA’s favor, at least concerning ETH.
A lot will depend on whether the proposed Plomin hard fork gets voted through.
Will Cardano Go Up or Down?
No one can tell right now. While the Cardano cryptocurrency price predictions are largely optimistic, they have a well-deserved reputation for being inaccurate. Meanwhile, please note that prices are subject to fluctuation and change.
Should I Invest in Cardano?
Before deciding whether to invest in Bitcoin, you must conduct thorough research, not only on BTC but also on other related coins and tokens, such as Ethereum (ETH). Either way, you must also ensure you never invest more money than you can afford to lose.
As of Nov. 19, 2025, approximately 36.60 billion ADA were in circulation, out of a total supply of 44.99 billion.
Will Cardano reach $10?
Our price predictions suggest ADA might not reach $10 until at least the 2030s.
What is Cardano used for?
Cardano (ADA) is used to pay for transactions on the Cardano blockchain. It can also be staked in return for rewards, and holders can vote on changes to the network. It can also be bought, sold, and traded on exchanges.
Victor Olanrewaju is a crypto analyst and reporter at CCN with deep roots in on-chain research and technical analysis. His crypto journey began in 2017, but it was the 2020 Uniswap airdrop that sparked a full-time pivot into the space.
With a foundation in copywriting, Victor honed his craft creating high-converting content for leading crypto brokers — most notably an XRP price prediction that ranked #1 on Google during the 2021 bull run.
He later joined AMBCrypto in 2022, where he combined storytelling with technical and on-chain analysis to cover key market narratives.
In 2024, he expanded his expertise at BeInCrypto, collaborating with analysts and using tools like Glassnode, Santiment, and IntoTheBlock to break down Bitcoin and altcoin trends.
At CCN, Victor covers the top cryptocurrencies, memecoins, macro shifts, blending real-time insights with deep-dive metrics.
He holds a Bachelor’s degree in Physics from the University of Ibadan, equipping him to simplify complex data for a wide audience. Follow his work or connect on LinkedIn or X.