Cardano adoption signals improve, but ADA struggles below key resistance | Credit: Hameem Sarwar
Share
Key Takeaways
Cardano’s active addresses have risen, yet ADA’s price continues to fall.
Large holders are distributing their ADA amid growing bearish sentiment.
Indicators suggest ADA’s price is likely to decline further despite the uptick in network activity.
Cardano (ADA) is in a familiar yet uncomfortable position.
The network is becoming increasingly active, but, like many other cryptocurrencies, ADA’s price has continued to fall.
Cardano remains in a multi-month downtrend, down roughly 66% from its 2025 highs.
This analysis examines why the recent rise in active addresses may not translate into higher prices.
Cardano Network Activity Rises
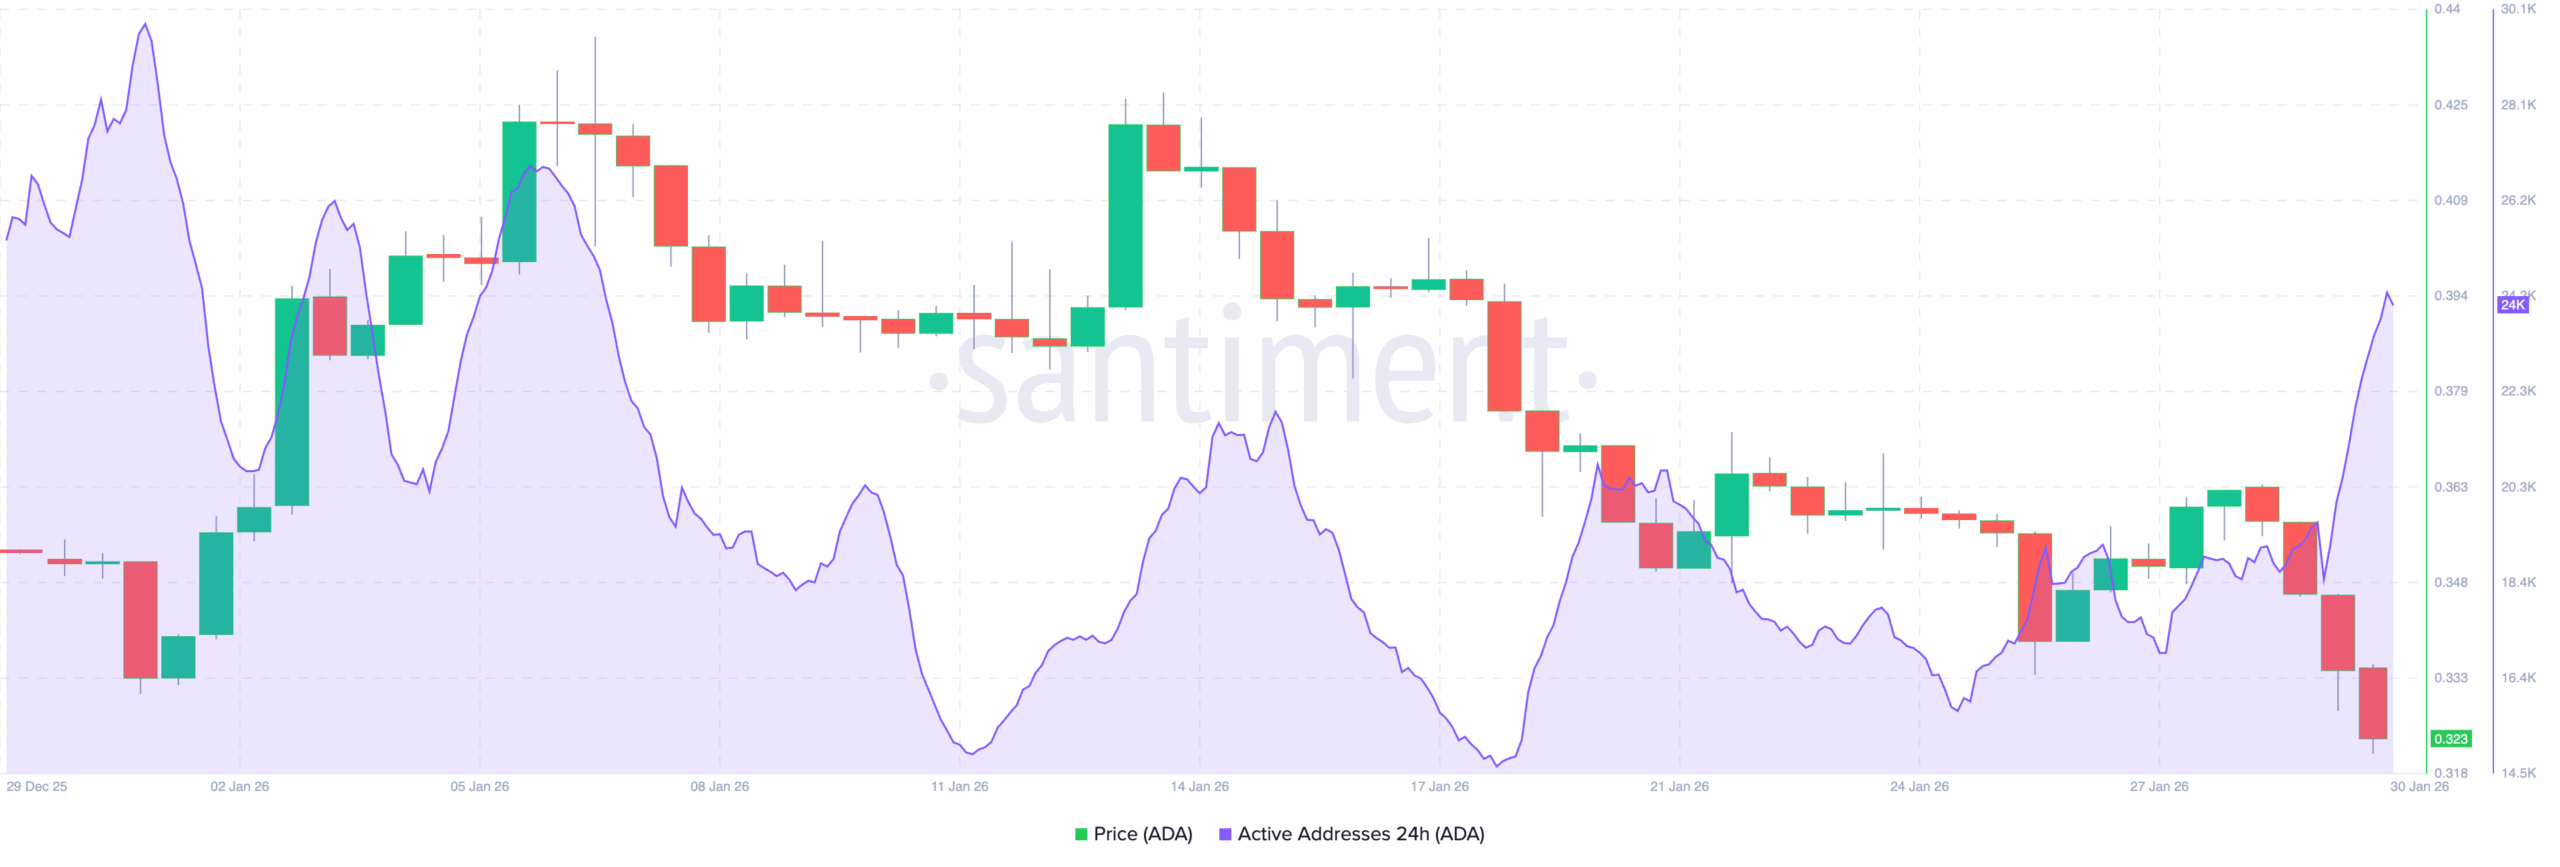
According to Santiment data, daily active addresses have jumped.
However, the state of that usage is different from prior cycles. This time it’s being driven by participation rather than positioning.
The ratification of the Cardano Constitution and the Vision 2030 framework on Jan. 24 brought a large base of holders into governance flows, forcing them to interact with voting and delegation tools.
At the same time, attention around Midnight, Cardano’s privacy-focused sidechain, has intensified.
Trading activity tied to the NIGHT token has surged on Cardano-native DEXs.
While that requires ADA for gas and liquidity, it still represents functional demand rather than directional speculation.
Cardano’s price, however, hasn’t responded to this rise in network activity.
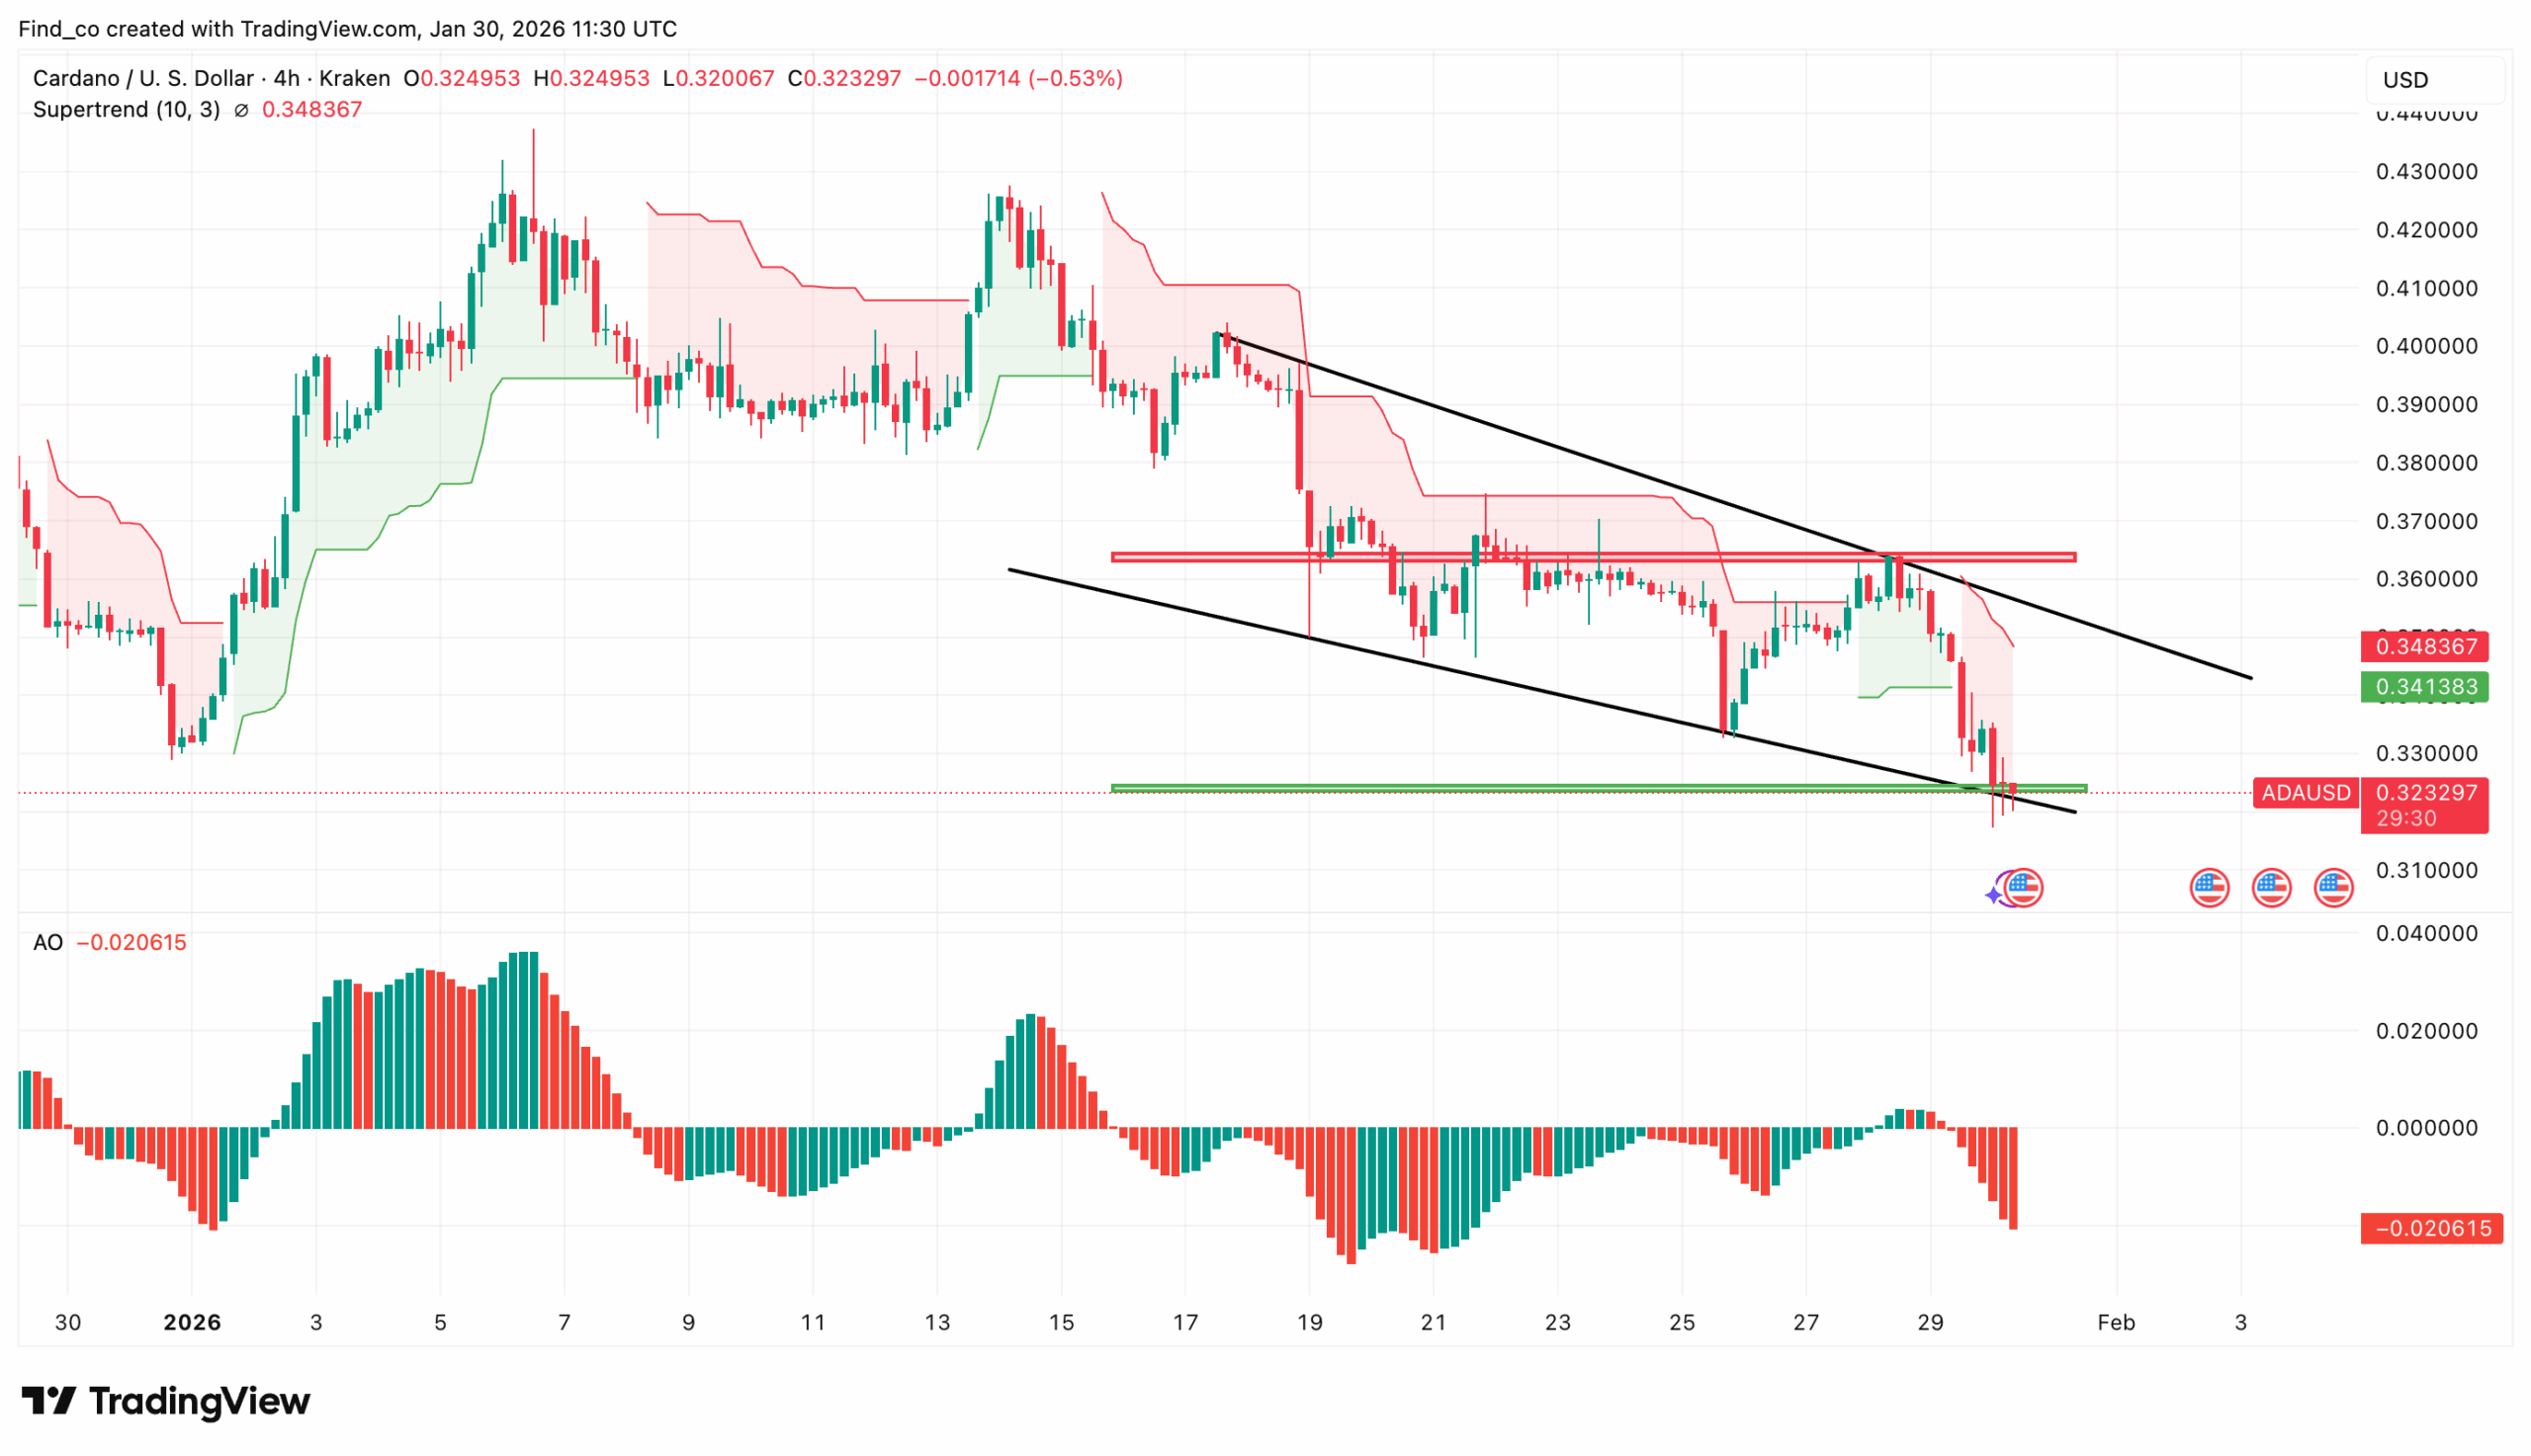
At press time, ADA is still trading around the mid $0.33 and continues to struggle below the $0.40 psychological level.
Most recently, the price faced rejection near $0.36. In support of this, the Awesome Oscillator (AO) remains negative and is continuing to decline, signaling growing bearish momentum.
At the same time, the Supertrend indicator stays in sell mode, reinforcing downside control.
Importantly, ADA is now testing a critical demand zone between $0.32 and $0.33.
This area has acted as short-term support in recent sessions.
A breakdown below it would invalidate the current base and expose the market to a deeper pullback toward the $0.28 region, where historical demand sits.
However, if buyers manage to defend this level, a short-term bounce is still possible.
Any upside move, though, would likely face heavy resistance near $0.36.
Whales Support the Downturn
Adding to the imbalance, large holders appear to be leaning the other way.
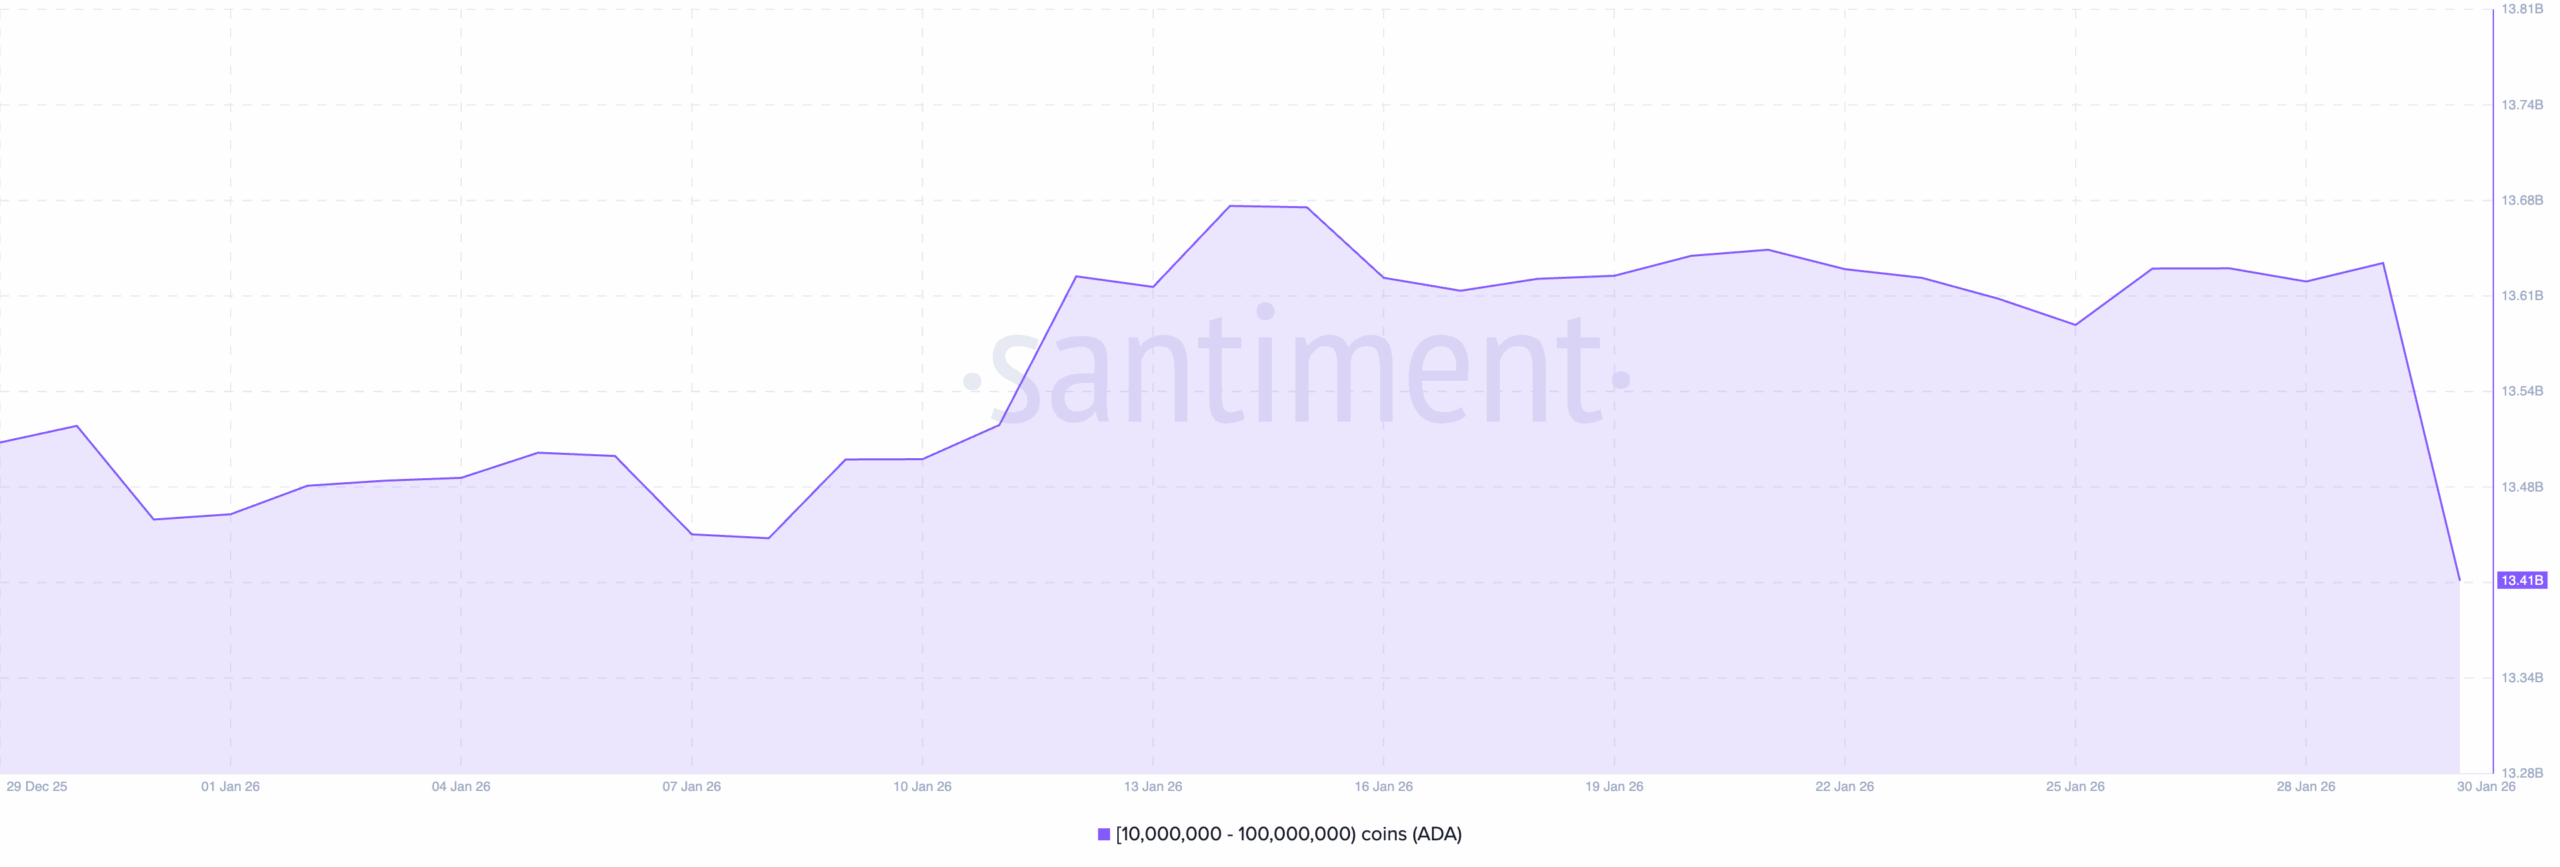
Although retail activity has picked up, wallets holding over 10 million ADA have slightly reduced their exposure since the start of the year.
This suggests that governance and ecosystem developments may be offering exit liquidity rather than encouraging accumulation.
As seen below, on-chain data shows the supply held by addresses owning 10 million to 100 million ADA has dropped sharply at the end of January.
This marks one of the steepest single-day declines this month.
Earlier in the period, whale balances trended higher. Accumulation accelerated around mid-January as ADA attempted to stabilize above $0.35.
That buildup helped cushion downside pressure and supported short-lived rebounds.
However, the trend has now reversed.
The sudden drop suggests distribution rather than rotation. Historically, similar drawdowns in whale-held supply have preceded extended consolidation or deeper pullbacks.
With ADA’s price hovering around $0.32, reduced whale participation weakens the bid and raises the risk of a breakdown into lower-demand areas.
ADA Price Prediction: Lower Values
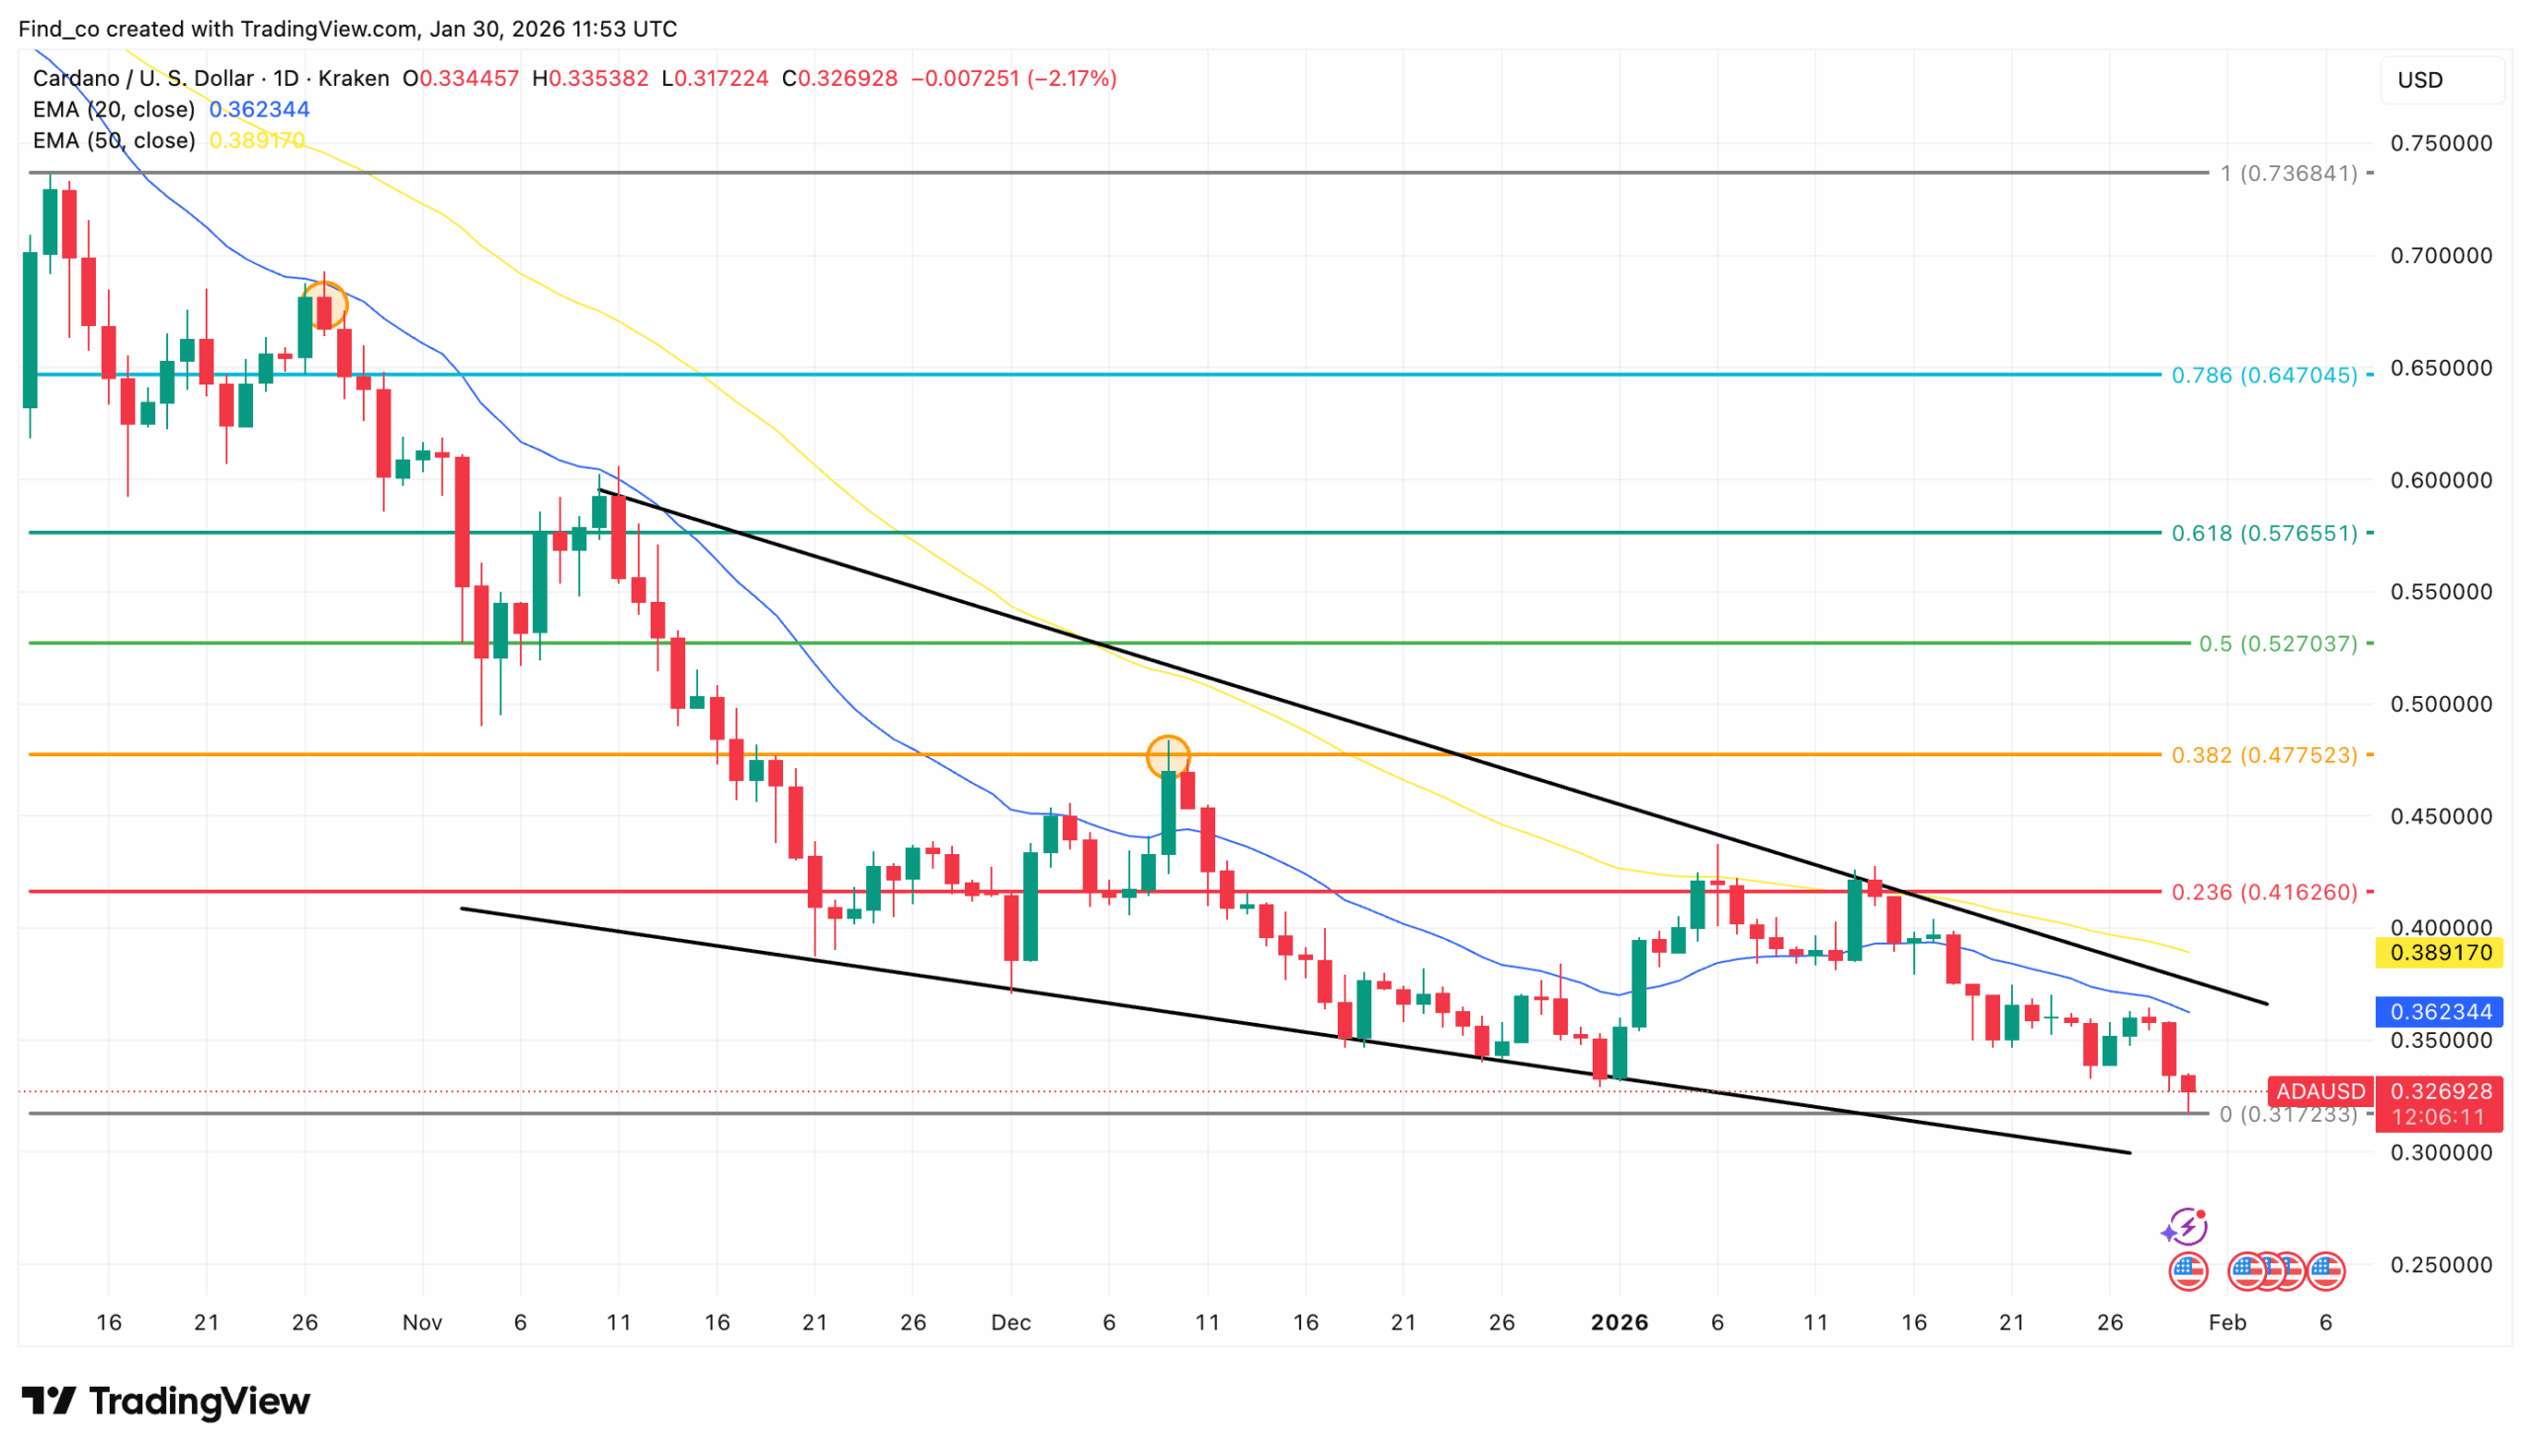
On the daily chart, Cardano trades below the 20-day and 50-day exponential moving averages, maintaining a firmly bearish structure.
Former support levels have now become resistance, particularly the $0.38–$0.41 range, which aligns with the 0.236 Fibonacci retracement and the descending trendline, repeatedly capping upward attempts.
Meanwhile, other indicators offer little relief. As seen below, ADA’s price is grinding lower along the bottom of the channel, signaling weak demand.
At the same time, the inability to reclaim the mid-channel area suggests sellers remain in control.
Looking ahead, the $0.32 area is the level to watch. A break below it could expose ADA to deeper losses toward the psychological $0.30 mark.
Conversely, stabilization here could allow for a short-term bounce. However, any recovery would need to reclaim at least $0.38 to shift the outlook.
What Could Change Things?
The one variable that could disrupt this stalemate is external rather than internal. The planned launch of ADA futures on the CME on Feb. 9 introduces a different class of participant into the equation.
A regulated derivatives market would allow institutional players to hedge, express views, and potentially create the kind of positioning imbalances that spot alone hasn’t produced.
If ADA’s price can hold $0.30 into that event, the combination of compressed prices and new market access could force a reassessment.
Until then, Cardano’s story is clearer on-chain than on the price chart.
The network is shedding the “ghost chain” label and leaning into governance and utility.
However, the market is still rewarding assets more closely tied to Bitcoin beta or Ethereum yield. For now, rising active addresses signal ecosystem health, not an imminent price reversal.
Disclaimer:
The information provided in this article is for informational purposes only. It is not intended to be, nor should it be construed as, financial advice. We do not make any warranties regarding the completeness, reliability, or accuracy of this information. All investments involve risk, and past performance does not guarantee future results. We recommend consulting a financial advisor before making any investment decisions.
Victor Olanrewaju is a crypto analyst and reporter at CCN with deep roots in on-chain research and technical analysis. His crypto journey began in 2017, but it was the 2020 Uniswap airdrop that sparked a full-time pivot into the space.
With a foundation in copywriting, Victor honed his craft creating high-converting content for leading crypto brokers — most notably an XRP price prediction that ranked #1 on Google during the 2021 bull run.
He later joined AMBCrypto in 2022, where he combined storytelling with technical and on-chain analysis to cover key market narratives.
In 2024, he expanded his expertise at BeInCrypto, collaborating with analysts and using tools like Glassnode, Santiment, and IntoTheBlock to break down Bitcoin and altcoin trends.
At CCN, Victor covers the top cryptocurrencies, memecoins, macro shifts, blending real-time insights with deep-dive metrics.
He holds a Bachelor’s degree in Physics from the University of Ibadan, equipping him to simplify complex data for a wide audience. Follow his work or connect on LinkedIn or X.