ADA looks likely to keep trading sideways | Credit: Hameem Sarwar
Share
Key Takeaways
Cardano remains trapped in a tight range, with repeated rejections below the resistance.
Momentum indicators remain neutral to weak as MACD is flattening near the zero line.
Exchange outflows suggest accumulation, yet the broader structure stays bearish.
Cardano (ADA) should be breaking out. By almost every fundamental measure, ADA ticks the right boxes.
Yet the breakout refuses to arrive. Every rally fades at the same resistance zones, and the frustration among ADA holders, many of whom have been waiting through multiple market cycles for the price to reflect the project’s technical ambitions, is reaching a genuine inflection point.
In this analysis, CCN explains why Cardano’s price has failed to breakout. Here, we also evaluate what could be next in the short term.
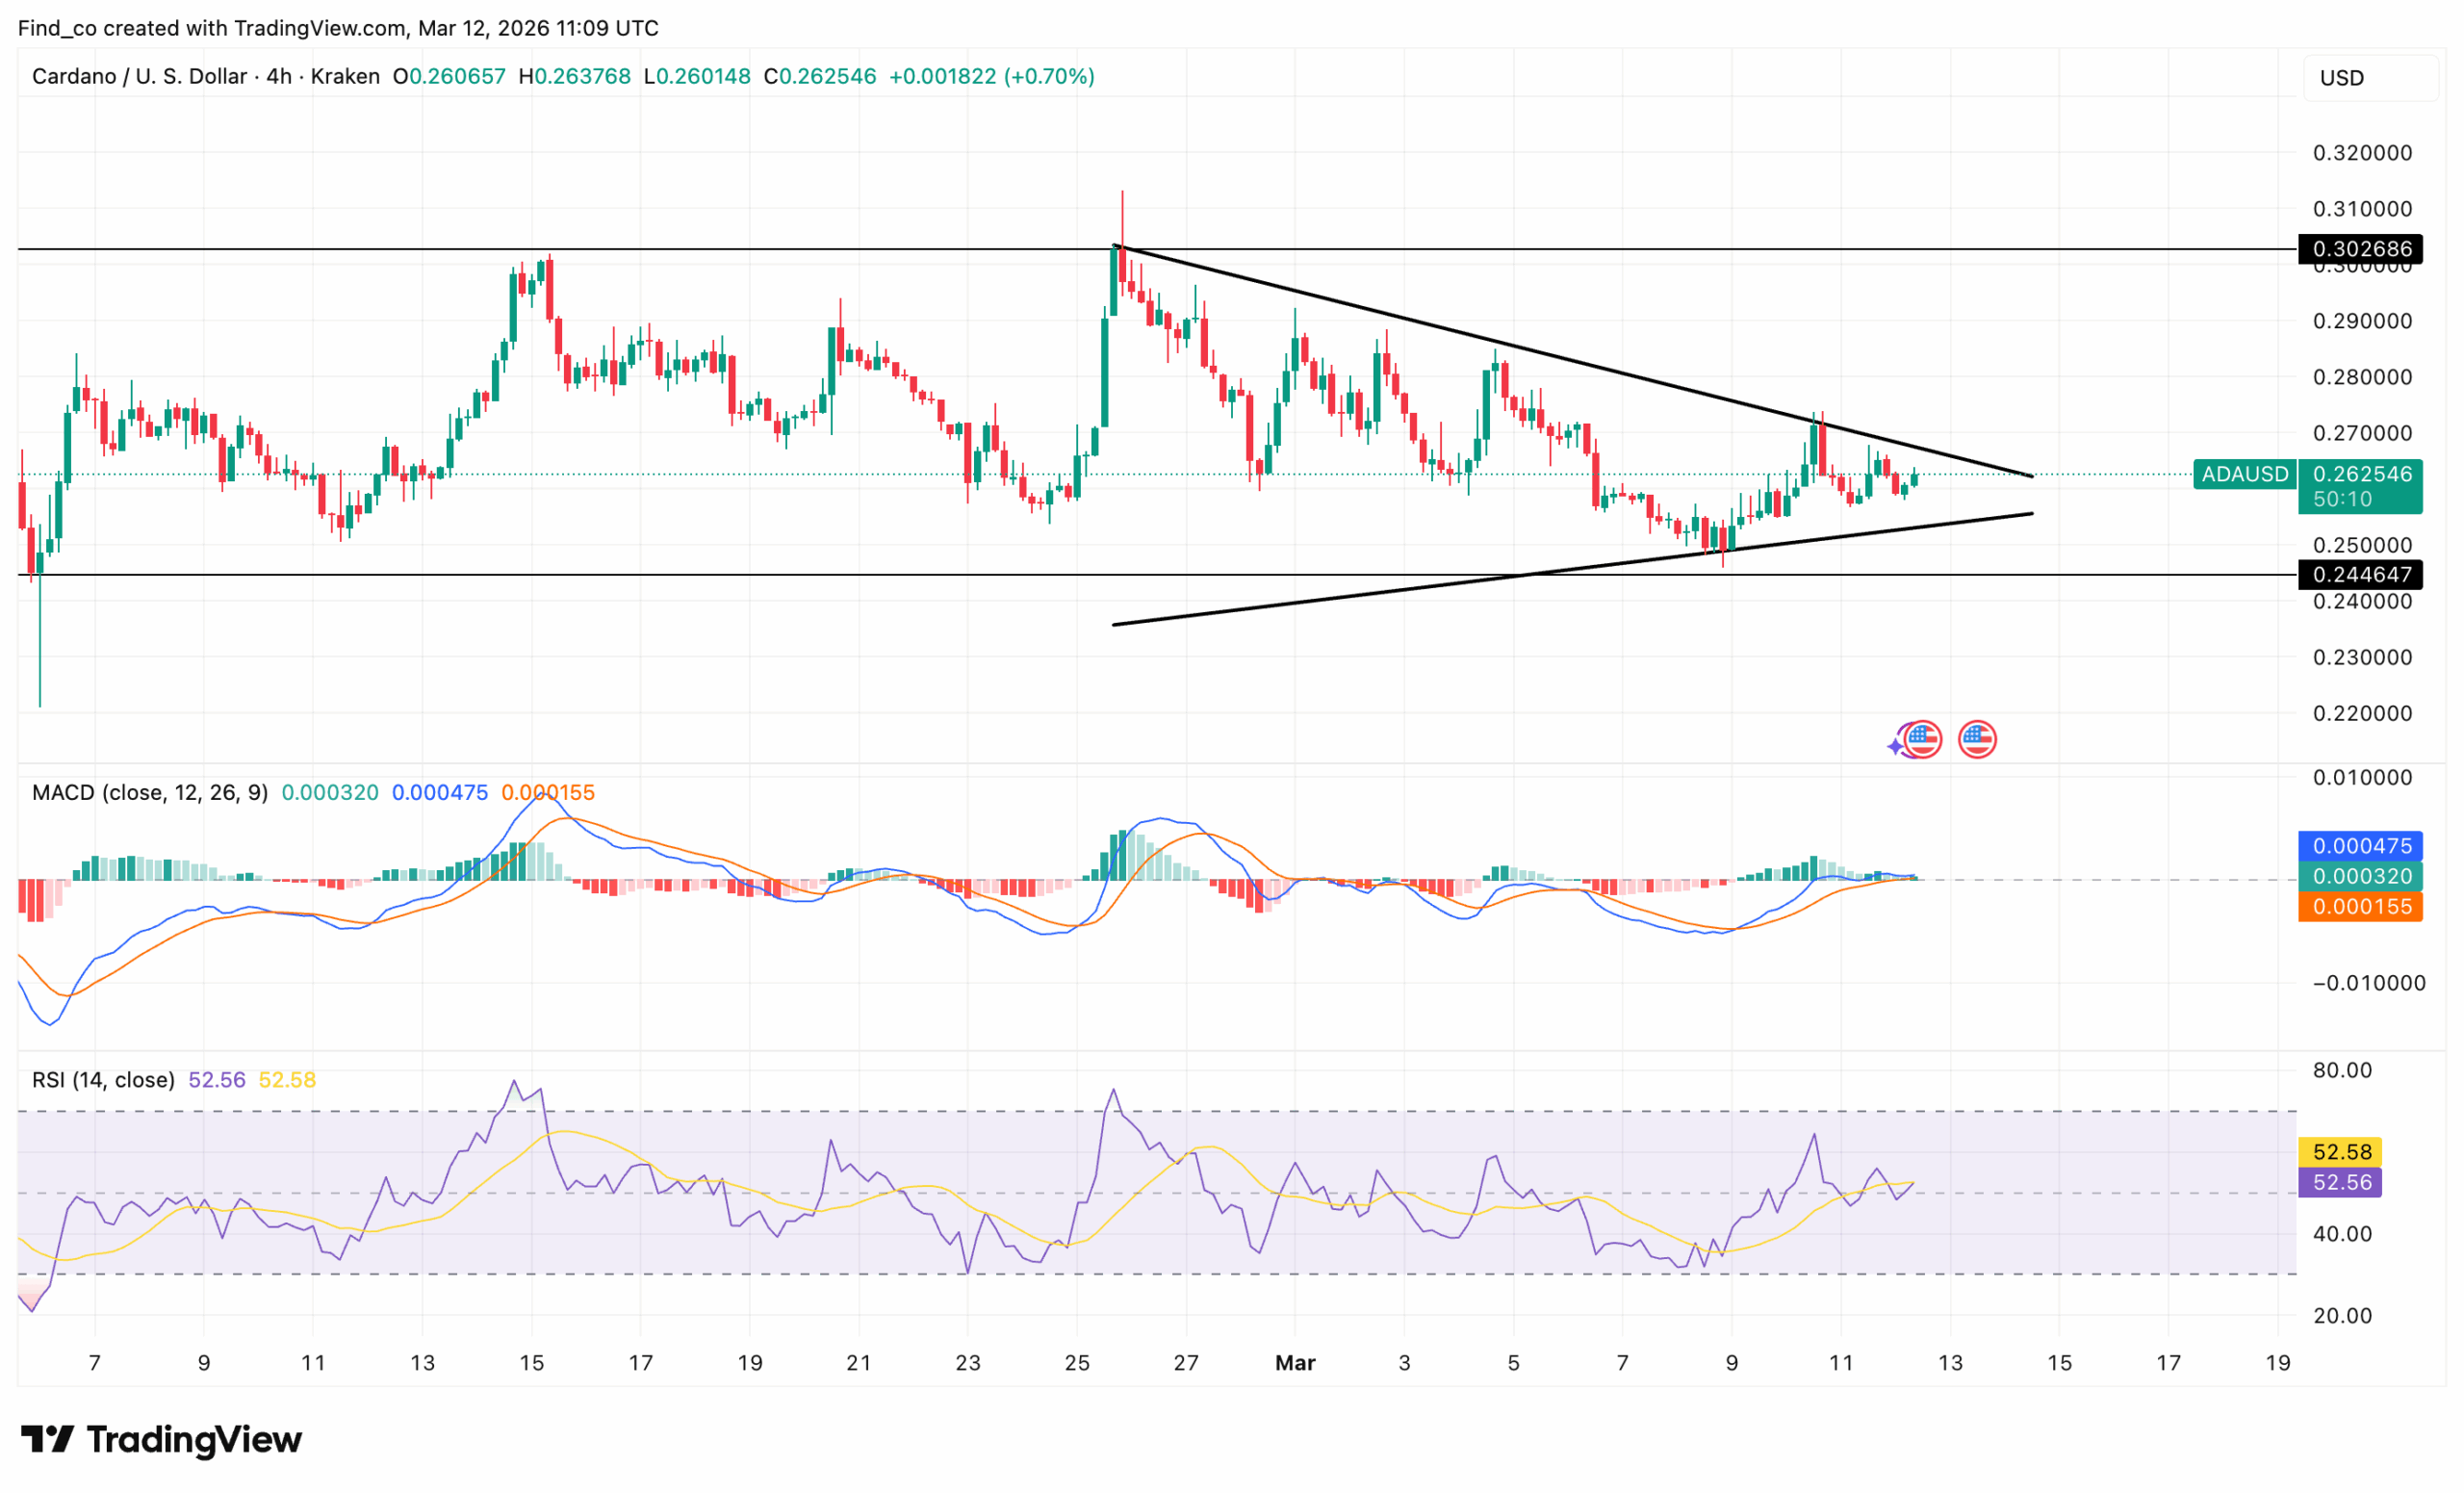
Price action shows repeated attempts to recover. Yet, buyers continue to struggle below a strong resistance zone near $0.29 as Cardano’s price remains stuck in a symmetrical triangle.
Earlier rallies pushed the coin briefly toward $0.30, but sellers quickly stepped in. As a result, the market formed lower highs, signaling that bullish momentum has gradually weakened.
Meanwhile, the $0.25 area remains a reliable demand zone. Every drop toward this level has attracted buyers, preventing a deeper breakdown for Cardano’s price
The chart now reflects a clear horizontal consolidation structure. Technical indicators on the 4-hour chart reinforce the current indecision.
First, the Moving Average Convergence Divergence (MACD) indicator is flattening near the zero line. The histogram shows fading momentum, while the signal lines are tightly compressed.
This pattern typically appears when markets enter low-volatility consolidation phases.
At the same time, the Relative Strength Index (RSI) sits around the 50 midpoint.
This neutral reading indicates that neither buyers nor sellers currently control the market. However, the RSI is slowly curling upward.
If buying pressure increases and bulls reclaim the $0.29 resistance level, momentum could gradually shift in favor of bulls.
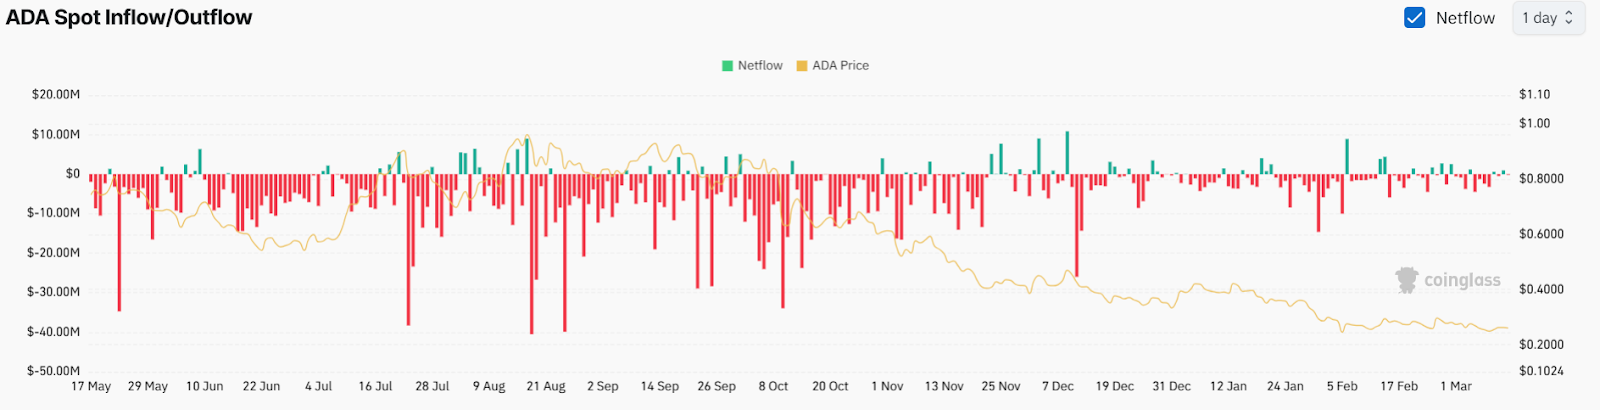
ADA Exchange Supply Declines
On-chain data adds another layer to this outlook. Data from Cardano spot flows shows persistent exchange outflows, a signal that often reflects accumulation rather than distribution.
The chart indicates a net outflow of about $187,000, meaning more ADA is leaving exchanges than entering them.
This pattern suggests holders are moving their coin into private wallets or staking, reducing immediate sell pressure on the market.
If this trend continues, it might not lead to a further decline in ADA’s price. However, it also does not imply that the Cardano price will trade much higher.
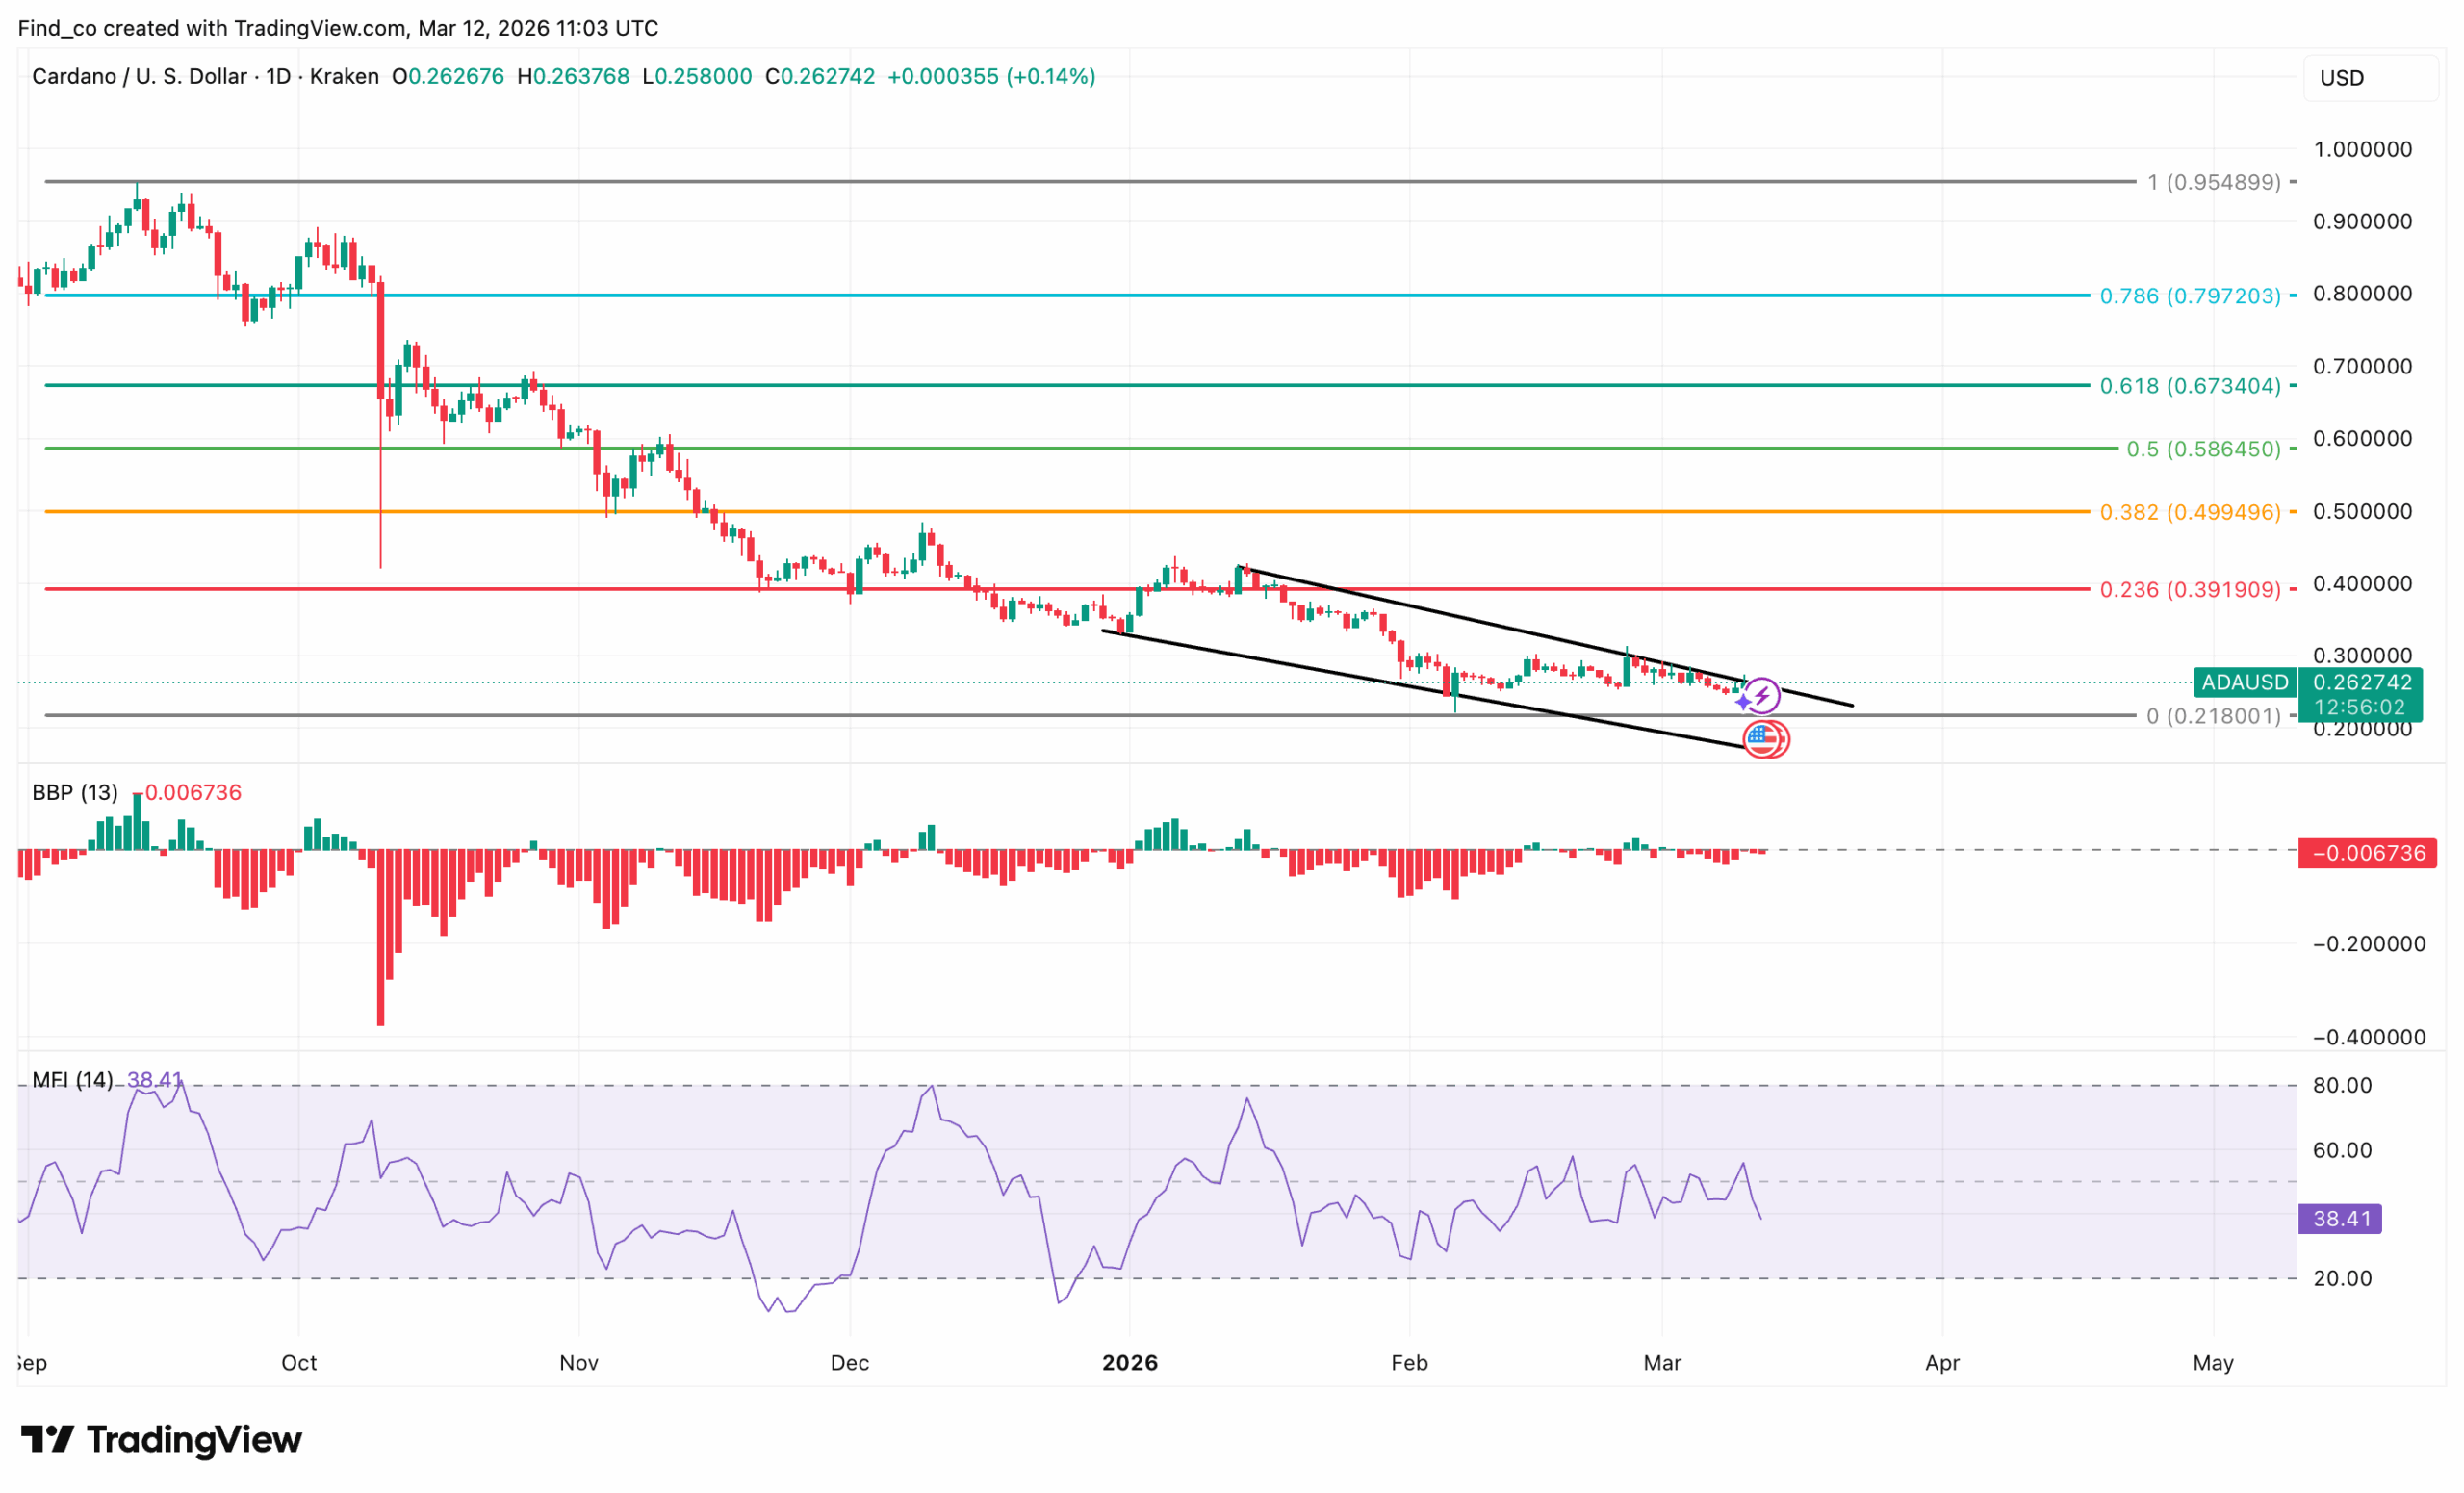
Recently, price action formed a narrowing descending channel near $0.26, indicating that sellers still dominate the broader market structure.
The cryptocurrency also remains below the 0.236 Fibonacci level around $0.40, reinforcing the prevailing bearish structure.
Momentum indicators reflect this weakness. The Bull Bear Power (BBP) indicator stays in negative territory, suggesting that selling pressure continues to outweigh buying activity.
At the same time, the Money Flow Index (MFI) sits near 35, showing that capital inflows remain relatively weak despite minor recovery attempts.
Disclaimer:
The information provided in this article is for informational purposes only. It is not intended to be, nor should it be construed as, financial advice. We do not make any warranties regarding the completeness, reliability, or accuracy of this information. All investments involve risk, and past performance does not guarantee future results. We recommend consulting a financial advisor before making any investment decisions.
Victor Olanrewaju is a crypto analyst and reporter at CCN with deep roots in on-chain research and technical analysis. His crypto journey began in 2017, but it was the 2020 Uniswap airdrop that sparked a full-time pivot into the space.
With a foundation in copywriting, Victor honed his craft creating high-converting content for leading crypto brokers — most notably an XRP price prediction that ranked #1 on Google during the 2021 bull run.
He later joined AMBCrypto in 2022, where he combined storytelling with technical and on-chain analysis to cover key market narratives.
In 2024, he expanded his expertise at BeInCrypto, collaborating with analysts and using tools like Glassnode, Santiment, and IntoTheBlock to break down Bitcoin and altcoin trends.
At CCN, Victor covers the top cryptocurrencies, memecoins, macro shifts, blending real-time insights with deep-dive metrics.
He holds a Bachelor’s degree in Physics from the University of Ibadan, equipping him to simplify complex data for a wide audience. Follow his work or connect on LinkedIn or X.