How Will Bitcoin Fare the Rest of the Year? | Credit: Derek Fenech
Share
Key Takeaways
Bitcoin’s (BTC) price is crashing below the $109,500 horizontal area.
Bitcoin has completed a five-wave rise since November 2022.
Is Bitcoin’s market cycle over, or can the price reach another high?
Bitcoin’s price action has taken a sharp bearish turn, slipping below the crucial $109,500 support level that once marked a strong foundation for its rally.
After peaking at $126,110, momentum turned bearish, with key indicators and wave patterns confirming the shift.
The market now faces the possibility of an even sharper drop toward $85,700.
Bitcoin Closes Below Support
The weekly time frame price action shows that Bitcoin is closing below its most critical level in the chart.
The horizontal area is at $109,500, and initially acted as resistance in May 2025.
Then, the Bitcoin price validated it as support (green icon) in September before moving to its all-time high of $126,110.
Get These Top Crypto Casino Offers Now!
Sponsored
Disclosure
We sometimes use affiliate links in our content, when clicking on those we might receive a commission at no extra cost to you. By using this website you agree to our terms and conditions and privacy policy.
However, the second retest of the $109,500 area did not result in a bounce, and the price of Bitcoin is currently breaking down from this area.
There is no more support until the horizontal and Fibonacci level at $85,710, so the crash will continue unless Bitcoin reclaims the $109,500 level.
Momentum indicators are decisively bearish. The Relative Strength Index (RSI) and Moving Average Convergence/Divergence (MACD) have generated bearish divergences (orange).
The RSI fell below 50 and the MACD made a bearish cross, confirming that Bitcoin’s breakdown is legitimate and bears have taken over.
As a result, Bitcoin’s prediction is bearish, and the most likely outlook predicts a 16% drop to $85,700.
Bitcoin’s Bearish Trend
The long-term wave count is negative, showing a completed five-wave upward move since November 2022.
Wave five created an ascending wedge, which is part of an ending diagonal. Since the Bitcoin price broke down from the wedge, it confirmed the bearish formation and the fact that new lows are likely.
In addition to this, the monthly candlestick for October was a shooting star, which usually transpires at the end of bull cycles.
Finally, the RSI and MACD generated bearish divergences, while the latter also formed a bearish cross (indicated by the black circle).
In the previous cycle, these signals marked the peak of previous market cycles and initiated massive and prolonged downward trends.
Therefore, all long-term signals indicate a bearish Bitcoin price prediction, suggesting that the market cycle has come to a close.
Bullish Bitcoin Alternatives
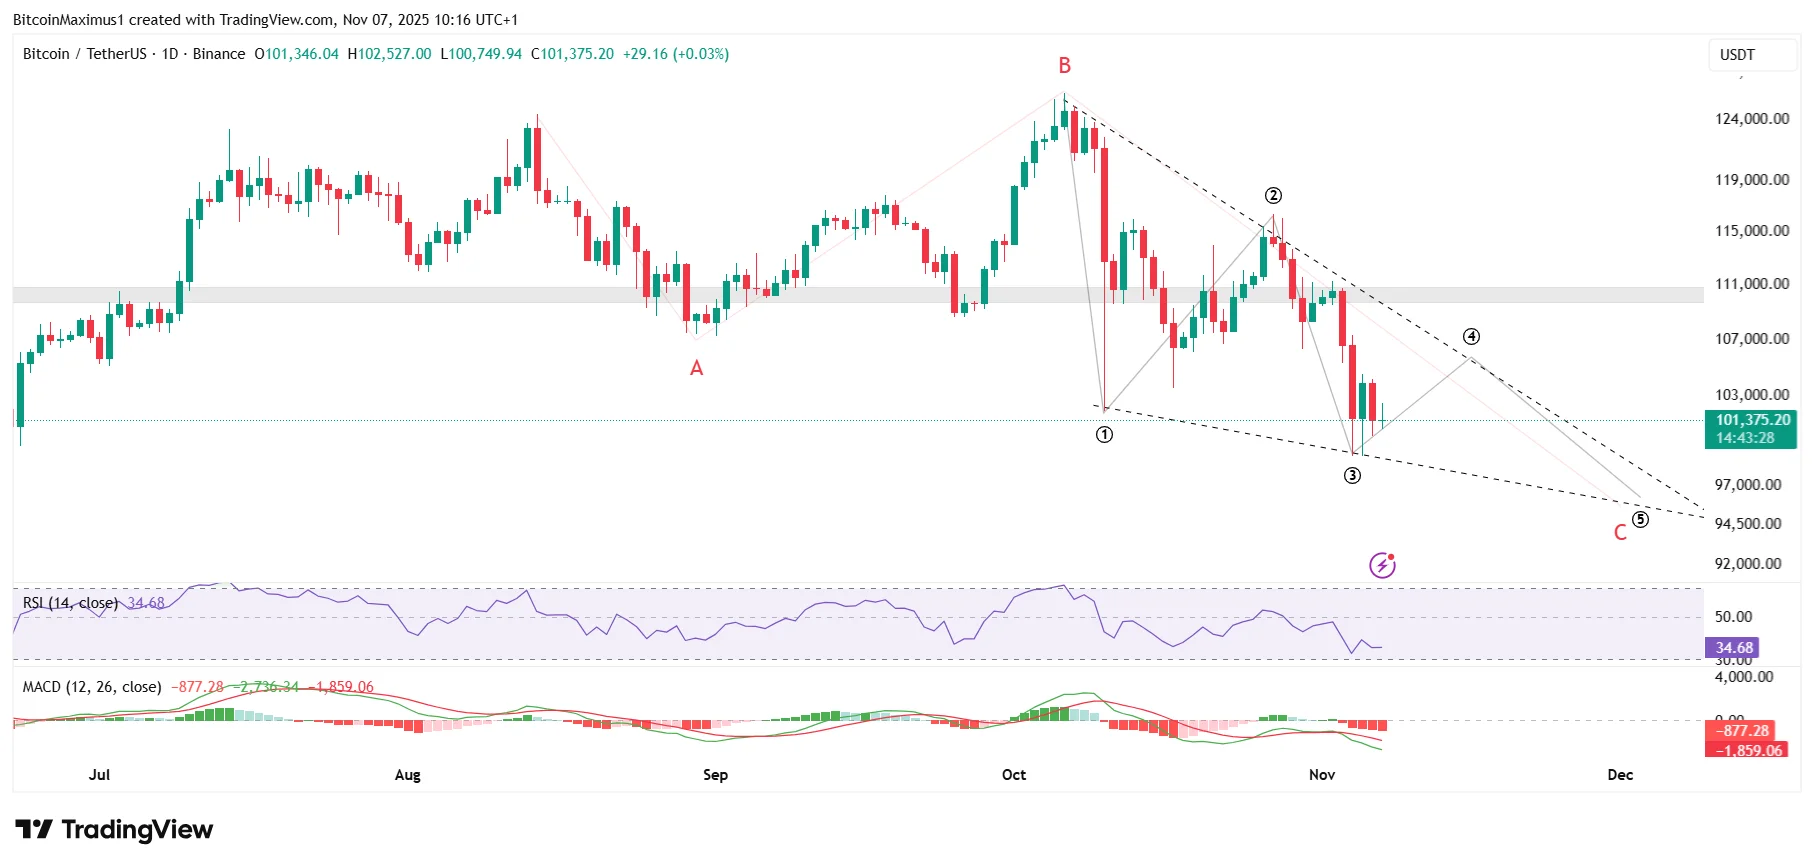
The primary bullish Bitcoin alternative comes from an irregular flat wave count, which suggests the price of Bitcoin is completing wave C in an A-B-C correction.
If this is the case, wave C has developed into an ending diagonal, as evidenced by the descending wedge shape.
Moving on with this projection suggests the price of Bitcoin is completing a corrective wave four (black), after which another downward movement is likely.
Waves A and C have nearly a 1:1.61 proportion, so the next decline will likely not be as significant.
Then, a breakout from the wedge will confirm the correction is over and could lead to a retest of the $110,000 region.
However, it is worth mentioning that neither the RSI nor the MACD has shown any bullish reversal signs. On the contrary, both indicators are falling and are in bearish territory.
Hence, besides the count, there are no other bullish trend reversal signs whatsoever.
Bitcoin’s Dominance Rises
Whether the Bitcoin trend is bullish or bearish, its dominance is likely to rise in the near future. Several signs indicate that this will occur.
Firstly, the BTCD has broken out from the 60.55% resistance and validated it as support. The resistance had held since August, so moving above it is a sign that the trend is bullish.
Secondly, the BTCD completed an A-B-C correction since the cycle high in July. Since the correction is over, a new upward movement has begun.
Finally, the RSI and MACD are both surging, legitimizing the breakout.
As a result, Bitcoin’s dominance could surge to the 0.618 Fibonacci retracement resistance level at 62.65% and possibly move higher.
Bitcoin Heads Lower This Year
Overall, Bitcoin’s price action and indicators suggest the bears are in control, with a likely drop toward $85,700 unless the $109,500 level is reclaimed.
While a bullish scenario remains possible under a corrective wave structure, momentum signals lack confirmation.
Until reversal signs emerge, traders should expect continued downside volatility before any recovery could occur.
Disclaimer:
The information provided in this article is for informational purposes only. It is not intended to be, nor should it be construed as, financial advice. We do not make any warranties regarding the completeness, reliability, or accuracy of this information. All investments involve risk, and past performance does not guarantee future results. We recommend consulting a financial advisor before making any investment decisions.
Valdrin Tahiri is a cryptocurrency analyst and reporter at CCN, specializing in technical analysis with a focus on Elliott Wave theory, on-chain metrics, and fundamental research. He brings over seven years of experience in the crypto space as both a trader and writer.
He discovered cryptocurrencies in 2017 while earning his MSc in Financial Markets at the Barcelona School of Economics, which sparked a deep interest in blockchain and market dynamics. Since then, he’s contributed to top crypto outlets like BeInCrypto and CoinGape.
Valdrin also served as Community Manager of BeInCrypto’s Telegram group for three years, helping grow it into one of the largest crypto communities worldwide. His expertise in market structure and price patterns allows him to break down complex trends into clear, actionable insights.
He’s published thousands of articles covering altcoins, Bitcoin cycles, and macro trends.