Why is the Bitcoin Price Crashing? | Credit: Derek Fenech
Share
Key Takeaways
Bitcoin’s (BTC) price risks breaking down from the $106,000 support area.
The Bitcoin price broke down from a short-term ascending parallel channel.
Can Bitcoin regain its footing, or has it already started its bear market?
Bitcoin’s recent crash has shaken the market’s confidence as BTC risks breaking below its main horizontal support level.
Bitcoin has declined 18% since its all-time high, a sign that the bear market may have begun.
With that in mind, let’s examine the charts to understand why Bitcoin is dropping and whether the drop will continue.
Why is Bitcoin Dropping?
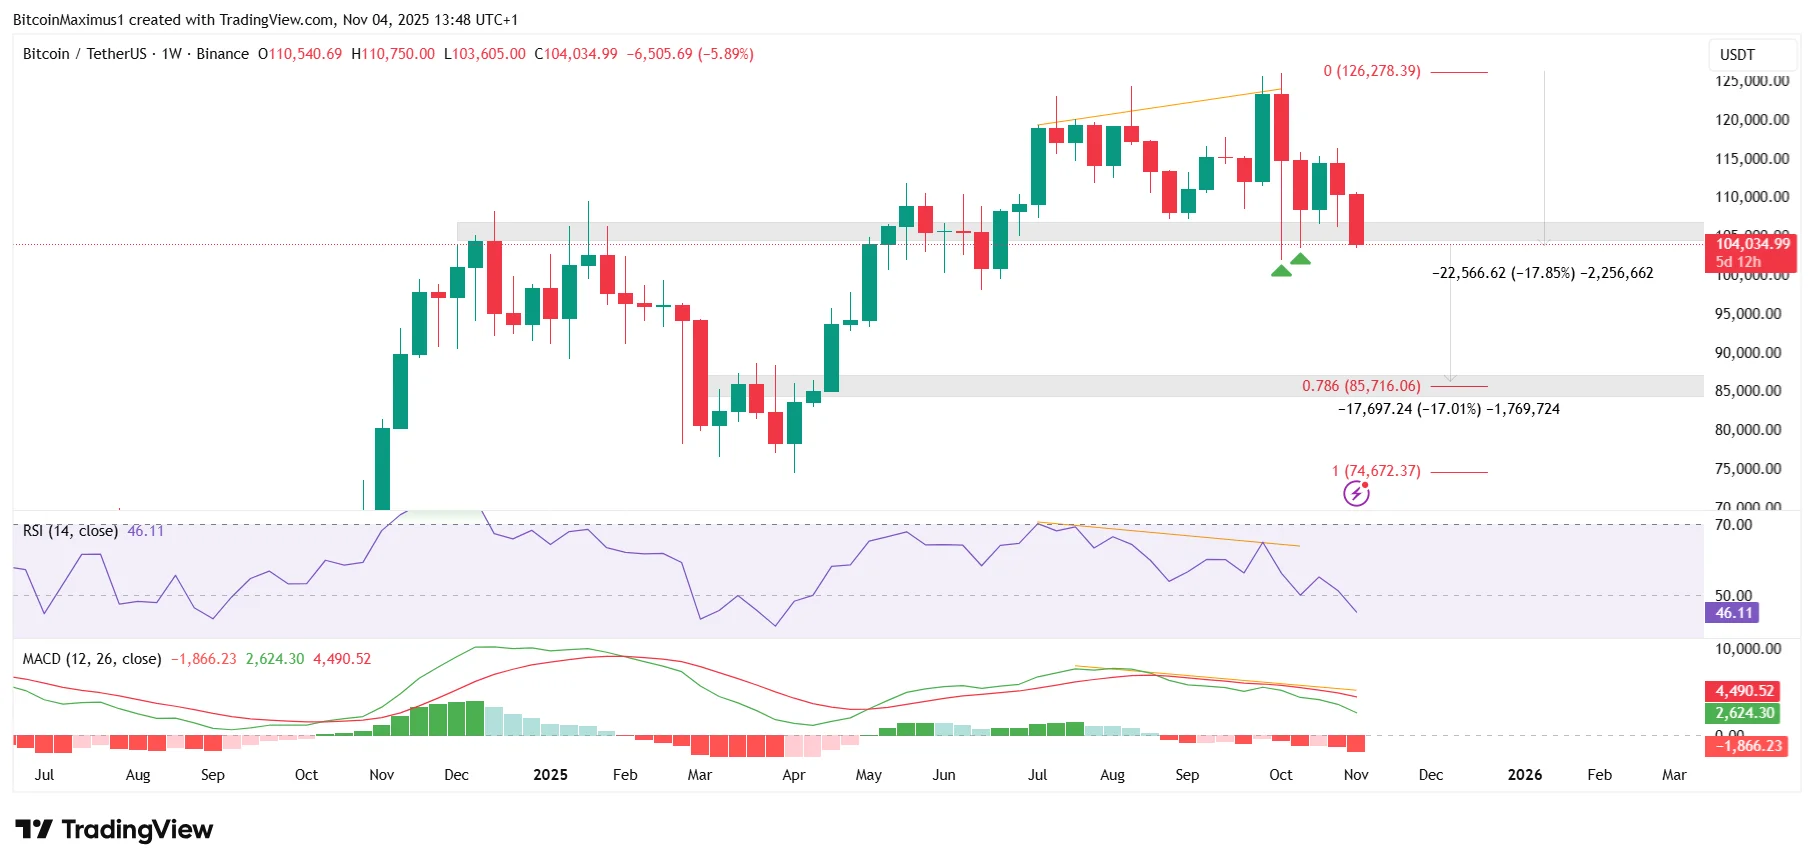
Bitcoin’s price action shows an 18% price decrease since the all-time high of $126,199 in October.
At first, Bitcoin’s crash ended at the $106,000 horizontal support, creating several long lower wicks (green icons).
While this was a temporary retest of the previous breakout level, the Bitcoin price is closing below the $106,000 horizontal area.
Get These Top Crypto Casino Offers Now!
Sponsored
Disclosure
We sometimes use affiliate links in our content, when clicking on those we might receive a commission at no extra cost to you. By using this website you agree to our terms and conditions and privacy policy.
If it does that, it will break down below the final support level before $85,700 and confirm that the entire previous breakout, which has been ongoing since June, was just a deviation.
In short, a breakdown below $106,000 will confirm that Bitcoin’s bull cycle has already ended and the price is mired in a lengthy downward trend.
The $85,700 Fibonacci and horizontal support is another 17% below the current price, so Bitcoin could continue dropping if it closes below the $106,000 horizontal area.
Besides the breakdown, the most worrying sign is the bearish readings from technical indicators. Bearish divergence in the weekly Relative Strength Index (RSI) and Moving Average Convergence/Divergence (MACD) preceded the decrease.
Additionally, the RSI is below 50, and the MACD has formed a bearish cross, approaching zero.
Hence, the long-term price action and indicator readings suggest a bearish Bitcoin price prediction, indicating that the crash will likely persist for some time.
Key Bitcoin Level
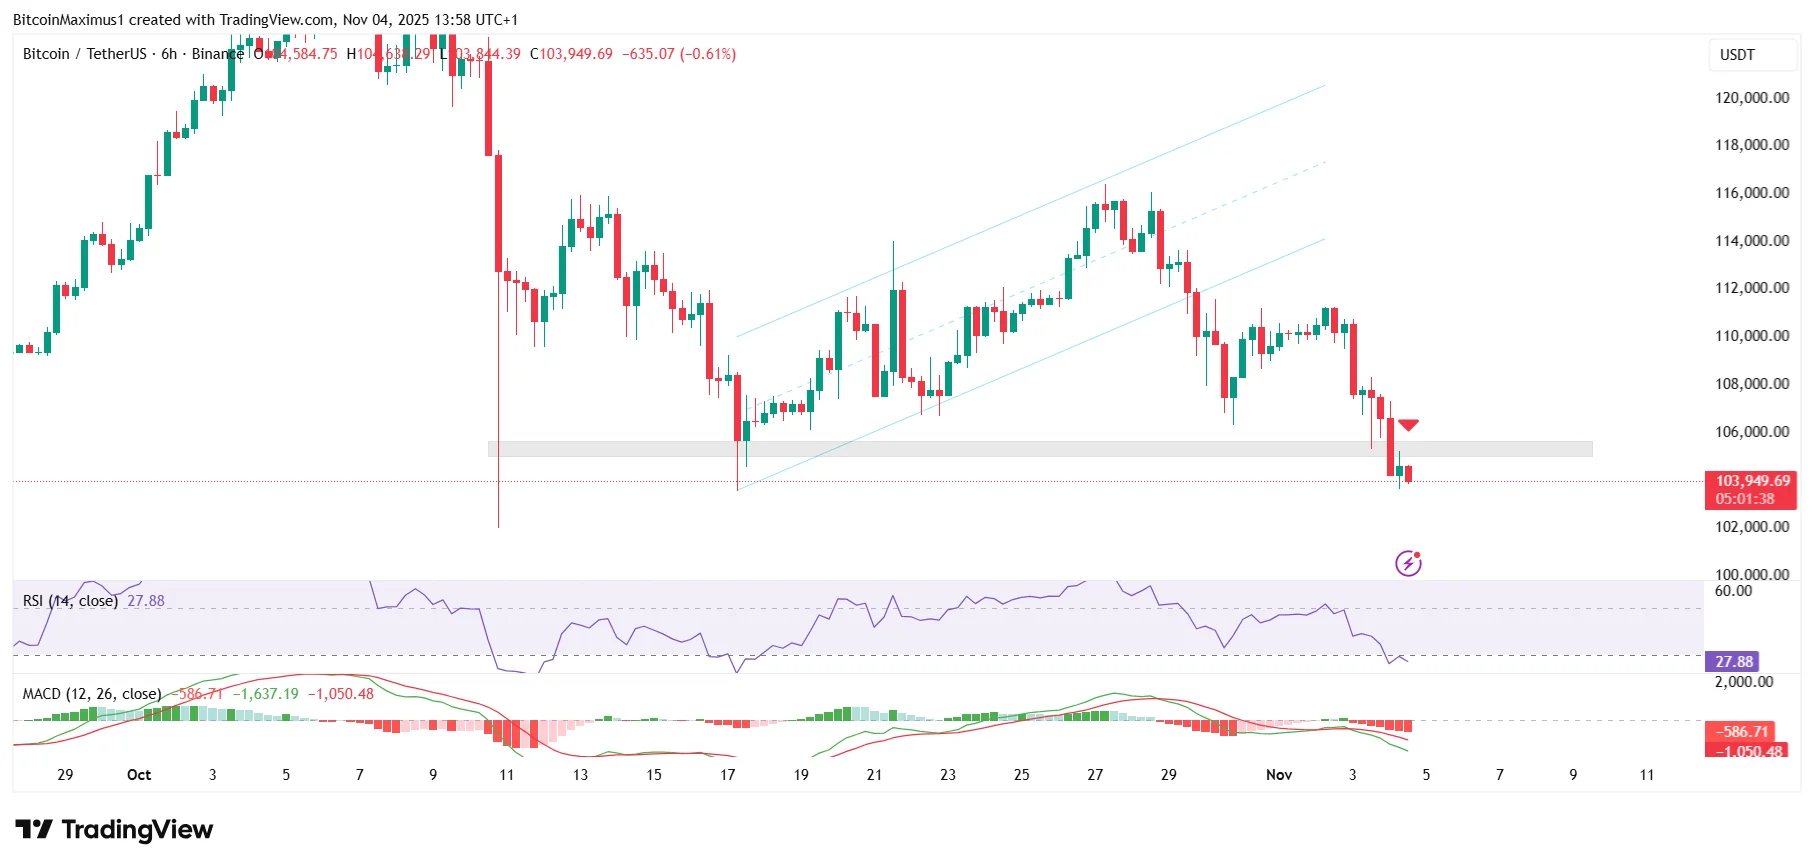
The short-term six-hour chart echoes the bearish readings from the weekly time frame.
Firstly, the price action confirms that Bitcoin’s bounce, which began on October 17, is corrective.
This is because the price of Bitcoin increased inside an ascending parallel channel before breaking down on Oct. 19.
Secondly, the monthly RSI has generated a bearish divergence (orange), which has historically led to a bearish trend reversal.
The bearish divergence in the MACD and the bearish cross (indicated by the black circle) also corroborate these findings.
Finally, the candlestick for October was bearish, the final sign of a market cycle top.
Negative Bitcoin News
In addition to the extremely bearish price action, crypto market news is highly detrimental.
Rumors are circulating that Wintermute may sue Binance over unfair Auto-Deleveraging (ADL) liquidations during the October 10 crash, which resulted in $19 billion in wiped-out positions. However, no lawsuit has been filed yet.
Binance admits system overloads but denies wrongdoing, as the event further erodes trust in centralized exchanges.
Despite the denials, users worry about the potential impact a legal battle between the largest Centralized Exchange (CEX) and one of the most significant algorithmic trading firms could have on the already struggling crypto market.
Worst is Yet to Come
With bearish divergences flashing across key indicators and mounting uncertainty surrounding news regarding Binance and Wintermute, Bitcoin’s prediction remains grim.
A decisive close below $106,000 could confirm the end of the current bull run, potentially sending BTC toward the $85,700 support zone.
Bitcoin may be headed into a long-term bearish phase unless bulls regain momentum soon.
Disclaimer:
The information provided in this article is for informational purposes only. It is not intended to be, nor should it be construed as, financial advice. We do not make any warranties regarding the completeness, reliability, or accuracy of this information. All investments involve risk, and past performance does not guarantee future results. We recommend consulting a financial advisor before making any investment decisions.
Valdrin Tahiri is a cryptocurrency analyst and reporter at CCN, specializing in technical analysis with a focus on Elliott Wave theory, on-chain metrics, and fundamental research. He brings over seven years of experience in the crypto space as both a trader and writer.
He discovered cryptocurrencies in 2017 while earning his MSc in Financial Markets at the Barcelona School of Economics, which sparked a deep interest in blockchain and market dynamics. Since then, he’s contributed to top crypto outlets like BeInCrypto and CoinGape.
Valdrin also served as Community Manager of BeInCrypto’s Telegram group for three years, helping grow it into one of the largest crypto communities worldwide. His expertise in market structure and price patterns allows him to break down complex trends into clear, actionable insights.
He’s published thousands of articles covering altcoins, Bitcoin cycles, and macro trends.