Is Ethereum Close to a Massive Crash? | Credit: Hameem Sarwar
Share
Key Takeaways
Ethereum’s (ETH) price crashed below the $4,000 horizontal area.
The Ethereum price has completed a long-term corrective movement.
Ethereum shows no signs of recovery and may continue to decline for the rest of the year.
Ethereum (ETH) has seen a sharp downturn, breaking below the critical $4,000 support level and signaling growing bearish momentum.
After months of holding above this key zone, Ethereum’s price action and momentum indicators point toward a possible trend reversal.
Ethereum’s news is also negative, as its Decentralized Finance (DeFi) protocol Balancer was hacked for over $70 million earlier this week.
With both technicals and news signaling weakness, Ethereum appears set for an extended and severe downturn.
Why is Ethereum Dropping?
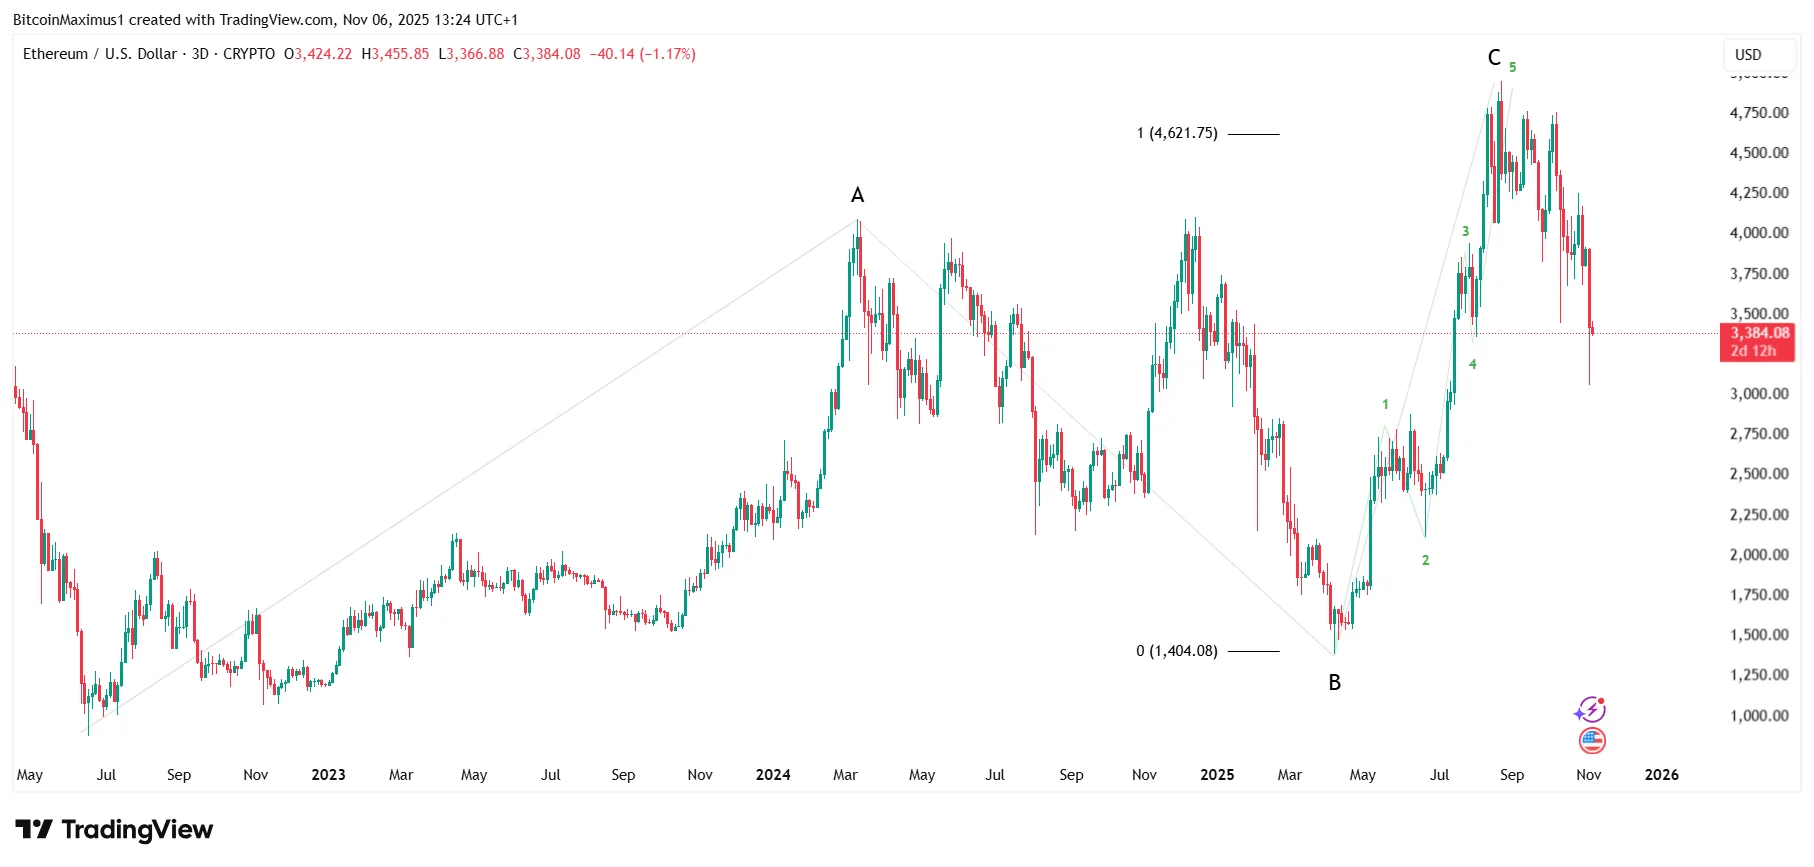
The Ethereum price has dropped since its all-time high price of $4,955 in August.
Initially, the downward movement was gradual, as the price of ETH remained above the $4,000 horizontal area, seemingly validating it as support.
However, that was not what ultimately happened. On Oct. 10, the price of Ethereum fell to a low of $3,436 before bouncing and creating a long lower wick (green icon).
Get These Top Crypto Casino Offers Now!
Sponsored
Disclosure
We sometimes use affiliate links in our content, when clicking on those we might receive a commission at no extra cost to you. By using this website you agree to our terms and conditions and privacy policy.
While the bounce was bullish and prevented a breakdown from the $4,000 horizontal area, the depth of the decline was a warning sign that the trend was turning bearish.
These bearish fears were confirmed this week, as Ethereum decisively broke below the $4,000 threshold, further solidifying its downward trend.
Momentum indicators align. The Relative Strength Index (RSI) is decreasing below 50 while the Moving Average Convergence/Divergence (MACD) has made a bearish cross (red icon).
Based on these readings, Ethereum’s prediction is bearish, indicating that the downward trend is likely to persist throughout the year and beyond.
The most likely count identifies an A-B-C corrective structure (black) since June 2022, where waves A and C reflect significant downward price moves, and wave B represents a temporary reprieve.
This count suggests that the overall structure is corrective, indicating a bearish continuation.
If the count is accurate, it suggests that the entire upward movement of this cycle has been corrective.
Waves A and C have close to the same ratio, which is another sign that suggests the count is accurate.
Disclaimer:
The information provided in this article is for informational purposes only. It is not intended to be, nor should it be construed as, financial advice. We do not make any warranties regarding the completeness, reliability, or accuracy of this information. All investments involve risk, and past performance does not guarantee future results. We recommend consulting a financial advisor before making any investment decisions.
Valdrin Tahiri is a cryptocurrency analyst and reporter at CCN, specializing in technical analysis with a focus on Elliott Wave theory, on-chain metrics, and fundamental research. He brings over seven years of experience in the crypto space as both a trader and writer.
He discovered cryptocurrencies in 2017 while earning his MSc in Financial Markets at the Barcelona School of Economics, which sparked a deep interest in blockchain and market dynamics. Since then, he’s contributed to top crypto outlets like BeInCrypto and CoinGape.
Valdrin also served as Community Manager of BeInCrypto’s Telegram group for three years, helping grow it into one of the largest crypto communities worldwide. His expertise in market structure and price patterns allows him to break down complex trends into clear, actionable insights.
He’s published thousands of articles covering altcoins, Bitcoin cycles, and macro trends.